Introduction
In 2018, I introduced a game theory approach for comparing baseball projection systems. Proudly, the original article was nominated for Baseball Article of the Year by the Fantasy Sports Writers Association (FSWA). Today, I am proud to release the same in-depth analysis for the fifth consecutive year!
As I inform the readers each year – the approach used in this study is NOT the standard projections comparison that most others perform. The standard analysis involves calculating least square errors, performing chi-squared tests, or perhaps even hypothesis testing. Some type of statistical measure is used to determine the most accurate projections.
My methodology does not incorporate a statistical model. Instead, it looks to determine the profitability potential of each projection system by simulating what would have happened in a fantasy auction draft. Instead, it games the projections.
For a full explanation of the game theory methodology (and for comparison), please refer to the past articles: 2021 2020 2019 2018
Effectiveness over Accuracy
Rather than testing projection accuracy, the game theory approach assesses effectiveness.
Accuracy does not always tell the full story.
To illustrate this, consider the following two hypothetical player projections from two different projection systems:
Player Example
|
Player A |
Player B |
| Razzball Projection |
$32 |
$20 |
| ATC Projection |
$12 |
$16 |
|
|
|
| Market Price / AAV |
$2 |
$18 |
For Player A, the projection systems are far apart, yet both models price the player far above the market. For Player B, the projection systems are close to one another. Razzball is a few dollars over the market price, and ATC is a few dollars below.
What is important to note is that Razzball will have the propensity to purchase both Players A & B, while ATC will only purchase Player A. What is even more crucial to understand is that the price that Razzball will pay for Player A will be identical to the price that ATC will pay – at $2.
The market price sets the price.
A projection system only decides whether or not to pay the price or not.
Continuing with this fictitious example, suppose the final accumulated values of Player A and B turned out to be $32 and $2, respectively.
Statistical Test: Absolute Errors
|
Player A |
Player B |
Total |
| 2022 Final Value |
$32 |
$2 |
|
|
|
|
|
| Razzball Projection |
$32 |
$20 |
|
| ATC Projection |
$12 |
$16 |
|
|
|
|
|
| Razzball Absolute Error |
$0 |
$18 |
$18 |
| ATC Absolute Error |
$20 |
$14 |
$34 |
Considering the absolute value of errors (one such statistical test), Razzball was the more accurate projection system.
Razzball was spot on for Player A, whereas ATC was way off in its prediction. As for Player B, both systems were both highly inaccurate. On the whole, Razzball generated a lower aggregate absolute error. In this statistical test of accuracy, Razzball would be declared the winner.
Now, let’s consider the profitability of each projection system from a fantasy perspective. There are three key elements to understand here:
- Since Razzball’s projection for both Players A & B was above the market’s cost demands – Razzball would have had the propensity to purchase shares for both Players A & B. In contrast, only ATC’s projection for Player A was above the market’s asking price. ATC would end up with shares of Player A, and decline to Purchase Player B.
- No matter what value the projection system computes – the purchase price of a player is always the same – and is set by the market. In a fantasy baseball auction, a player is purchased if you spend $1 more than the next highest bid without regard to projections.
- No matter what a player was projected for before the season starts, the profit (or loss) earned for him during the season is the same. It doesn’t matter if your projection system showed a preseason expected profit of $10, $20 or -$15. If you purchase a player on your fantasy team, you will earn the actual realized profit.
Consider these final earned player values for 2022:
Projection System Profitability
|
Player A |
Player B |
Total |
| 2022 Final Value |
$32 |
$2 |
$34 |
|
|
|
|
| Razzball Spend |
$2 |
$18 |
$20 |
| ATC Spend |
$2 |
N/A |
$2 |
|
|
|
|
| Razzball Final Player Values |
$32 |
$2 |
$34 |
| ATC Final Player Values |
$32 |
N/A |
$32 |
|
|
|
|
| Razzball Net Profit |
$30 |
($16) |
$14 |
| ATC Net Profit |
$30 |
N/A |
$30 |
Despite Razzball’s spot on prediction of Player A – the net profit accumulated by each projection was the same. ATC’s projection of $12 was above the market, and so it produced a “BUY” signal for player A. Similarly, Razzball also produced a “BUY” signal. It didn’t matter than ATC wasn’t all that accurate on the player evaluation – it only mattered that it was above the market. In the end, the total fantasy profit realized was the same.
However, for Player B – as ATC produced a “PASS” signal, it avoided purchasing a value draining commodity. Razzball succumbed to the landmine, and ceded $16 of value along the way. Despite the overall favorable statistical accuracy of Razzball to ATC, in practice, it produced a net profit of $14 to ATC’s $30.
You were better off having ATC’s projection in-hand, rather than having Razzball’s figures in the above example.
To me, this is truly the heart of it all. This game theory comparison approach provides a method to compare the historical effectiveness of the projection systems.
The Projection Systems
Below are the projection systems that I have analyzed for 2022:
2021 Baseball Projection Systems
| Projection System |
Creator |
| Pod |
Mike Podhorzer |
| ATC |
Ariel Cohen |
| THE BAT / THE BAT X |
Derek Carty |
| Razzball |
Rudy Gamble |
| Steamer |
Jared Cross |
| ZiPS / ZiPS DC |
Dan Szymborski |
The authors of the projection systems in 2022 are identical to last year’s compliment. Once again, I will also be comparing the ATC, THE BAT / THE BAT X, Steamer and the ZiPS projection systems. All were available earlier this year on FanGraphs. In addition, as per usual – I include my colleague Mike Podhorzer’s Pod projections, as well as Rudy Gamble’s Razzball projections.
Methodology
The game theory methodology of comparison is identical to last year. Once again, here is the procedure:
1) Start with the raw projections data (AB, H, HR, IP, K, etc.). For this analysis, I have assembled each projection system’s stats as of the day prior to Opening Day 2022.
2) Produce a projected value for each player, by system. For this valuation, I use my own auction calculator, which follows a Z-Score methodology (similar to the FanGraphs auction calculator). So that I can best compare projected values to “market,” I use the NFBC main event settings (15 teams, mixed AL/NL, $260 budget and positions, standard 5×5 scoring). I also assume that players were eligible only at their original 2022 positions + any positions that they were expected to gain in the first 2 weeks of the season.
3) Adjust the projected player values to obtain a Price Point for each player. For this, I have assumed the following:
Projection Price Points
| Projected Price |
Price Point |
| < $1 |
Do Not Buy |
| $1 to $4 |
$1 |
| $5 to $9 |
$3 Discount |
| $10 to $14 |
$2 Discount |
| $15 to $19 |
$1 Discount |
| $20 to $27 |
At Cost |
| $28 to $35 |
$1 Premium |
| $36 to $40 |
$2 Premium |
| > $40 |
$3 Premium |
For example, if Steamer projects a player for $17 – I assume that the maximum that it would pay for the player is $16. If it projected a player for $42 – I assume that it would pay up to $45. Any player below replacement will not be purchased in this exercise.
This attempts to simulate what happens in real life fantasy draft/auctions. Managers typically purchase players at the top for a premium. In the mid-rounds, players are purchased roughly at their projected cost. Towards the endgame, players are only purchased for discounts.
4) Obtain an Auction Price. I use an average auction value (AAV) for each player. For this, I am using actual NFBC AAVs for auctions in the month of March.
5) Compute the rotisserie player values for this season. This will represent what a player was worth in 2022. It is computed using the same methodology as above in #2.
Note that for all of the above, I have let the Z-Score method determine the inherent Hitter/Pitcher split of the total auction dollars. This will differ from the NFBC AAVs, which is typically pitcher heavy (and was about 62/38 this past year).
6) Players were then “purchased” for a system if their Price Point was higher than the player’s AAV.
Terminology – I identify a player as “purchased” as long as they appear to be a bargain for the given system.
I then tracked the number of players purchased who were profitable, the number of players purchased who were unprofitable, and their respective gains and losses.
Results
First, let’s look at the number of players that each system would “buy.” To get a sense of where the projection systems purchase their players – displayed are the number of players that would be bought by each system, for the top N cumulative players, ranked by AAV.

Let’s start by looking at players in the top 50. Typically, only around 3-6 players are purchased by each projection system.
However, in the past two seasons, something has changed. Projections have been finding more potential bargains. Last year, a record high 9-15 players were purchased in the top few rounds depending upon system. This year (aside from ZiPS), anywhere between 4-9 players were purchased – still on the high side.
This rise in projection “buys” close to the top is important to note. After digging in a bit deeper, I noticed that the increase in player purchases came mainly from players selected in what would be the late 3rd round / early 4th round (approximately ADP Rank 40-48, or $23-27 AAV). Using my unique fantasy terminology, I would note that we are seeing a market discount at that price point. In other words, the market is ceasing to go the extra dollar above what projections value players between $23-27.
Yes, last year’s abnormally high figures may be partially due to the result of the nature of 2021 projections (more uncertainty coming off of the 2020 short season). However, as the figures in 2022 are not only elevated, but occur in the same short portion of the draft – I do believe that it is a real market trend. It remains to be seen what will happen in 2023, but for now, look for a possible market discount for players in the $23-27 AAV range.
Back to the main analysis …
This year, it was THE BAT that had the most purchases up and down the player pool. This has usually been the case for the system. It was ATC that purchased the fewest players across the board this year, which is also typical for ATC [other than during the 2021 season]. ZiPS is usually vastly different than the other projections; they purchase far more players in the first 100, and then far fewer player after ADP 300. The 2022 season appeared to be no different for ZiPS.
Generally speaking, the frequency of projection purchases in 2022 mimicked their own historical levels – a sign that projection buying tendencies do in fact persist year to year. This is a good outcome for drafters who rely on projections – to have the knowledge that projections operate in a reliable manner from year to year.
Onto profitability …
In the below:
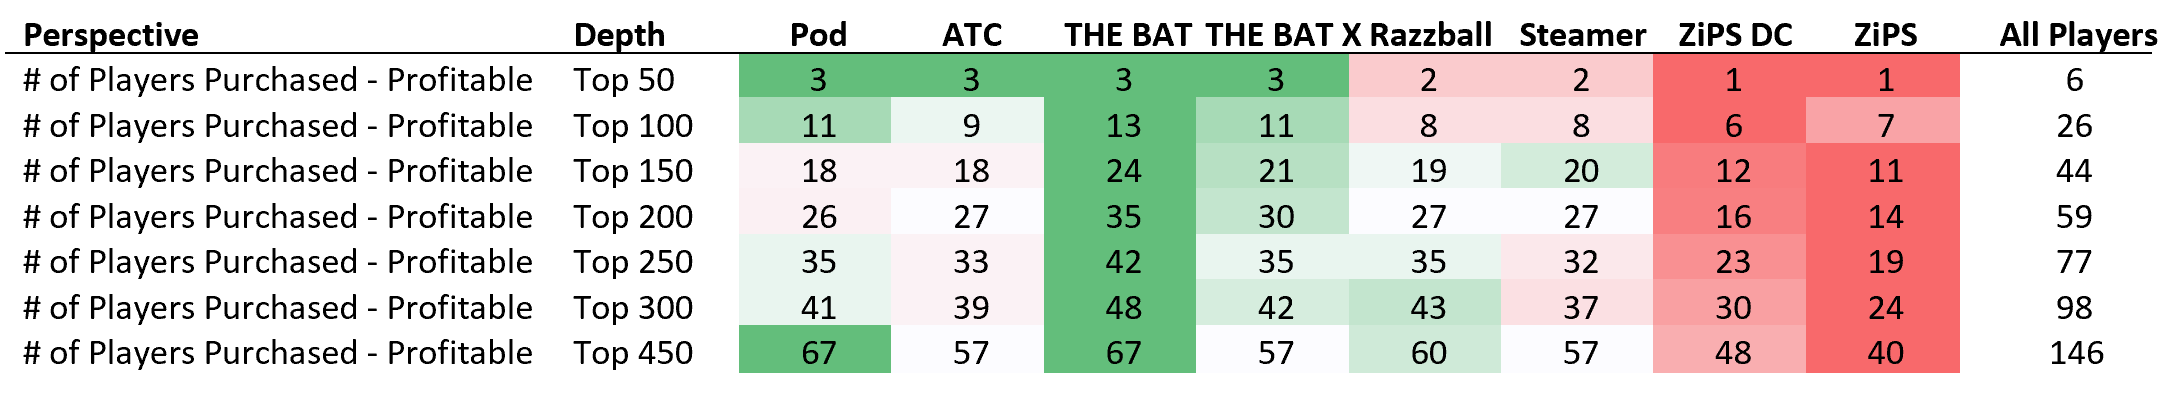
GREEN colored figures represent the more successful projection results. RED colored figures represent less successful results. The “All players” column displays the figure for purchasing every player. “All Players” essentially represents the market.

First, what needs to be pointed out is that frequency of success or “hit rates” are extremely important. The magnitude of success (or failure) may change wildly for projections year over year – but the hit rates tend to be fairly stable. It is always more important to have more favorable outcomes in the more controllable [less volatile] aspect of a model.
On top of that, remember that the magnitude of success (or failure) of a player is the same regardless of the underlying projection. If two projections give a specific player a “BUY” signal – both projections realize the same profit for the player. If two projections give a specific player a “PASS” signal – both projections also realize the same profit for the player, which is $0. The idea is always to have more correct “BUY” signals, and more correct “PASS” signals.
For 2022 – out of the most expensive 50 players of the auction, only 6 turned a profit (12%). This was the lowest figure that we have seen to date in this study. Typically, we see 16-20% of the top players turn a profit. Profitable players inside the top 50 this season included Aaron Judge, Freddie Freeman, Pete Alonso, Manny Machado and Sandy Alcantara.
Pod, ATC, THE BAT and THE BAT X identified three of the six profitable players. Razzball and Steamer identified two, and ZiPS / ZiPS DC identified but one.
In terms of success rates, ATC had the highest percentage of their “purchased” players returning a profit within the top 50 at a whopping rate of 60%! This was the highest figure of any projection system in any season analyzed thus far. Pod and Razzball were also excellent this year at 50%. ZiPS at 7% was the far-off laggard. But by and large, it cannot be understated enough that this was an enormously good year for projections [over the market] in the top ranks.
In the 50-100 range, THE BAT was king with a 63% success rate (a 52% cumulative top 100 success rate). ATC also held firm in the second range at 60%. With the slew of green that can be seen above, THE BAT was also the most successful at finding profitable players in the 150+ range. THE BAT finished with an amazing 50% overall success rate for the full player pool, while ATC was a close second at 48%.
Both Razzball and Steamer’s hit rates up and down the curve closely matched their historical figures. ZiPS DC, however, took a nosedive from last year’s excellent results. THE BAT X continued to be successful in this category, but in 2022, they trailed their sister projections [THE BAT].
It is hard to award an overall winner for 2022 hit rates, but we can more easily bifurcate the winners. I would award it to ATC in the top 150 players, and to THE BAT thereafter.
Again, this was a great year for projections, especially at the top. Projections purchased more players, and at the same time had a higher success rate. It doesn’t get better than that.
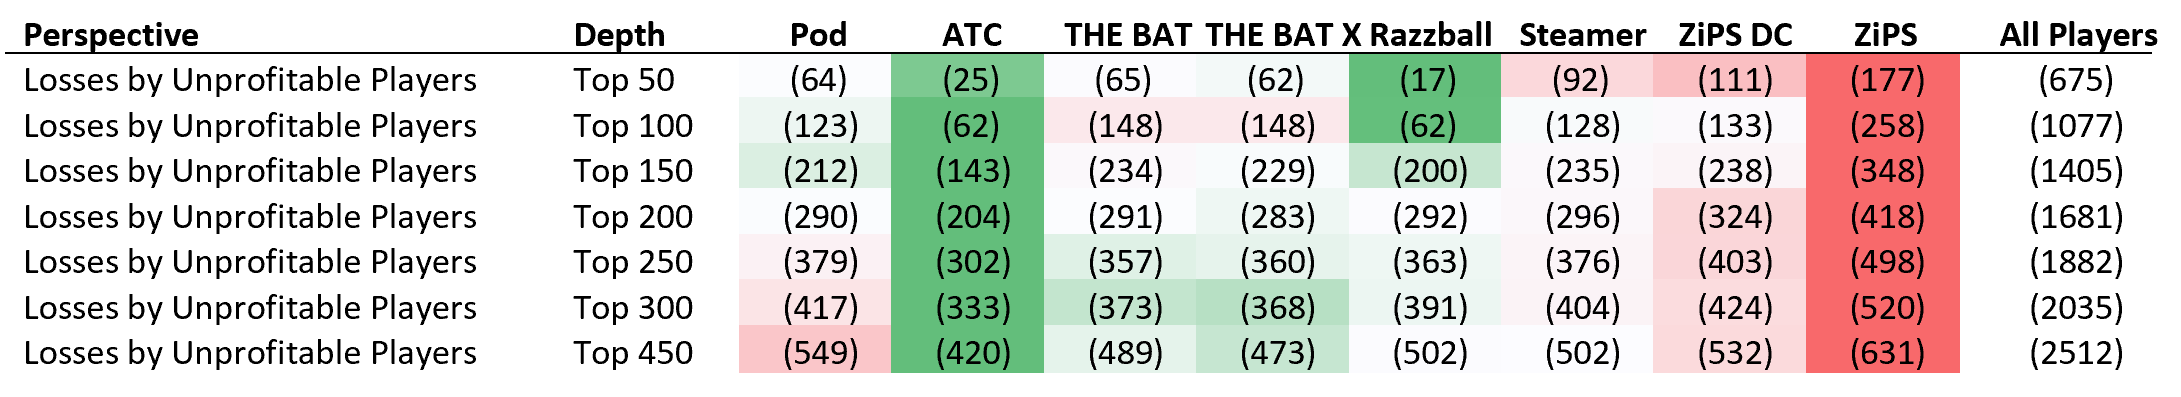
Now for unprofitable players …
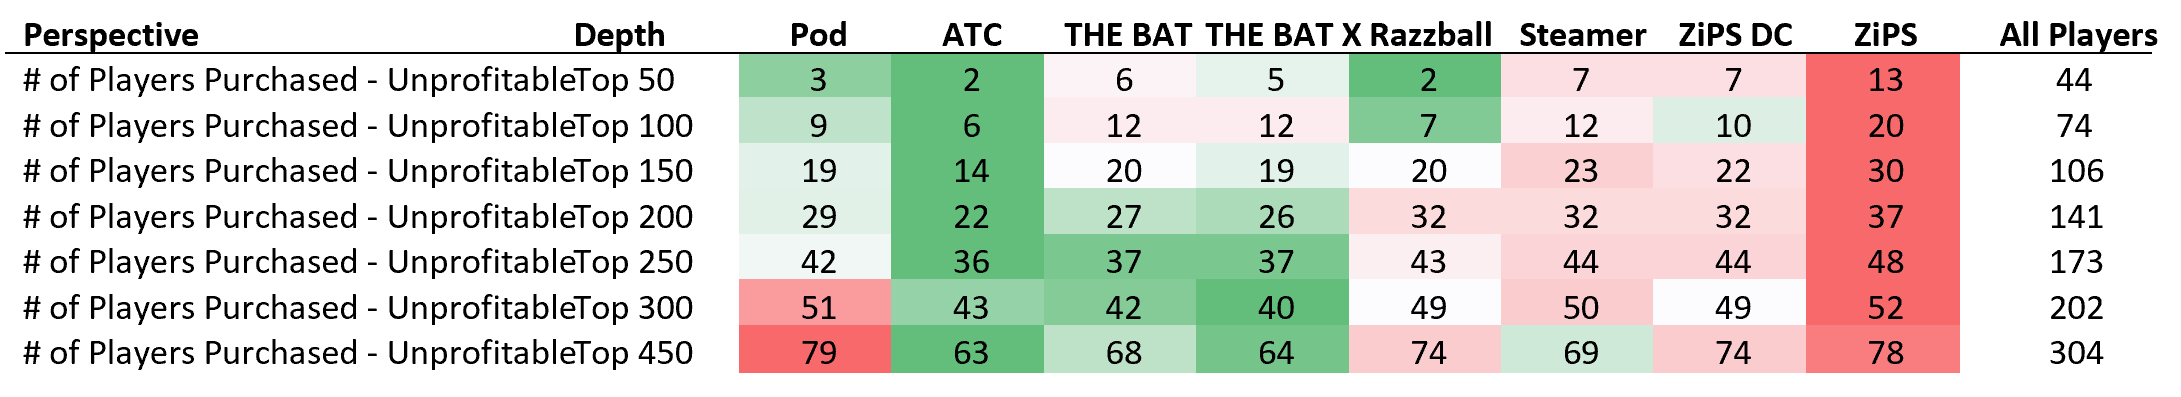

Now let’s look at players purchased for a loss. We expect that most of the top players to be unprofitable. The rate table shown is the compliment of the profitable one above (all percentages will sum to 100%). The added information here is the quantity of failures.
ATC is the clear winner this season for unprofitable players. ATC purchased the fewest number of failures in 2022 overall, and in just about every single player range. Other than last year, ATC has done won this category in every single season of this study. Clearly, the strength of ATC isn’t as much as finding the profitable players, as it is in avoiding the unprofitable ones.
Razzball had a good showing in this category in the top 100 players. Steamer was excellent above player 300. THE BAT and THE BAT X were excellent up and down the board – with THE BAT X edging out THE BAT.
Now onto the magnitude of player acquisition …
For the magnitude of gains, it greatly helps to first see how profitability has changed over time. Below is how the “All Players” column has looked over the past five seasons. [For this particular chart I have replaced the “All Players” terminology with “ADP.”]

First of all, we have to ignore the 2020 year. The short season resulted in an abnormally high gain rate per hit. Since the ending player values were more widely distributed – the highs were higher, and the lows were lower. The above chart tackles the highs.
Aside from 2020, what we see here is a downward sloping trend from 2018 to 2021, and then an overall upward tick in 2022! Thanks to New York stars Aaron Judge and Pete Alonso this year, the top 50 players produced the highest market gains per profitable player ever with a 10.0 result! Other player depths also displayed a small reversal of the five-year downward trend.
For the full player pool though, gains are still down – from an average of 7.9 in 2018 to 7.4 in 2021 and now down to 7.3. Essentially, the perspective of making large gains [with multiple players] from late draft picks has become harder and harder as time has gone on.

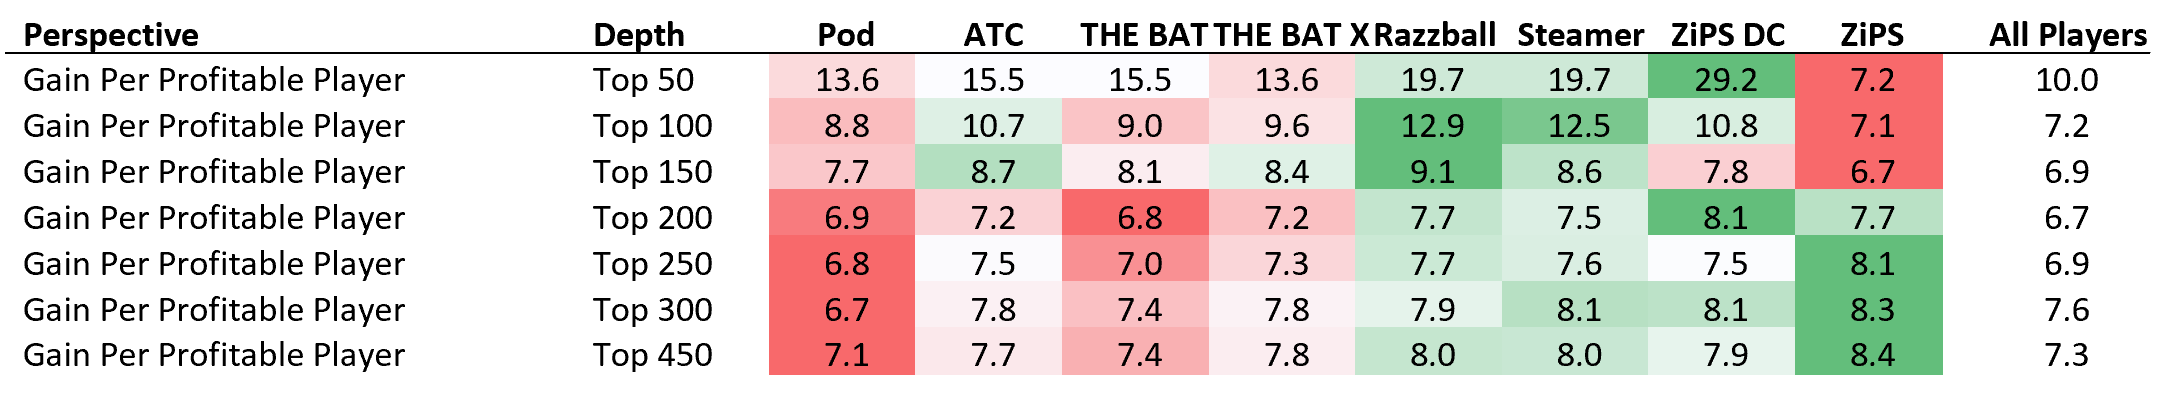
Clearly, in terms of pure dollars – THE BAT ended up seizing more than any other projection this year – but not on a per purchase basis. ZiPS was the best projections in terms of gain magnitude on the full player pool. ZiPS DC was excellent for the higher valued players. Razzball and Steamer were also superb throughout.
However, profitability varied quite a bit this year by projection by player range. Let’s dig a bit deeper …
Below in an incremental view of gains per player by ADP range:
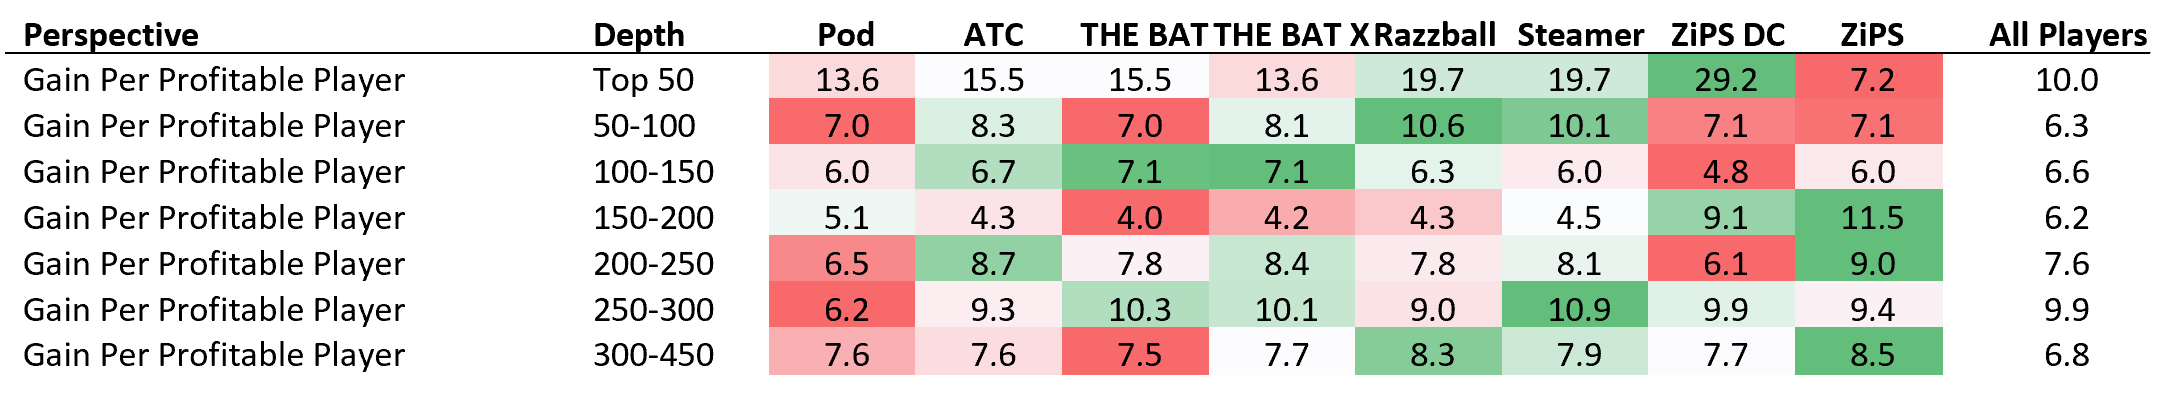
First of all, it is worth noting how the “All Players” column relates to the majority of projections. For the players in the top 100, virtually every projection outplayed the market. You would have been foolish in 2022 (as in almost every year) not to see where projections lie above ADP. In the mid ranges, some projections beat the market, and some do not. In the 300+ range, projections once again exhibit higher gains.
The way that I interpret this is to trust projections at the top and to seek out some diamonds in the rough straight from projections in the endgame. Spend your research time for fantasy drafts on players in the middle. Overall, you are still far better off using projections rather than trusting the drafting market blindly.
Back to the analysis – what jumps out to me here is ZiPS! Finally, we see some green on the board! For players after ADP 150, ZiPS produced the best gain results per player. The 150-200 range was especially terrific for ZiPS with an $11.5 gain per profitable player. That is huge! ZiPS also outright won the 200-250 range as well as the post 300 spots. ZiPS was poor below player 150 with figures underneath the “All Players” mark.
Looking back at the cumulative figures, I would give the nod to Razzball and Steamer as the winners of this category for their overall excellence up and down the player pool.
Onto losses …

For the unprofitable players, as always, an important adjustment has been made to the figures. All 2022 final values have been capped at -$5. That is, we will not let a player’s obtained value in 2022 fall below the threshold of -$5. A player who was injured all season, or who was clearly droppable, should not be penalized with an overly negative final valuation, which would skew results. I have previously written about the concept of capped values more in depth here.
Using visual inspection, Razzball and ATC are the winners for being best at avoiding large unprofitable players. ATC purchased the least amount of dollars of loss, and was on par with Razzball for the full player pool. Razzball performed slightly better than ATC within the top 50 players.
Pod projections performed poorly at the top, but then quickly turned it around at the bottom. The 100-150 and over 300 ranges were superb for Mike’s projections. ZiPS DC was fairly decent after ADP 100. ZiPS, however, was not.
Onto total profitability …
Now comes the part where we put it all together, as we look at the total profitability by projection system. All of the dollars gained are added up, and all of the dollars lost are subtracted out. It is the total summary of system profitability. These will be the most important charts of this analysis.
But before we look at the individual projections, let’s first check in once again to see how profitability on the whole has fared over the past few seasons.

For comparison, I’ll also include here what the average projection has done over the past few seasons:

Once again, we should almost completely ignore the 2020 short season. As we mentioned above, the overall level of profitability of 2020 isn’t comparable to other seasons. This is completely a function of sample size. A top-X drafted player is far less likely to end the season as a top-X player in a third of a season.
The “All Players” (ADP) profitability chart displays some interesting nuances. 2022 levels look quite similar to 2018 levels. Especially after player 100, the two seasons separated by four years almost match to the dime. The top 50 player range seems to have been progressing to be more profitable as the years have gone on, whereas the lower valued players seem to be losing a tick of profitability.
As far as the “Average Projections” go, once again – and especially as you go down the player pool – you are far better off using projections than trusting the market. Projection figures outpace pure ADP profitability at every player depth and in every season.
What I found to be very interesting for this year – is that the level of profitability in using projections converged in the middle depths. The top 150 cumulative figure of -2.1 is similar to the -2.2 of the top 200 which is similar to the -2.0 figure for the top 250. The top 100 and top 300 results of -1.6 and -1.4 are also fairly close. Essentially, projections on the whole were just as profitable above as they were down below. We have never seen this before.
The short takeaway here is that projections are getting better … and have improved quickly over a short amount of time. The market, however, is back to where it was five years ago.
How did that happen?
We know that projections have greatly influenced and dare I say “moved” the market over the past few seasons. There is a plethora of excellent fantasy baseball analysis and podcasts available to the public these days. When I walk into an NFBC draft / auction – I see more and more participants with complicated excel spreadsheets that center around projections.
So, the market is becoming smarter … and making it harder to extract profit from individual players. And since all members of the market are becoming smarter at about the same rate … absent a disruptor to the baseball environment, the profitability levels will simply continue to stay approximately where they are year to year. That may be why we are roughly back to the same 2018 market profitability. The years 2020 and 2021 were vastly different – 2020 being a short season, and 2021 having the imperfect 2020 information. The 2019 season was largely impacted by the juiced ball. But in 2022, the baseball environment perhaps returned to a more stable, or rather, more predictable environment.
There is one other large takeaway that I see here. If projection system profitability has vastly improved in relation to the market – it means that when we see a projection for a player that greatly differs from the market – it is far more likely that the divergence is meaningful. ATC of course, is an amalgamation of other underlying projection systems. If we see an ATC player projection that is far away (up or down) from its corresponding market value – it should be a strong signal for us to either BUY or PASS.
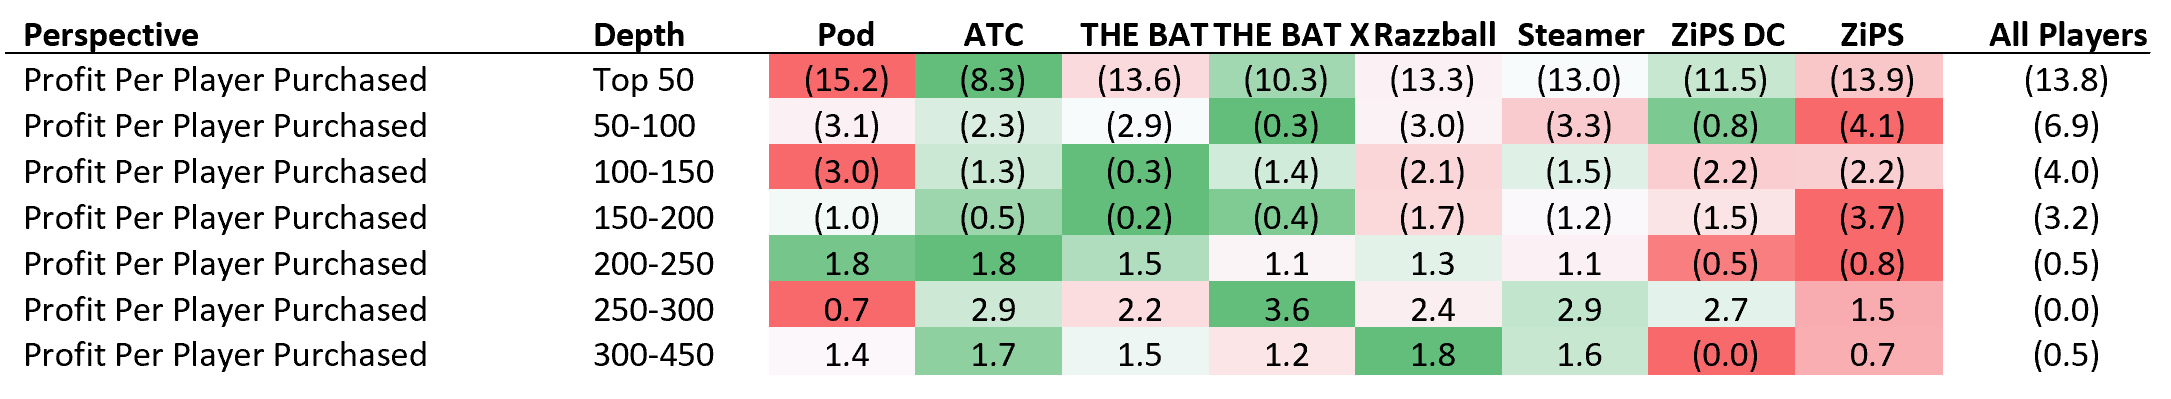
Now let’s dive into 2022’s profitability by projection system:


The only two systems in 2022 to turn a profit on the full player pool were ATC and THE BAT. In most years, we typically get just one or two systems which are profitable in the overall. Razzball and Steamer were close, finishing at 20 or 30 cents underwater.
At the very top, Razzball was king. Razzball made $5.7 on the average player that it purchased in the top 50 and another $1.7 for players that it bought in the 50-100 range ($2.8 cumulative for the top 100).
In the mid ranges (ADP 100 to 250), THE BAT dominated with a profit of -0.6 per player purchased. An interesting note – no projection system was profitable in any of the incremental ranges between ADP 100 and 250. Not a single one this year.
Steamer was the best projection system after player 300 – earning an average $1.6 profit. ATC was second for the lower depths with $1.3 of average earnings.
ZiPS was clearly the worst of the bunch, followed by ZiPS DC. With the sea of red above, it seemed to be a rather poor showing for the two models.
Overall, I would give the edge to ATC as the most effective projection set of 2022. ATC was one of the top projections in terms of profitability and hit rate at almost every single point on the curve. ATC seemed to provide users with the best chances at profitability, plus the smallest realized losses at any player depth.
Breaking up results into three parts of the curve – Razzball was easily the winner early on, THE BAT in the middle, and ATC at the bottom.
Multi-Year Results
Now let’s take a look at the multi-year profitability results.
Please note that a few of the projection systems were not analyzed for all five years. For those, the averages are only comprised of a limited number of seasons.
ZiPS DC was a new addition last year; the results below only contain 2021-2022 data. THE BAT X was introduced in 2020, and thus is merely a three-year average. Razzball only contains data from 2019-2022. The other projections have a full five years of data points.
Here is the cumulative chart by player depth:

Here is the incremental chart by player depth:
Over the past five years, we can visually inspect that ATC and THE BAT X has accumulated the most projected profit on a per player purchased basis. The two systems look fairly similar up and down the curve, with ATC having the longest historical track record.
THE BAT has also performed well to date, and in some ADP ranges was in fact the best projection!
Razzball over time has been mediocre for most of the player curve, but has been the most profitable of all projections after player 300. Pod’s manual projections have been behind most of the automated projections other than in the 200-250 range.
Steamer has been more volatile than some of the other systems. In some years it has been one of the best systems, and in some it has been towards the back half. ATC on the other hand, has been the most consistent and reliable projection set year to year – typically in the top two projections.
The jury is still out on ZiPS DC with only two years’ worth of analysis. I am looking forward to seeing how they will perform in 2023. ZiPS itself though, clearly should not be used for fantasy purposes without modification.
Finally, note that each projection system (at almost every level) has beaten the “All Players” perspective over time. Again – using projection systems is clearly the way to draft, as opposed to simply going by ADP/AAV alone.
Assorted Notes & Method Limitations
- ZiPS and ZiPS DC do not project saves. For the ZiPS & ZiPS DC projections, I simply used the Steamer saves.
- As mentioned in the past, playing time estimates are vitally important to a projection system, and are directly factored into this method. Systems which have poor playing time figures, but good rate stats per playing time are penalized in this analysis; it is the raw counting stats which are used to evaluate player values.
- THE BAT and THE BAT X made a modification this past season in that they now incorporate ATC playing time. Previously, they had been using the FanGraphs Depth Charts figures. ATC now differs from Derek Carty’s projections by rates alone.
- This will be the last year that I will evaluate the pure ZiPS projections. Clearly, for fantasy purposes – one should be using ZiPS DC over ZiPS.
- THE BAT performed better (on an effective basis) than THE BAT X for 2022. THE BAT X missed out on purchasing profitable players like Pete Alonso, Austin Riley, Nolan Arenado and Marcus Semien – whereas THE BAT purchased them. THE BAT X also purchased a few unprofitable players like Giancarlo Stanton, Josh Donaldson and Jonathan India, whereas THE BAT did not.
- Despite the 2022 results, use THE BAT X over THE BAT on the whole. The analysis clearly shows that THE BAT X has been more profitable in the long term than its original sister projection. Remember, THE BAT X did perform very well in 2022 – they were just a shade behind THE BAT in terms of effectiveness this particular season.
- This methodology only looks at the final player values vs. the projected player values. If a system would have instead projected Aaron Judge for 60 stolen bases and 25 homeruns … with the same initial projected dollar value … this analysis would still appear to have the very same results. Aaron Judge would have been accretive to fantasy baseball teams but for very different reasons, which is not addressed in this methodology.
- In this analysis, the categorization of a “Profitable Player” vs. an “Unprofitable Player” is defined by whether the final accumulated roto value exceeded the initial draft price. However, if a player purchased for $35 returned $34 of value, I would hardly call that a failure. Not only should there be a market pricing curve (as I already have), but there should also be a success curve. A $5 loss on a $40 player should be categorized as a win, whereas a $1 gain on a $2 player could be construed as a loss. I have not considered this yet, however, this is something that I might look at in a future revision of this methodology.
- Suppose that you follow a certain projection system. For Player A – it (its strike price) exceeds the market value by a wide margin, whereas for Player B it exceeds the market value by a small margin. If you draft many fantasy leagues in real life, you are more likely to have Player A on your roster than Player B. However, this analysis considers the likelihood of having either player to be identical. This is a limitation to this method. In a further study, I might experiment with additionally assigning a weight/factor to each player’s purchase ability by size of value to market spread.
Once again, I still hope that you find this game theory method of evaluating projection systems to be different, yet insightful. No one method of projection comparison is perfect and without limitations. There are other more statistically based methods that are certainly more than valid. In choosing the projection system(s) to incorporate into your fantasy preparation, this article should be one additional point of reference.
I will reiterate that the test of effectiveness is a better measure of success than the test of accuracy. Whether you thought that Apple stock was worth $50 or $100 at a point in time, had you purchased Apple shares for $25 – you would have indeed made lots of money. I am wide open to suggested intelligent modifications of my methodology here, but I am convinced of the underlying principle of effectiveness and profitability.
Wishing everyone a happy and healthy new year!
Please comment below if you have any thoughts on either my method or to the conclusions drawn.