2019 Projection Systems Comparison – A Game Theory Approach

Introduction
Last year, I introduced a game theory approach for comparing baseball projection systems. Today, I have once again applied the same methodology in order to evaluate which set of baseball projections excelled in 2019.
Most others who venture in such a comparative exercise make use of some type of statistical analysis. They calculate least square errors, perform a chi-squared test, or perhaps do hypothesis testing. I won’t be engaging in any of these capable methods.
Instead, I will look to determine the profitability potential of each projection system by simulating what would have happened in a fantasy auction draft. Instead, I’ll play a game.
What do I mean by this?
First, think about what happens in a fantasy baseball draft auction.
Suppose that Rudy Gamble of Razzball (or anyone who exclusively uses the Razzball projections) walks into a rotisserie auction league prior to the 2019 baseball season. Let’s say that Rudy decides to participate in an NFBC auction league. Mr. Gamble would take his projections and run them through a valuation method to obtain auction prices. He would generate a list that looked something like this …
Razzball Projected Values: Chris Sale 49, Mike Trout 45, Jacob deGrom 44, Max Scherzer 44. Mookie Betts 42, J.D. Martinez 37, Giancarlo Stanton 36, Justin Verlander 35, … , Brandon Lowe 1, Josh Reddick 1, Mark Melancon 1, etc.
In addition to the raw projected values generated by the Razzball system, Rudy would then establish a price point that he is willing to pay for each player. There might be a premium that he will pay for the top ones, and a discount that he expects to save on lower cost players. He may be willing to bid up to $46 on Jacob deGrom (valued at $44), but would only pay $1 for a $4 Jason Kipnis, etc.
Players would now fall into two simple categories:
- Players that are too expensive to buy. [Auction cost > Price Point]
- Players that can be purchased. [Price Point >= Auction Cost]
#1 is easy to deal with – Rudy won’t purchase them. If the cost to buy a particular player during the auction exceeds what Rudy is willing to pay, then Rudy will simply pass on the player and will cease to bid. Typically, some 65-80% of all auctioned players will fall under this category.
For #2 – We can break this down a little further:
- Players that Rudy will purchase [exactly 1 out of 15, or 6.7% of all auctioned players].
- Players that Rudy will not purchase [somewhere between 13-28% of all auctioned players].
Rudy cannot draft/buy all players that fall under his acceptable price point. He only has room for 23 players on his roster. Hopefully, and if Gamble drafts successfully, he will end up as close as he can to the 23 players that will earn him the largest profits for his team in the aggregate.
One other key point to note – There will be a number of players in the pool who will have a similar auction price & price point. If Rudy did his valuations correctly, he should be indifferent/apathetic to choosing any specific player – all things being equal.
Measuring Success
Now that we have set the stage at the 2019 NFBC auction, let’s continue with measuring the success of Rudy’s Razzball system. I introduced this concept last year, but it is worth going through once again.
Let’s say that Dan Szymborski (or someone exclusively using the ZiPS projections) is one of the other teams competing in this auction against Mr. Gamble. It is late in the auction, and both Dan & Rudy need an outfielder.
Let’s look at the $2-3 outfielders who are still available to be purchased in the auction:
| Player | Razzball | ZiPS | Auction Value | 2019 Earnings | Profit |
|---|---|---|---|---|---|
| Kevin Pillar | 9 | 2 | 3 | 16 | 13 |
| Trey Mancini | 13 | 9 | 3 | 25 | 22 |
| Kole Calhoun | 7 | 1 | 2 | 12 | 10 |
| Jorge Soler | 6 | 1 | 2 | 27 | 25 |
| Odubel Herrera | 7 | 10 | 2 | -16 | -18 |
For 2019, Trey Mancini and Jorge Soler turned out to be the most accretive players among this group of outfielders. A team purchasing either would have amassed a $22+ profit. However, if a team instead had purchased Odubel Herrera, they would have realized an $18 loss.
Question: Which fantasy team is in the best position here – Rudy’s or Dan’s?
The answer is Rudy’s Team.
| Razzball | ZiPS | |
|---|---|---|
| # Players to Buy | 5 | 2 |
| # Profitable Players | 4 | 1 |
| # Unprofitable Players | 1 | 1 |
| Total Gains | 70 | 22 |
| Total Losses | -18 | -18 |
| Total Profit | 52 | 4 |
| % Profitable | 80% | 50% |
| % Unprofitable | 20% | 50% |
| Avg Gain Per Profitable Player | 17.5 | 22 |
| Avg Loss Per Unprofitable Player | -18 | -18 |
| Average Profit Per Player | 10.4 | 2.0 |
All five of Rudy’s players are similarly priced. He will end up buying one of the five players, likely randomly. If he happens to buy any of Pillar/Mancini/Calhoun/Soler, he will profit. If he happens to buy Herrera, he will suffer a loss. On average, he stands to make a $10.4 profit.
Dan’s random player on the other hand, could only be Mancini or Herrera. Since his valuation of the other three are below the Auction Value (the cost to buy him in the auction is more than his value for the player), Dan’s projections will limit him from purchasing a number of players who turned out well in 2019. On average, Dan stands to only make a $2.0 profit.
Looking only at these five outfielders, anyone employing the Razzball projections instead of ZiPS would have had a better chance to pick a profitable player and would have earned more expected profit. For this limited example, one would rather have been using Rudy’s projections than Dan’s.
The Projection Systems
We will now extend the above process, for all auctioned players during the past season. Below are the projection systems that I have analyzed for 2019:
| Projection System | Creator |
|---|---|
| Pod | Mike Podhorzer |
| ATC | Ariel Cohen |
| THE BAT | Derek Carty |
| Razzball | Rudy Gamble |
| Steamer | Jared Cross |
| ZiPS | Dan Szymborski |
For 2019, I will be once again be comparing the ATC, THE BAT, Steamer and ZiPS projection systems which were available earlier this year on FanGraphs. Just as last year, I will also include Mike Podhorzer’s Pod projections, which he has once again graciously provided to me.
New for this year is Rudy Gamble’s Razzball projections. Prior to the season, he had asked me to include them in this year’s festivities.
Methodology
The game theory methodology of comparison used in this article is almost identical last year’s. For completeness, I will once again list the details of the procedure.
1) Start with the raw projections data (AB, H, HR, IP, K, etc.). For this analysis, I have assembled each projection system’s stats as of about March 27, 2019.
2) Produce a projected value for each player, by system. For this valuation, I use my own auction calculator, which follows a Z-Score methodology (similar to the FanGraphs auction calculator). I assume NFBC standard settings (15 teams, mixed AL/NL, $260 budget and positions – 9 P, 2 C, 1B, 2B, 3B, SS, CI, MI, 5 OF, U). I also assume that players are eligible only at their original 2019 positions + any positions that they were expected to gain in the first 2 weeks of the season.
3) Adjust the projected player values to obtain a Price Point for each player. For this, I have assumed the following:
| Projected Price | Price Point |
|---|---|
| < $1 | Do Not Buy |
| $1 to $5 | $1 |
| $6 to $10 | $3 Discount |
| $11 to $15 | $2 Discount |
| $16 to $20 | $1 Discount |
| $21 to $30 | At Cost |
| $31 to $40 | $1 Premium |
| > $40 | $2 Premium |
For example, if Steamer projects a player for $17 – I assume that the maximum that it would pay for the player is $16. If it projected a player for $41 – I assume that it would pay up to $43. Any player below replacement will not be purchased in this exercise.
4) Obtain an Auction Price. We will use an average auction value (AAV) for each player. For this, I am using the actual NFBC AAVs for all auctions between March 15, 2019 and March 25, 2019.
For those players who weren’t drafted or who were only drafted as a reserve, we will assume that they will not be bought in this exercise. Even though ZiPS projected Jed Lowrie for $4, and ATC projected Jason Kipnis for $4, we won’t include either of these players, as they were undrafted.
5) Compute the 2019 full season player values. This represents what a player was worth in 2019. It is computed using the same methodology as above in #2.
Note that for all of the above, I have let the Z-Score method determine the inherent Hitter/Pitcher split of the total auction dollars. This will differ from the NFBC AAVs, which is typically pitcher heavy (and was 63/37 this past year).
6) Players were then “purchased” for a system if their Price Point was higher than the player’s AAV.
Terminology – We will identify a player as “purchased” as long as they appeared to be a bargain for the given system.
I then tracked the number of players purchased who were profitable, the number of players purchased who were unprofitable, and their respective gains and losses.
Results
First, let’s look at the number of players that each system would “buy.” To get a sense of where the projection systems purchase their players – displayed are the number of players that would be bought by each system, for the top N cumulative players, ranked by AAV.

Just as last season, ZiPS buys more top 100 players than any other system. ATC buys more lower end players. THE BAT and Pod focused on middle-valued players. In the end, each system gave the green light to purchase roughly the same number of players (approximately 26% of the total player pool), with ZiPS slightly on the lighter side.
Onto profitability …
In the below:
GREEN colored figures represent the more successful projection results. RED colored figures represent less successful results. The “All players” column displays the figure for purchasing every player.
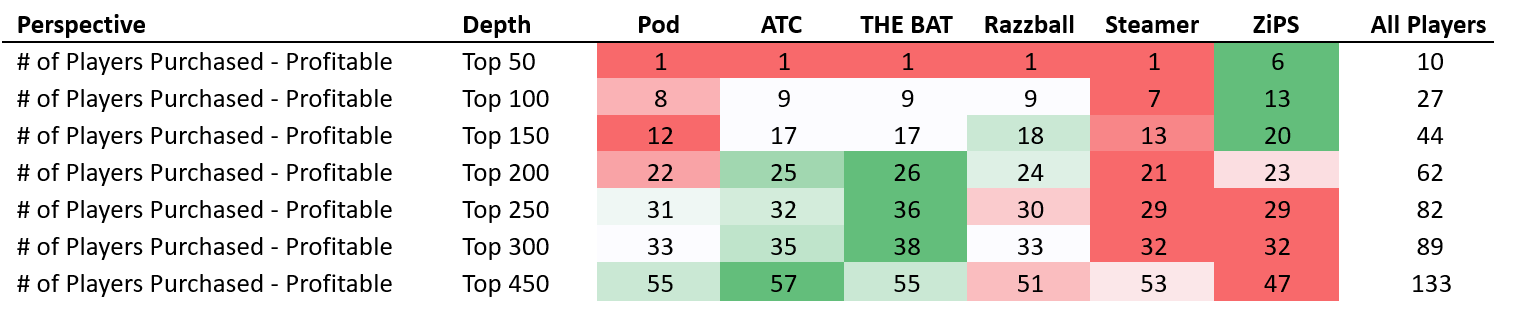
Out of the most expensive 50 players of the auction, only 10 turned a profit. This is not untypical and happens to be the identical figure (10) from last season. Profitable players inside the top 50 included Ronald Acuna, Christian Yelich, Gerrit Cole, Justin Verlander, Freddie Freeman and Juan Soto.
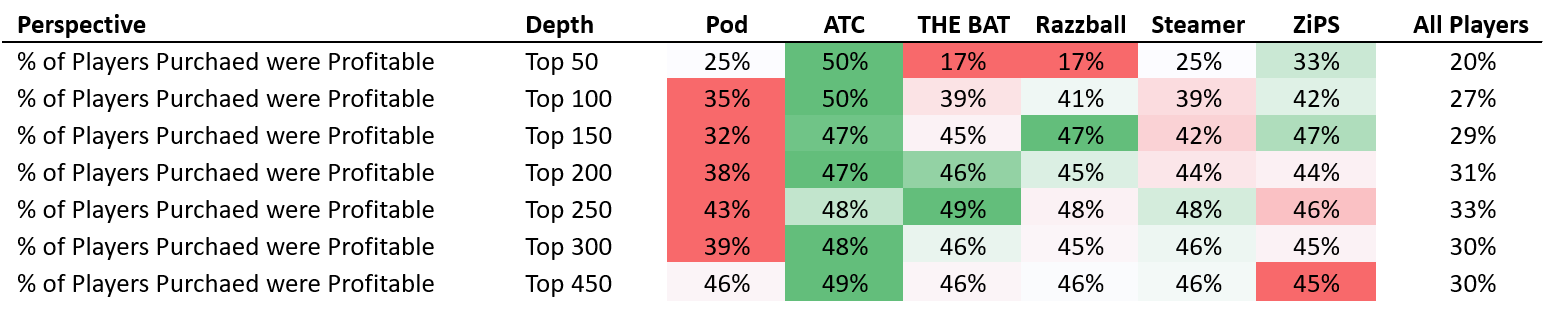
Of the top 100 players, ZiPS identified 13 of the total 27 players who were profitable, while Steamer only identified 7. Both ZiPS and Steamer greatly improved from last year in terms of the frequency of their hits. Last year, the ZiPS success rate in the top 200 was only 24%, rising to 44% this season. Similarly, Steamer climbed from 32% last season to 44% at that same player pool depth.
In total, ATC was able to identify 57 of the 133 profitable players – the most of any system. Its success rate was an excellent 49%, which was the highest. Pod and THE BAT tied for 2nd place for the total player pool, however, Pod was the least successful system for the players ranked 50 to 300.
Looking at the sea of green in the above, ATC came out on top for success rates.


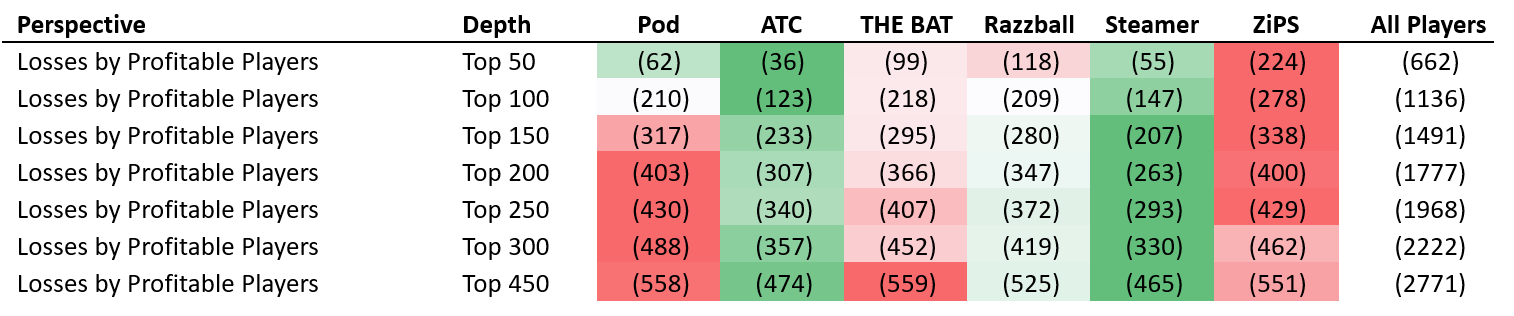
Now let’s look at players purchased for a loss. We expect most of the top players to be unprofitable. For example, the most expensive 100 players turned a loss 73% of the time.
Pod had the most trouble of all systems in the top 100. 14 out of their 23 players in this range were purchased at a loss – a 65% failure rate. However, Pod had greatly improved over 2018; last year’s figure was 82%. In fact, all projection systems performed better year over year within the top 100 players.
ATC limited the unprofitable players better than any system. THE BAT best avoided traps in the middle of the field, and ZiPS did a nice job at the top of the draft.
Now onto the magnitude of player acquisition …
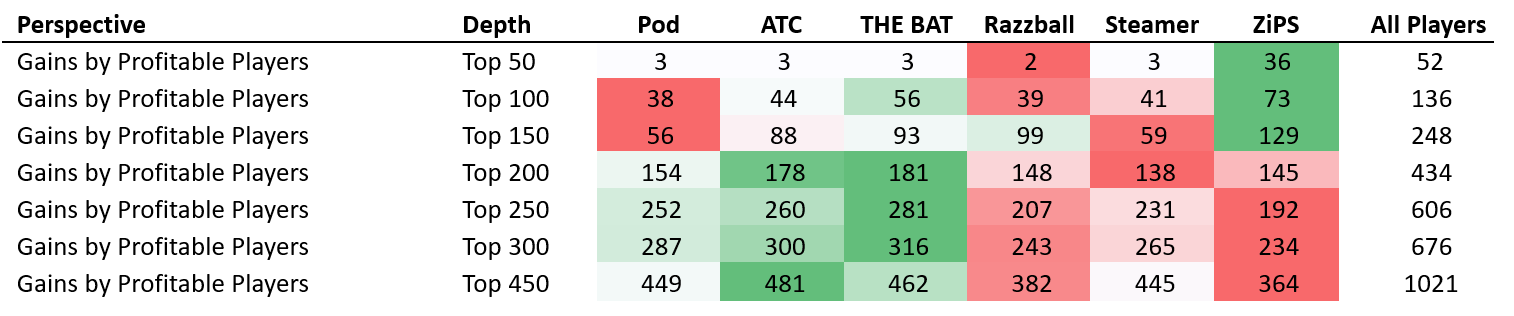
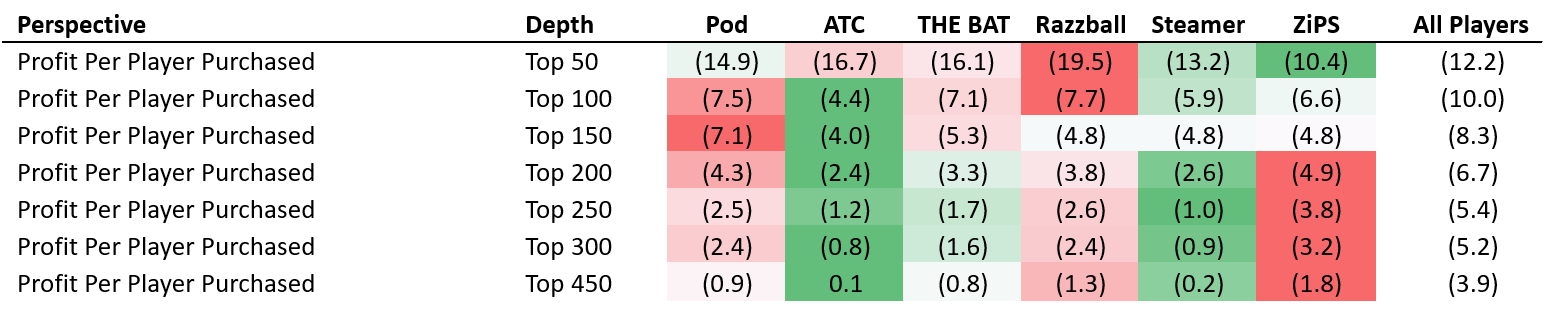
Previously, we only looked at the sheer quantity of players purchased; but what is also important is the value gained by these players. Buying 5 players who earn $1 of profit, is not as helpful as buying 1 player who earns $25 of profit, etc.
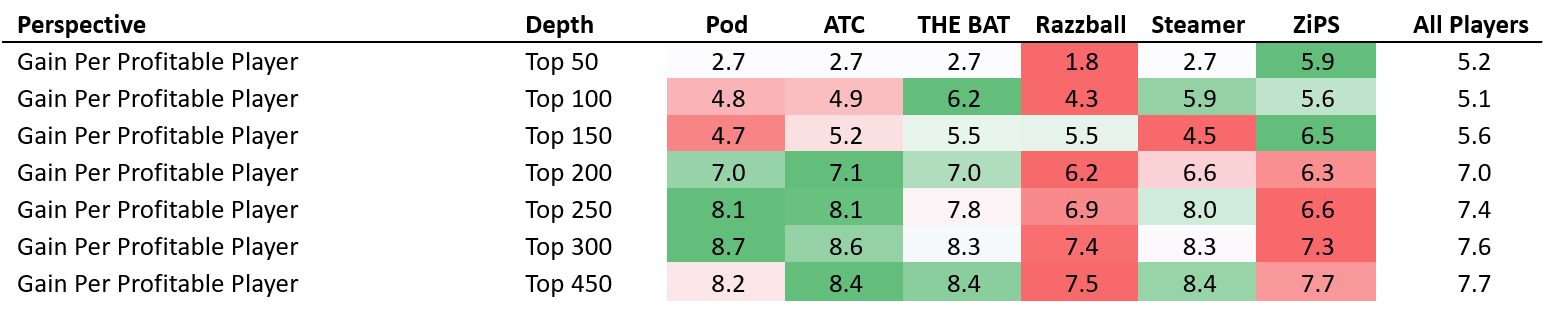
What first jumped out to me in comparison to last season, is that profitability is down, especially at the top of the draft. Below is a year over year comparison:

The frequency of successes year over year improved, but the dollars of profit earned per player has deteriorated. It is difficult to tell whether projections were generally less successful this year, or if NFBC players (and hence, the NFBC AAV) have improved.
Razzball was the worst performer of any system overall in profit per success, except for the 100-150 range, in which it outpaced the rest of the field. There really is no winner in this category; the different projection systems performed better at different parts of the curve. ZiPS and THE BAT were excellent at the top, but ATC and Pod were superior in the later draft rounds.
Onto losses …
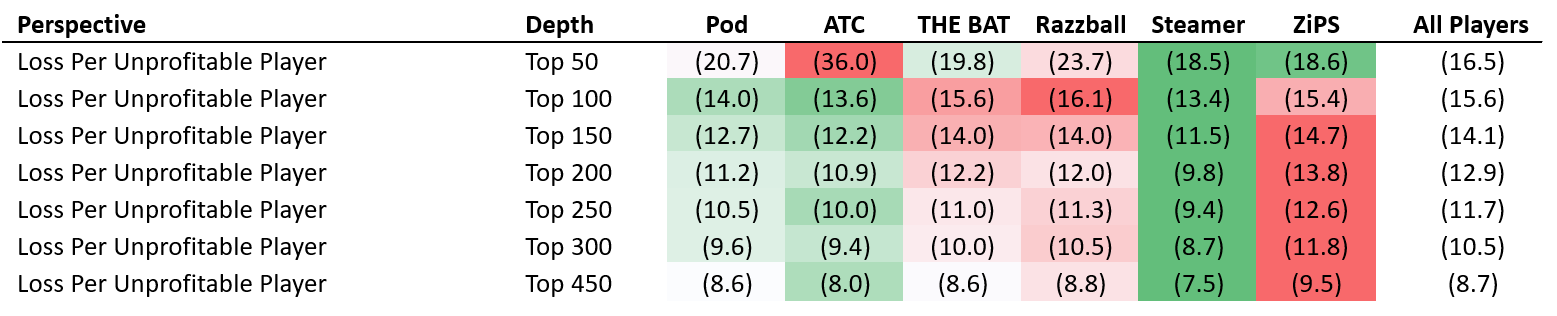
For the unprofitable players, one important adjustment has been made to the figures. All 2019 final values have been capped at -$5. That is, we will not let a player’s obtained value in 2019 fall below the threshold of -$5. A player who was injured all season, or who was clearly droppable, should not be penalized with an overly negative final valuation, which would skew results. I have previously written about the concept of capped values more in depth here.
Focus your attention to the average losses per player, rather than to the total. For the top 50, ZiPS produced more dollars of loss than any other projection system. But since they purchased the most number of players – on average, the losses would have only cost you $18.6 per player, which was close to the best in the field (Steamer at $18.5).
ATC appears was awful in the first 50 players, losing fantasy owners an average of $36 per player. However, that came from just a single purchase of Chris Sale, which is too small a sample size. Last year, the same phenomenon also occurred for ATC (one large single player loss). If we move on to the players from 50-100, ATC outclassed all other projections.
Looking up and down the entire player pool, Steamer is the clear winner. For the players that Steamer suggested to buy that were unprofitable – they were the system that best prevented large profit losses to fantasy owners. ATC and Pod were the next best, with ZiPS coming in last.
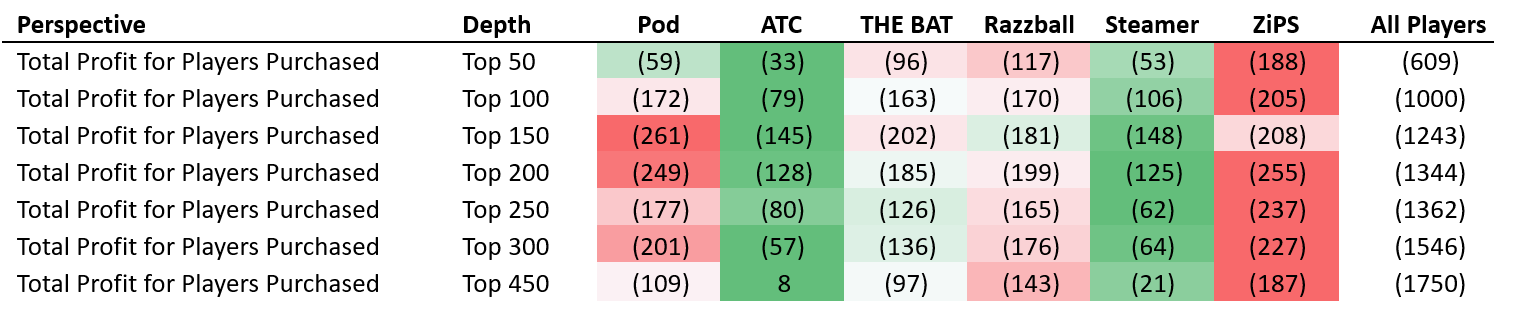
Here we look at total profit for the projection systems. All of the dollars gained are added up, and all of the dollars lost are subtracted out. It is the total summary of system profitability.
Once again, we see that profitability on the whole is down year over year.

Last year, ATC turned a profit from players 100 and on and THE BAT was profitable for players 200+. This year, the only positive valued figure on the entire chart comes from the ATC Top 450.
Looking up and down the player pool, there is no clear winner – although ATC and Steamer were both colored with a sea of green. Those were the two best projection models in 2019.
- ZiPS was the best in the Top 50
- ATC was the best from 50-100
- Steamer the best from 100-250
- ATC tops all systems again from 250-450.
On average, ATC earned a profit of $0.1 per player for fantasy auctions. All other projections lost money for owners, ranging from -$0.2 of Steamer to -$1.8 of ZiPS.
Two-Year Results
Finally, let’s take a look at results over the past two seasons on a profit per player purchased basis. Doing so will smooth out projection system results over a longer period of time (2018-2019). For Razzball, a new addition to this analysis, figures will be from 2019 only.
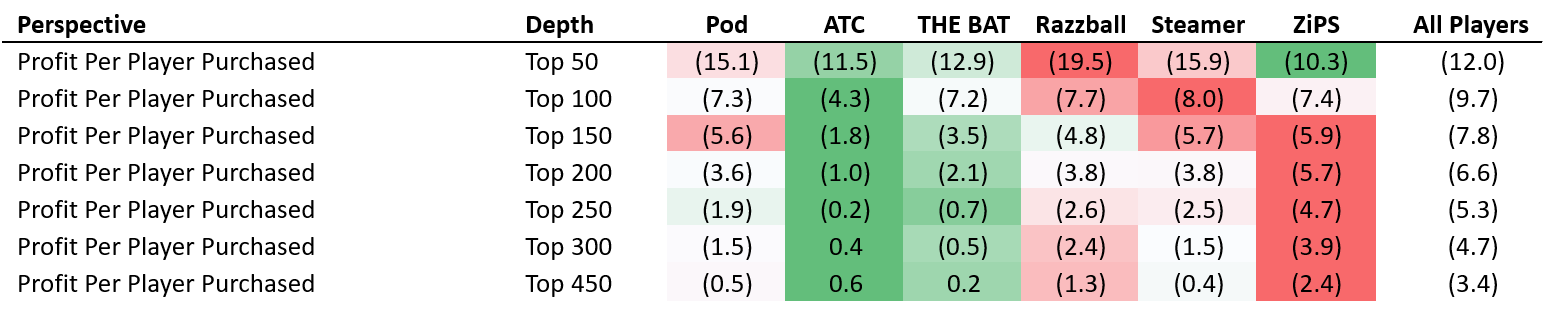
Over the past two seasons, we can visually inspect that ATC has offered the most projected profit on a per player purchased basis. In fact, at most levels, ATC is twice as good as the next best projection model.
THE BAT appears to have the 2nd best two-year returns on investment. ZiPS does well in the top 50 players but is the worst system for the mid to low-valued players. Pod and Steamer appear quite similar to each other up and down the curve and fall in the middle of the pack.
The most crucial range for a projection system to find bargain players is arguably the 100-300 player range. ATC has been far ahead of the pack in that area on a two-year basis.
Assorted Notes & Method Limitations
- ZiPS does not project saves. For the ZiPS projections, I simply used the Steamer saves.
- As mentioned last year, playing time estimates are vitally important to a projection system, and are directly factored into this method. Systems which have poor playing time figures, but good rate stats per playing time are penalized in this analysis; it is the raw counting stats which are used to evaluate player values.
- ZiPS valued Chris Sale at $52. A reasonable fantasy player would likely not spend $52 on his top pitcher. A user of the ZiPS system might need to adjust or smooth the pricing curve to more closely reflect the auction market curve.
- The previous bullet combined with the fact that in the top 50 ZiPS purchased three times as many players as any other system – suggests that the prices generated by unadjusted ZiPS is very different from what owners pay at fantasy baseball auctions. Either ZiPS data needs to be adjusted, or the discount curve used to make buying decisions needs to be heavily altered for them.
- On the other hand (of the above bullet), all other projection systems are on the light side of purchasing players in the top 50. I kept the price point curve somewhat consistent to last year, but I might change it in a later study (within the top 50 players) to generate a level of purchase closer to what happens at live auctions. Outside of the top 50 players, the price point curve works well.
- The main difference in the composition of ATC from 2018 to 2019 was the introduction of THE BAT into its underlying projection system mix. Usually, I wait until I have a bit more historical data in order to introduce a new projection system into the mix. But with a very successful outcome of Derek Carty’s system in 2018, I added THE BAT into ATC with only one year of results. In 2020, ATC will have a more robust weight of THE BAT with now an extra year of THE BAT historical data.
- THE BAT, ATC and Pod performed worse in 2019 than they did in 2018 as seen through the profit per player chart. Both Steamer and ZiPS had improved.
- Over the two-year span, ATC has been the most stable (least variation in how it performed) and was the most successful system as per the two-year chart in the above section. One intention of how ATC is designed is to smooth out results.
Once again, I hope that you all have found this game theory method of evaluating projection systems to be something different, yet insightful. Please comment below if you have any thoughts on either its method or to the conclusions drawn.
Ariel is the 2019 FSWA Baseball Writer of the Year. Ariel is also the winner of the 2020 FSWA Baseball Article of the Year award. He is the creator of the ATC (Average Total Cost) Projection System. Ariel was ranked by FantasyPros as the #1 fantasy baseball expert in 2019. His ATC Projections were ranked as the #1 most accurate projection system over the past three years (2019-2021). Ariel also writes for CBS Sports, SportsLine, RotoBaller, and is the host of the Beat the Shift Podcast (@Beat_Shift_Pod). Ariel is a member of the inaugural Tout Wars Draft & Hold league, a member of the inaugural Mixed LABR Auction league and plays high stakes contests in the NFBC. Ariel is the 2020 Tout Wars Head to Head League Champion. Ariel Cohen is a fellow of the Casualty Actuarial Society (CAS) and the Society of Actuaries (SOA). He is a Vice President of Risk Management for a large international insurance and reinsurance company. Follow Ariel on Twitter at @ATCNY.
Will this information lead you to make any changes to how ATC evaluates elite talent?
Great question there, and thank you for reading the article.
I don’t think so for a number of reasons. ATC is designed to minimize bias. ATC does a great job of dealing with players found at the middle and lower end of drafts – where ADP/AAV has more variance. In the 12th round, ATC is able to find some diamonds in the rough, and minimizes selecting poor players because fantasy players don’t have uniform agreement. I wouldn’t want to change that.
Players at the top will always be muted by ATC; you’ll never get an out-sized elite player projection in the first 2-3 rounds. But that’s okay.
Instead of changing the ATC projections, the more prudent course of action is either to make changes in the valuation process, or better yet in the price point curve. The decision making at the top might need an adjustment to allow a few more acceptable players (i.e. Price = Value + $3, etc.).
And again, ATC has an excellent success vs. bust rate even at the top – so I wouldn’t want to touch it too much. Rather, I might change strategy and team construct around it to jive even more with ATC, who suggests buying in the middle.