2021 Projection Systems Comparison – A Game Theory Approach

Introduction
In 2018, I introduced a game theory approach for comparing baseball projection systems. Proudly, the original article was nominated for Baseball Article of the Year by the Fantasy Sports Writers Association (FSWA). Now, just days ahead of the release of the 2022 ATC Projections, the projections comparison article is back for its fourth consecutive year!
The approach used in this article is not the standard projections comparison analysis that most others use. The standard analysis involves calculating least square errors, performing chi-squared tests, or perhaps even hypothesis testing. Some type of statistical measure is used to determine the most accurate projections.
For example, late last year – my fellow RotoGraphs colleague Jeff Zimmerman put out a series of in-depth projection comparison accuracy articles. His study centered around the root mean squared error test applied to all projection sets surveyed. The first installment of this excellent series can be found here.
My methodology does not incorporate a statistical model. Instead, it looks to determine the profitability potential of each projection system by simulating what would have happened in a fantasy auction draft. Instead, it games the projections.
For a full explanation of the game theory methodology, please refer to the past articles: 2020 2019 2018
Effectiveness over Accuracy
I do want to touch on one reason why I prefer this method over the more standard ones. It is because the projections comparison does not directly test projection accuracy, rather, it tests effectiveness. Accuracy does not always tell the full story.
Consider the following two projection systems (say ZiPS & Steamer) for Players A & B:
| Player A | Player B | |
|---|---|---|
| ZiPS Projection | $32 | $20 |
| Steamer Projection | $12 | $16 |
| Market Price / AAV | $2 | $18 |
For Player A, the projection systems are far apart, yet both models price the player far above the market. For Player B, the projection systems are close to one another. ZiPS is a few dollars over the market price, and Steamer is a few dollars below.
What is important to note is that ZiPS will have the propensity to purchase both Players A & B, while Steamer will only purchase Player A. What is even more important to understand is that the price that ZiPS will pay for Player A will be identical to the price that Steamer will pay – at $2.
The market sets the price. A projection system only decides whether or not to pay the price.
Now let’s see the result of what happened in 2021 for this fictitious example …
| Player A | Player B | Total | |
|---|---|---|---|
| 2021 Final Value | $32 | $2 | |
| ZiPS Projection | $32 | $20 | |
| Steamer Projection | $12 | $16 | |
| ZiPS Absolute Error | $0 | $18 | $18 |
| Steamer Absolute Error | $20 | $14 | $34 |
Considering the absolute value of errors (one such statistical test), ZiPS was the more accurate projection system.
ZiPS was spot on for player A, whereas Steamer was way off in its prediction. As for player B, the systems were both highly inaccurate – but close to one another. On the whole, ZiPS generated a smaller aggregate absolute error.
Without considering any market price context or the fantasy baseball game that we play – based on the above, ZiPS would have been declared the better projection system for 2021.
However, consider the following from a fantasy profit perspective:
| Player A | Player B | Total | |
|---|---|---|---|
| 2021 Final Value | $32 | $2 | $34 |
| ZiPS Spend | $2 | $18 | $20 |
| Steamer Spend | $2 | N/A | $2 |
| ZiPS Final Player Values | $32 | $2 | $34 |
| Steamer Final Player Values | $32 | N/A | $32 |
| ZiPS Net Profit | $30 | ($16) | $14 |
| Steamer Net Profit | $30 | N/A | $30 |
Despite ZiPS’s spot on prediction of Player A – the net profit accumulated by each projection was the same. Steamer’s projection of $12 was high above the market, and so it produced a “BUY” signal for player A. Similarly, ZiPS also produced a “BUY” signal. It didn’t matter than Steamer wasn’t all that accurate on the player evaluation – it only mattered that it was above the market. In the end, the total fantasy profit realized was the same.
However, for Player B – as Steamer produced a “PASS” signal, it avoided purchasing a value draining commodity. ZiPS succumbed to the landmine, and ceded $16 of value along the way. Despite the overall favorable statistical accuracy of ZiPS to Steamer, in practice, it produced a net profit of just $14 to Steamer’s $30. You were better off having Steamer’s projection in-hand, rather than having ZiPS’s figures in the above example.
This game theory comparison approach provides a method to compare the historical effectiveness of the projection systems. As someone who plays fantasy baseball with a return on investment mindset, this is truly at the heart of it all.
Now, prior to diving into the results – the next couple of sections details the technical details of how the analysis was performed.
The Projection Systems
Below are the projection systems that I have analyzed for 2021:
| Projection System | Creator |
|---|---|
| Pod | Mike Podhorzer |
| ATC | Ariel Cohen |
| THE BAT / THE BAT X | Derek Carty |
| Razzball | Rudy Gamble |
| Steamer | Jared Cross |
| ZiPS / ZiPS DC | Dan Szymborski |
The authors of the projection systems in 2021 are identical to last year’s compliment. However, this year I have added in two additional projection models.
- Dan Szymborski’s ZiPS DC model – This model essentially has the same skills rates as the standard ZiPS projections, but have been applied to the Depth Charts playing time.
- Derek Carty’s THE BAT X model – In this alternate model by Carty, many Statcast metrics (& other) are additionally incorporated. I analyzed this system separately last year, but in 2021 I will be fully evaluating the model within this article.
Once again, I will also be comparing the ATC, THE BAT, Steamer and the ZiPS projection systems, which were available on FanGraphs earlier this year. In addition, as per usual – also I include my colleague Mike Podhorzer’s Pod projections, as well as Rudy Gamble’s Razzball projections.
Methodology
The game theory methodology of comparison is identical to last year.
1) Start with the raw projections data (AB, H, HR, IP, K, etc.). For this analysis, I have assembled each projection system’s stats as of the day prior to Opening Day 2021.
2) Produce a projected value for each player, by system. For this valuation, I use my own auction calculator, which follows a Z-Score methodology (similar to the FanGraphs auction calculator). So that I can best compare projected values to “market,” I use the NFBC main event settings (15 teams, mixed AL/NL, $260 budget and positions, standard 5×5 scoring). I also assume that players were eligible only at their original 2021 positions + any positions that they were expected to gain in the first 2 weeks of the season.
3) Adjust the projected player values to obtain a Price Point for each player. For this, I have assumed the following:
| Projected Price | Price Point |
|---|---|
| < $1 | Do Not Buy |
| $1 to $4 | $1 |
| $5 to $9 | $3 Discount |
| $10 to $14 | $2 Discount |
| $15 to $19 | $1 Discount |
| $20 to $27 | At Cost |
| $28 to $35 | $1 Premium |
| $36 to $40 | $2 Premium |
| > $40 | $3 Premium |
For example, if Steamer projects a player for $17 – I assume that the maximum that it would pay for the player is $16. If it projected a player for $42 – I assume that it would pay up to $45. Any player below replacement will not be purchased in this exercise.
This attempts to simulate what happens in real life fantasy draft/auctions. Managers typically purchase players at the top for a premium. In the mid-rounds, players are purchased roughly at their projected cost. Towards the endgame, players are only purchased for discounts.
4) Obtain an Auction Price. I use an average auction value (AAV) for each player. For this, I am using actual NFBC AAVs for auctions in the month of March.
5) Compute the rotisserie player values for this season. This will represent what a player was worth in 2021. It is computed using the same methodology as above in #2.
Note that for all of the above, I have let the Z-Score method determine the inherent Hitter/Pitcher split of the total auction dollars. This will differ from the NFBC AAVs, which is typically pitcher heavy (and was about 62/38 this past year).
6) Players were then “purchased” for a system if their Price Point was higher than the player’s AAV.
Terminology – I identify a player as “purchased” as long as they appear to be a bargain for the given system.
I then tracked the number of players purchased who were profitable, the number of players purchased who were unprofitable, and their respective gains and losses.
Results
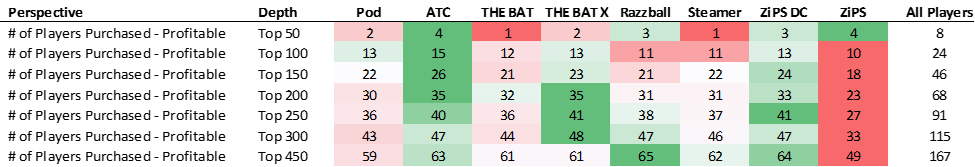
First, let’s look at the number of players that each system would “buy.” To get a sense of where the projection systems purchase their players – displayed are the number of players that would be bought by each system, for the top N cumulative players, ranked by AAV.

The first observation to make is that virtually all projection systems purchased a larger number of players at the top than usual. In 2020, we typically saw only 4-6 indicated player purchases per system in the top 50, and now we see about double that figure.
Most striking was ATC, which usually purchases the fewest number of players (at each tier) inside the top 200. In 2021, ATC had purchased more players than any other system. My current hypothesis on why we see that – is that the market has tilted ever closer towards ATC pricing over the past year. This may arise from NFBC drafters explicitly using or incorporating ATC into their own pricing models, or even just performing their own aggregation of a few projection systems on their own. I noted a similar observation last year, where the market seemed to be moving towards the Steamer projections.
In the end, each system gave the green light to purchase approximately 30% of the total player pool, which was about the same as last year – and just a shade higher than 2019’s 26%.
Onto profitability …
In the below:
GREEN colored figures represent the more successful projection results. RED colored figures represent less successful results. The “All players” column displays the figure for purchasing every player.

Last year, due to the shortened season, hit rates were abnormally low, especially for high valued players. This year, hit rates were about on par with historical figures for high valued players, but even higher than usual for low valued players. Projections on the whole did a better job of identifying profitable players late in drafts in 2021.
Out of the most expensive 50 players of the auction, only 8 turned a profit. This is just under the typical 10 that do so (20% success rate). In 2020, due to the variance of the short season, the figure dropped to only 7 (14% success rate).
For 2021 – profitable players inside the top 50 included Vladimir Guerrero Jr., Bo Bichette, Walker Buehler and Rafael Devers.
THE BAT and Steamer only identified one single profitable player inside the top 50. ATC and ZiPS each identified 4 of the 8 profitable players of the top fifty.
For the highest priced players – in terms of success rates, ZiPS DC (33%) and ZiPS (29%) had the highest percentage of their “purchased” players returning a profit. ATC was next at 27%.
In the top 50-100 range, THE BAT X was king with a 60% success rate in that range (a 45% overall top 100 success rate). With the slew of green that can be seen above, THE BAT X was also the most successful at finding profitable players in the 100-200 range as well. ZIPS DC was not far behind them this year.
Once again, the standard ZiPS projections continued to be abysmal throughout the player pool, with an overall 37% hit rate. The 37% just about matches the “All Players” figure, which means that one would have had about the same success rate by simply randomly bidding on every player. The stark difference between ZiPS and ZiPS DC highlights the need to focus on playing time for fantasy drafts.
Unfortunately for Pod, this was a bad year for them in terms of hit rates. Pod was successful at only about 41-43% up and down the curve, lagging the other projection systems by about 5 percentage points.
In total, Razzball was able to identify 65 of the 167 profitable players – the most of any system. Its success rate was an excellent 47%, the highest of any projection system. ATC took 2nd place for the total player pool.
It is hard to give an overall winner for 2021 hit rates, but I would award it to THE BAT X. Other than the very top (which is often noisy), their only blemish had occurred in the $1-3 player level. Post player 300, their success rate was only 30% (although this is irrespective of magnitude of success).
Now let’s look at players purchased for a loss:

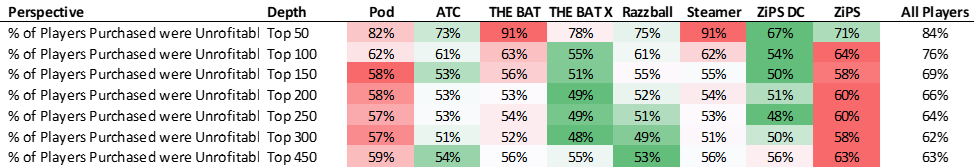
We expect most of the top players to be unprofitable. The rate table shown here is the compliment of the profitable one above (all percentages will sum to 100%). The added information here is the quantity of failures. Razzball and ATC had purchased the fewest number of failures in 2021.
If we pair the number of green boxes from both the quantity and rate charts, the best projections at avoiding traps throughout the curve were ZiPS DC, THE BAT X and Razzball. ATC was excellent at the very top of the curve, and at the very bottom.
Pod was clearly the worst this year, with more red boxes than anyone else. They hit 85 landmines throughout the player pool in total. ZiPS and ZiPS DC though, uncovered the most unprofitable players after player 300.
Now onto the magnitude of player acquisition …

For the magnitude of gains, it greatly helps to first see how profitability has changed over time (above).
To do so, one has to ignore the 2020 year. The short season resulted in an abnormally high gain rate per hit. Since the ending player values were more widely distributed – the highs were higher, and the lows were lower.
Looking back now at 2018 and 2019, we see a distinct downward sloping trend of gains per successful player. For the top 300 players for example, the figure has fallen from 8.2 in 2018 to 7.6 in 2019, and now down to 6.8 this year.
Looking at both extreme ends of the curve, it is harder now to make fantasy gains at the top of the draft (4.3 in 2021 vs. 9.2 in 2018), but easier to make gains at the very bottom (7.9 vs. 7.4). Strikingly, the 7.4 top-450 figure this year is larger than the corresponding top-300 value of 6.8. Yes, the market has clearly gotten shrewder at the top. But it has also generated wider dissenting opinions at the bottom – which in turn leaves room for more profitability for the low-valued players.


ATC was the worst performer of any system inside the top 50, whereas THE BAT X demonstrated gains of more than four times that amount. Pod was the clear winner from pick 50 to 200, and especially from picks 50-100. Steamer came on strong at the very end, and as a result, had the highest gains per profitable player for the player pool in its entirety.
With far more consistency of magnitude, I would assert that THE BAT X was the best system across the board for this category. Being highly consistent throughout the curve is quite useful in drafting.
I was surprised to see ATC perform quite poorly here. Typically, ATC had historically done enormously well in gains per profitable player, but not as such in 2021. Once again, I believe it has to do with the fact that the market is more closely aligned with ATC than ever. On a percentage basis, ATC was one of the best at picking successes, however the market somehow forced ATC to pay that extra dollar in 2021 to keep dramatic earnings more in check. This is something to monitor heading into 2022.
Both ZiPS and ZiPS DC were rather poor in this category.
Onto losses …


For the unprofitable players, as always, an important adjustment has been made to the figures. All 2021 final values have been capped at -$5. That is, we will not let a player’s obtained value in 2021 fall below the threshold of -$5. A player who was injured all season, or who was clearly droppable, should not be penalized with an overly negative final valuation, which would skew results. I have previously written about the concept of capped values more in depth here.
With the sea of green, ATC seems to be the winner this year for mitigating losses. I would award Steamer as the 2nd best projection system in this category, with ZiPS DC receiving the bronze. In fact, it was ZiPS DC’s fantastic suppression of value drain at the $1-3 level – which enabled it to have the best figures for the overall player pool, eclipsing ATC at the end.
Since for the loss category, the top of the draft should count far more than the bottom of the draft – ATC was awarded as the winner. In the top 50 players, ATC lost your team roughly $5 less than almost all other systems per player. That’s a large difference.
It is also in this category that we see the stark difference between THE BAT and THE BAT X. THE BAT was one of the worst systems in 2021 in terms of losses, whereas THE BAT X was one of the better ones. You can visually see the red juxtaposed right next to the green in the chart above for the two sister models.
Finally, after doing a fantastic job here in 2020, Razzball finished last in this category.
Onto total profitability …
Now comes the part where we put it all together, as we look at the total profitability by projection system. All of the dollars gained are added up, and all of the dollars lost are subtracted out. It is the total summary of system profitability.
Before we look at the individual projections, let’s first check in to see how profitability on the whole has fared over the past few seasons.

Once again, we should almost completely ignore the 2020 short season. The overall level of profitability of 2020 isn’t comparable to prior seasons. This is completely a function of sample size. A top-X drafted player is far less likely to end the season as a top-X player in a third of a season.
Similar to the gains chart above, we see that profitability on the whole has improved. Looking deeper, profitability is trending downwards at the top of the draft, and upwards at the bottom.
While the above chart depicts the “All Players” profitability perspective, take a look at how the average projection system fared year over year:

Other than at the very top, using projections vs. pure ADP has been extremely helpful, helping to cut down net losses almost in half for the majority of the curve. Again – ignore 2020.
Below are the total profitability charts by projection system:


No system this year turned a profit on the entire player pool. This was also the first time that ATC itself had not turned a profit on the entire player pool.
Steamer was this year’s leader by a hair for overall profitability. Steamer’s net of -$0.6 narrowly beat out ATC, THE BAT X and Razzball by just $0.1 – the closest finish since we started this process in 2018. Wow!
It is somewhat hard to directly discern the pockets of profitability from the above (being cumulative), so here is the breakdown of profitability per player purchased – by player pool range (incremental):

In terms of profitability, ATC is the clear winner at the top of the player pool (in the top 100). Most notably, the -$10.6 figure beats all other projection systems by at least $2 a player. THE BAT X takes the next 100 players, with the 150-200 range being its best.
ATC recaptures the lead for the next 100 players (200-300), especially with a $5.2 per player profit in players 250-300. That is the single largest value spot on the above board. Finally, Razzball took the prize for the very end of the draft (post 300). It is hard to crown a profitability winner this year, but to me, ATC and THE BAT X were the two at the top. Aside from a singular narrow 50-man range for each, the two were the cream of the crop elsewhere throughout the player pool.
ZiPS was clearly the worst of the bunch, followed by Pod. THE BAT had some great pockets of value later on, but that whopping -$19.6 of profit at the very top really put a damper on the system’s overall profitability. On the whole, if you followed THE BAT X over THE BAT in 2021, you would have been greatly rewarded.
Multi-Year Results
First, a word about the inclusion of the 2020 season:
An important feature of this analysis is that the currency is auction value dollars. The figures are annualized and are comparable year upon year. As for the 2020 short season – yes, the variance of its distribution was somewhat different from normal. But in the end, it was still a zero-sum game and can be compared on the same value basis with the other years.
Let’s now take a look at results over the past four seasons on a profit per player purchased basis. Doing so will smooth out projection system results over a longer period of time (2018-2021).
Note that a few of the projections had not been studied for all four years. For those projections, the averages are only of a limited number of seasons. ZiPS DC is new for this year, and its average only contains 2021 data. THE BAT X was introduced last year, and thus is merely a two-year average. Razzball only contains data from 2019-2021.
Here are the multi-year profiability per player purchased results:

Over the past four seasons, we can visually inspect that ATC and THE BAT X have offered the most projected profit on a per player purchased basis. The two systems look fairly similar up and down the curve, with ATC having a longer historical track record.
Steamer has been more volatile than some of the other systems. In some years it has been one of the best systems, and in some it has been closer to the middle.
What I find interesting is that Pod and Steamer have remarkably similar shapes of profitability, especially in the middle of the curve. That’s an amazing feat, as they are completely different types of projection systems. Pod is a fully manually projected set, while Steamer is an automated/formulaic one.
Finally, note that each projection system (at almost every level) has beaten the “All Players” perspective over time. Using projection systems is clearly the way to draft, as opposed to simply going by ADP/AAV alone.
Assorted Notes & Method Limitations
- ZiPS and ZiPS DC do not project saves. For the ZiPS & ZiPS DC projections, I simply used the Steamer saves.
- As mentioned in the past, playing time estimates are vitally important to a projection system, and are directly factored into this method. Systems which have poor playing time figures, but good rate stats per playing time are penalized in this analysis; it is the raw counting stats which are used to evaluate player values.
- The intrinsic Z-Score hitter/pitcher split of the auction dollars between the various systems was much closer together than in prior seasons. ZiPS and ZiPS DC was the heaviest towards pitchers at 62/38, while Steamer was most tilted towards hitters at 67/33.
- Use ZiPS DC over ZiPS for fantasy purposes. This is abundantly clear based on this analysis. In the future, I may drop ZiPS from this analysis all together.
- Use THE BAT X over THE BAT on the whole. The analysis clearly shows that THE BAT X has been more profitable long term than its original sister projection.
- In this analysis, the categorization of a “Profitable Player” versus an “Unprofitable Player” is defined by whether or not the final accumulated roto value exceeded the initial draft price. However, if a player purchased for $35 returned $34 of value, I would hardly call that a failure. Not only should there be a market pricing curve, but there should also be a success curve. A $5 loss on a $40 player should be categorized as a win, whereas a $1 gain on a $2 player could be construed as a loss. That is something that I might look at in a future revision of this methodology, that I have not done in the past.
- Suppose that you follow a certain projection system. For Player A – it (its strike price) exceeds the market value by a wide margin, whereas for Player B it exceeds the market value by a small margin. If you draft many fantasy leagues in real life, you are more likely to have more shares of Player A on your rosters than Player B. This is fairly intuitive. However, this analysis considers the likelihood of having either player identical. This is a limitation of this method. In a further study, I might experiment with additionally assigning a weight/factor to each player’s purchase ability by size of value to market spread.
For the fourth year in a row, I still hope that you find this game theory method of evaluating projection systems to be different, yet insightful. No one method of projection comparison is perfect and without limitations. There are other more statistically based methods that are certainly more than valid. In choosing the projection system(s) to incorporate into your fantasy preparation, this article should be one additional point of reference.
Please comment below if you have any thoughts on either my method or to the conclusions drawn.
Ariel is the 2019 FSWA Baseball Writer of the Year. Ariel is also the winner of the 2020 FSWA Baseball Article of the Year award. He is the creator of the ATC (Average Total Cost) Projection System. Ariel was ranked by FantasyPros as the #1 fantasy baseball expert in 2019. His ATC Projections were ranked as the #1 most accurate projection system over the past three years (2019-2021). Ariel also writes for CBS Sports, SportsLine, RotoBaller, and is the host of the Beat the Shift Podcast (@Beat_Shift_Pod). Ariel is a member of the inaugural Tout Wars Draft & Hold league, a member of the inaugural Mixed LABR Auction league and plays high stakes contests in the NFBC. Ariel is the 2020 Tout Wars Head to Head League Champion. Ariel Cohen is a fellow of the Casualty Actuarial Society (CAS) and the Society of Actuaries (SOA). He is a Vice President of Risk Management for a large international insurance and reinsurance company. Follow Ariel on Twitter at @ATCNY.
Wow Ariel this is a tremendous article. Thanks for your contributions.
I have a theory as to why THE BAT X seems to have so much success once you get past the top 50 players. Many of the players in this range have some warts that prevent them from being too 50 players, whether that be volatility or track record or questionable skills. Players in this range seem to yo yo and have the most turnaround year over year. I think THE BAT X does a good job at teasing out the imposters or identifying the ascent of newcomers with the merging of statcast.
Most of the top 50 players are in the top 50 because they either have particularly desirable skills (speed) or because they have a multiple seasons track record of hitting success which likely indicates a favorable statcast profile.
In particular in my keeper leagues I am selling high on all my shares of guys like Jared Walsh, Arozarena, Semien, and Gurriel, and adding players like Lindor, Pham, Kiriloff, and Kirk.
Thanks for that. Yes, Derek does a great job with the BAT X inclduing all the reasons that you described above.
What’s nice about this article is that it doesn’t just pick an overall winner – or give one stat of accuracy. Here I break it down by ADP range of players, and show which projections are good at grapping profits and which are good at mitigating losses.
I like this theory a lot. The top guys are obvious/have good profiles anyway, but the lesser guys there’s a bigger relative advantage to be had with.
I agree with this. And that’s where effectiveness over accuracy really is seen here – that THE BAT X does the best when it matters. (And THE BAT X is pretty accurate too.)