Roto Riteup: July 24, 2026
He may not be Heather’s nephew, but perhaps it’s the beginning of a new dynasty…
On the Agenda:
- Quick Hits
- Various News and Notes
- Streaming Pitchers

He may not be Heather’s nephew, but perhaps it’s the beginning of a new dynasty…
On the Agenda:

One way to find starting pitchers who have been making pitch mix changes is to see who is throwing fewer or more fastballs (four-seamers and sinkers). The table below shows the starting pitchers who have thrown fewer four-seamers and sinkers in June and July. I used a 3-percentage point dip as a cutoff.
| Player | Fastball Pitch% (July) | wOBA | Fastball Pitch% (June) | wOBA | Fastball Pitch% (May) | wOBA | AVG 4SEAM + SINKER PITCH% | 4SEAM + SINKER DIFF |
|---|---|---|---|---|---|---|---|---|
| Abbott, Andrew | 43.8 | 0.303 | 43.7 | 0.382 | 48.5 | 0.346 | 45.9 | -4.8 |
| Arrighetti, Spencer | 40.9 | 0.374 | 37.8 | 0.520 | 45.8 | 0.242 | 39.1 | -6.5 |
| Burke, Sean | 51.2 | 0.286 | 28.7 | 0.403 | 52.6 | 0.273 | 42.4 | -12.7 |
| Canning, Griffin | 22.1 | 0.313 | 21 | 0.525 | 38.8 | 0.368 | 27.3 | -17.3 |
| Cantillo, Joey | 25 | 0.391 | 27.4 | 0.469 | 39.1 | 0.501 | 34.3 | -12.9 |
| Cecconi, Slade | 53.9 | 0.530 | 39.2 | 0.304 | 55.7 | 0.37 | 48.8 | -9.2 |
| Chandler, Bubba | 48.6 | 0.478 | 42.2 | 0.313 | 59 | 0.323 | 51.4 | -13.6 |
| Cole, Gerrit | 51.7 | 0.213 | 46.9 | 0.430 | 54.3 | 0.241 | 51.0 | -5.0 |
| Elder, Bryce | 47.3 | 0.444 | 50.5 | 0.364 | 54.7 | 0.319 | 49.8 | -5.8 |
| Gallen, Zac | 40.8 | 0.542 | 38.6 | 0.457 | 44.3 | 0.444 | 41.7 | -4.6 |
| Gausman, Kevin | 45.7 | 0.329 | 49.2 | 0.341 | 53.5 | 0.346 | 50.4 | -6.1 |
| Ginn, J.T. | 44.6 | 0.282 | 40.2 | 0.297 | 48.6 | 0.386 | 42.4 | -6.2 |
| Griffin, Foster | 17.6 | 0.178 | 25.8 | 0.227 | 30.1 | 0.379 | 25.2 | -8.4 |
| Imai, Tatsuya | 48.2 | 0.618 | 44.8 | 0.418 | 54.6 | 0.273 | 48.8 | -8.1 |
| Imanaga, Shota | 35.5 | 0.374 | 49.9 | 0.350 | 50.4 | 0.438 | 46.0 | -7.7 |
| Jax, Griffin | 41.7 | 0.347 | 32.7 | 0.414 | 43 | 0.345 | 30.8 | -5.8 |
| Kay, Anthony | 35.9 | 0.324 | 35.8 | 0.393 | 43.1 | 0.322 | 36.7 | -7.3 |
| Melton, Troy | 48 | 0.199 | 44.9 | 0.365 | 50 | 0.25 | 47.6 | -3.6 |
| Meyer, Max | 28.9 | 0.550 | 33.9 | 0.317 | 35 | 0.285 | 33.0 | -3.6 |
| Nola, Aaron | 35.3 | 0.508 | 42.5 | 0.454 | 42.4 | 0.479 | 42.2 | -3.5 |
| Peralta, Freddy | 54.5 | 0.526 | 50.2 | 0.333 | 56 | 0.316 | 53.2 | -3.7 |
| Ray, Robbie | 39.6 | 0.393 | 39.3 | 0.337 | 45.6 | 0.47 | 43.2 | -6.2 |
| Rea, Colin | 46.8 | 0.600 | 44 | 0.310 | 52.1 | 0.424 | 42.0 | -6.7 |
| Rocker, Kumar | 34.7 | 0.523 | 32.2 | 0.477 | 36.4 | 0.391 | 37.9 | -3.0 |
| Rogers, Trevor | 56.2 | 0.323 | 55.2 | 0.236 | 60.1 | 0.425 | 55.8 | -4.4 |
| Sasaki, Roki | 41.9 | 0.470 | 42.8 | 0.397 | 46 | 0.324 | 43.1 | -3.7 |
| Scott, Christian | 45 | 0.306 | 50 | 0.344 | 52.8 | 0.367 | 49.3 | -5.3 |
| Sproat, Brandon | 52 | 0.306 | 44.8 | 0.262 | 54.8 | 0.31 | 44.1 | -6.4 |
| Wacha, Michael | 42.6 | 0.395 | 37.4 | 0.259 | 45.4 | 0.252 | 41.9 | -5.4 |
| Warren, Will | 55.7 | 0.437 | 65.7 | 0.365 | 67.4 | 0.324 | 64.3 | -6.7 |
| Weathers, Ryan | 29.1 | 0.386 | 44.6 | 0.389 | 47.2 | 0.369 | 42.4 | -10.4 |
| Webb, Logan | 34 | 0.374 | 39.8 | 0.158 | 48.6 | 0.412 | 42.6 | -11.7 |
| Wheeler, Zack | 48 | 0.368 | 49.9 | 0.208 | 53.5 | 0.279 | 50.5 | -4.6 |
| Yamamoto, Yoshinobu | 36.8 | 0.283 | 43 | 0.226 | 45 | 0.179 | 39.5 | -5.1 |
I included the average wOBA for their four-seamers and sinkers to show whether it’s a pitch that has been hit hard or not. When a pitcher throws fewer fastballs, there’s probably a reason why. While we would love to examine all these starting pitchers on the list, it provides a starting point.
Let’s examine four starting pitchers who have been throwing fewer fastballs and whether that’s helpful in their arsenal. We covered a fifth name on this list, Joey Cantillo, in a recent swing timing and miss distance article.

Buying low and selling high. That’s the classic value proposition we all shoot for in trades. We’re trying to win after all!
It’s hard to win if you aren’t extracting value from your opponents, or at least adding value to your own team via the wire.
And at this point in the year, with less than 40% of the fantasy baseball season remaining, it’s time to get serious. It’s time to really consider what holding onto struggling stars means for your playoff chances. It’s time for top seeds to load up on upside and injured players that the bubble teams can no longer afford to hold onto. It’s time to sell the young aces that got you here, for shelf stable veterans, or at least for pitchers we trust to pitch into September.


Following on from the hitters chart, we now look at how pitchers have performed so far this year against their OOPSY rest-of-season (RoS) projections.
Continuing with the framework of the hitters’ piece, this will first look at those with projected ERA rises, then at those with projected ERA drops. Just as we identified BABIP and ISO as the major determining factors in the hitters’ RoS outlooks, we will identify a similar through line here: for pitchers, it is largely strand rate.

With over half of the 2026 season in the books, it’s a good a time to update OOPSY’s Top 100 prospects list, this time with a fantasy spin.

Welcome back to the Ottoneu Starting Pitching Planner. Based on the Roster Resource Probables Grid, I’ve organized every starter slated to start next week into four categories: start, maybe, risky, and sit for Ottoneu points leagues. The first and last category are pretty self-explanatory. Starters who fall into the “maybe” category are guys you could start if you need to keep up with the innings pitched pace in points leagues or need to hit your games started cap in head-to-head leagues; they’re good bets to turn in a decent start, but you shouldn’t automatically insert them into your lineup. If you’ve fallen behind on the innings pitched pace or you’re really starving for starts in a head-to-head matchup, you could turn to a “risky” starter or two.
I’ve also calculated a “Matchup Score” for each series using a straight combination of opponent’s home/away wOBA, opponent wOBA over the last 14 days, and the park factor for the ballpark the teams are playing in. It’s indexed so that 100 is average and anything above that is a favorable matchup and anything below is unfavorable. That matchup rating informs some of the sit/start recommendations I’m making, though the quality of the pitcher definitely takes precedence.
Note: In Ottoneu head-to-head leagues, this week’s matchup runs from July 16–26. Keep that in mind when deciding on your starters, since your games started cap doesn’t adjust for the longer schedule.

We covered some of the best starting pitchers earlier in the week. Now, we’re covering the best starting pitchers with an average draft position (ADP) outside the top 150 picks in 12-team leagues. These pitchers have been performing better than the draft community expected.
The visual below shows the starting pitchers who have been drafted outside the top 150 picks in 12-team leagues, sorted by their earned value in the first half. If a player has a blank ADP, that means they were undrafted.

Though Foster Griffin tops the list, I’ve already examined him in a rookie check-in article in mid-June. Kyle Harrison has been helping to win leagues, though he is on the injured list with a forearm injury. We would love to examine more of these starting pitchers (and maybe we will), but today we’ll highlight five.
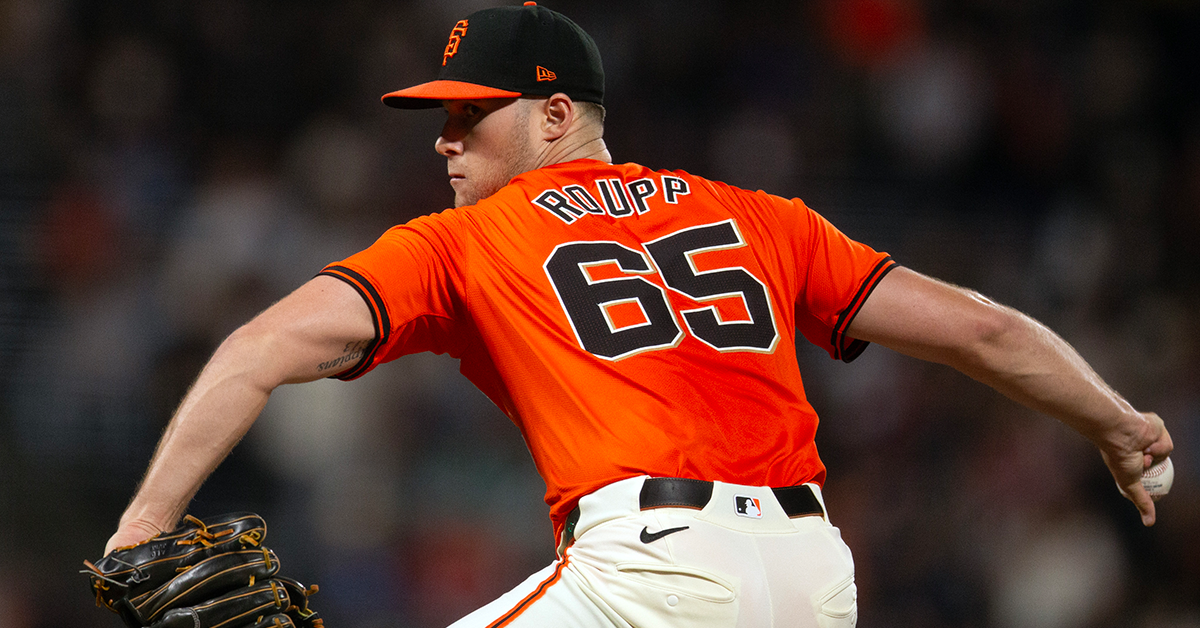
Some call it the second half because it’s easier that way, but there is only 40% of the Major League season remaining. Assuming starting pitchers remain healthy and in the rotation, most will start anywhere from 11 to 14 games between now and the end of the season. There is more than enough time to make up some of our pitching category deficiencies in Rotisserie leagues. Let’s dive into some of the starting pitchers who should be helpful in all fantasy formats and help us finish the season strong.

Let’s look at starting pitchers who have been performing well in the first half. The average draft position data comes from 12-team leagues in NFBC formats. Meanwhile, the dollar value is the earned value via the FanGraphs Player Rater data. The visual below shows the top 25 starting pitchers sorted by earned value in the first half, including their draft price and results.

While 10 of these 25 pitchers come from outside the top 150 in ADP, today we’ll examine some of the more highly drafted starting pitchers on this list to identify whether they’ll continue their success for the second half, or might be sell high candidates.

Yesterday, I continued my annual tradition of polling you on groups of players falling into two performance vs expected buckets, by comparing hitters’ wOBA against their xwOBA. Today, let’s finish things off by comparing starting pitchers’ ERA to SIERA, pitting the SIERA overperformers against the underperformers during the pre-all-star break period. This is the poll I began with back in 2013.