Welcome back to the Ottoneu Starting Pitching Planner. Based on the Roster Resource Probables Grid, I’ve organized every starter slated to start next week into four categories: start, maybe, risky, and sit. The first and last category are pretty self-explanatory. Starters who fall into the “maybe” category are guys you could start if you need to keep up with the innings pitched pace in points leagues or need to hit your games started cap in head-to-head leagues; they’re good bets to turn in a decent start, but you shouldn’t automatically insert them into your lineup. If you’ve fallen behind on the innings pitched pace or you’re really starving for starts in a head-to-head matchup, you could turn to a “risky” starter or two.
I’ve also calculated a “Matchup Score” for each series using a straight combination of opponent’s home/away wOBA, opponent wOBA over the last 14 days, and the park factor for the ballpark the teams are playing in. It’s indexed so that 100 is average and anything above that is a favorable matchup and anything below is unfavorable. That matchup rating informs some of the sit/start recommendations I’m making, though the quality of the pitcher definitely takes precedence. I should also note that I’ve updated the way I’m calculating the park factors for the two new minor league stadiums that the Athletics and Rays are playing in this year; I’m taking the one-year park factors from Statcast and regressing them towards neutral, with the one-year factors increasing in weight as more games are played in those stadiums (those series are still marked in yellow below).
The search for pitching help is never ending. Between injuries and ineffectiveness, fantasy players are always on the lookout for pitchers who are performing well who can provide some reinforcements. Here are eight starters who are rostered in less than 60% of all Ottoneu leagues.
Whether or not you believe in Michael Soroka’s resurgence or not boils down to how sustainable you think his home run rate is. He’s currently allowing a 1.52 HR/9 and 15.4% HR/FB, both of which aren’t out of the norm for his career. Under the surface, you’ll notice that he currently possesses a 3.75 xFIP, 3.34 SIERA, and 3.04 xERA, all of which are well below his 4.70 ERA and 4.33 FIP. He’s allowed just nine barrels all season long, is sporting an above average groundball rate, and the highest strikeout rate of his career. Almost all the damage has come against his four-seam fastball and the underlying performance of that pitch was slightly better in June (.304 xwOBA) than it had been during the first two months of the season (.347 xwOBA). I’m willing to bet that his results on the field will start to look a lot more like his peripherals over the next few months.
Eduardo Rodriguez was one of my favorite preseason sleeper picks — I love a veteran pitcher with a recent history of success because they’re so often undervalued, particularly in Ottoneu. It’s been an up-and-down season for Rodriguez; he had a 2.81 FIP through his first five starts, completely fell apart over his next four with 24 runs allowed in 16 innings, and then hit the IL with a minor shoulder injury. He returned at the beginning of June and has allowed just 7 runs in five starts with an excellent 3.1 strikeout-to-walk ratio. The ongoing health of his shoulder is a concern, but this version of Rodriguez over the last month has been a pretty useful starter.
There are three Orioles starters in the table above so I’ll tackle them all here. Charlie Morton has rebounded quite nicely from his miserable start to the season; since rejoining the starting rotation on May 26, he’s posted a 2.90 ERA and a 2.47 FIP across six starts. His start this week was pushed back to Friday thanks to some minor elbow inflammation, so that’s definitely something to monitor. Trevor Rogers has also looked solid since being recalled on June 18, posting a 2.87 ERA and a 3.41 FIP across three starts. Injuries had absolutely derailed his career but he looks healthy now and maybe he can regain some of the magic from his 2021 breakout with the Marlins. As for Dean Kremer, he’s on a nice little run of starts — a 2.61 ERA and a matching 2.60 FIP across his last seven outings. The only thing I can spot in his profile is a sharp increase in the number of splitters he’s throwing. It’s his best pitch so it’s nice to see the results follow.
I featured Adrian Houser in this column a month ago at the start of June and he’s continued to put up solid numbers for the White Sox since then. I noted that his changeup looked like it was fueling a lot of his success this year — that pitch still has a 42.3% whiff rate — but the results on his curveball have also significantly improved. That gives him two excellent secondary pitches to pair off of his bowling ball sinker.
With seven starters currently on the IL, the Dodgers’ rotation has been in shambles for most of the season. Of all the pitchers they’ve churned through, Justin Wrobleski looks like the one who is going to manage to stick around. He’s allowed just four runs across his last three outings with an excellent strikeout-to-walk ratio. His fastball’s 32.5% whiff rate sits in the 94th percentile for that pitch type and it’s a big reason why he’s been able to wrack up the strikeouts. One thing to note for Ottoneu players: the Dodgers have either used Wrobleski as a piggybacked bulk reliever or used an opener in front of him. That means you’ll need to pay attention to which day’s he might be scheduled to pitch and where you place him in your lineup. Head-to-head players will get an additional bonus for rostering him since his outings won’t count against your weekly games started cap — assuming the Dodgers continue to use him as a bulk reliever rather than a traditional starter.
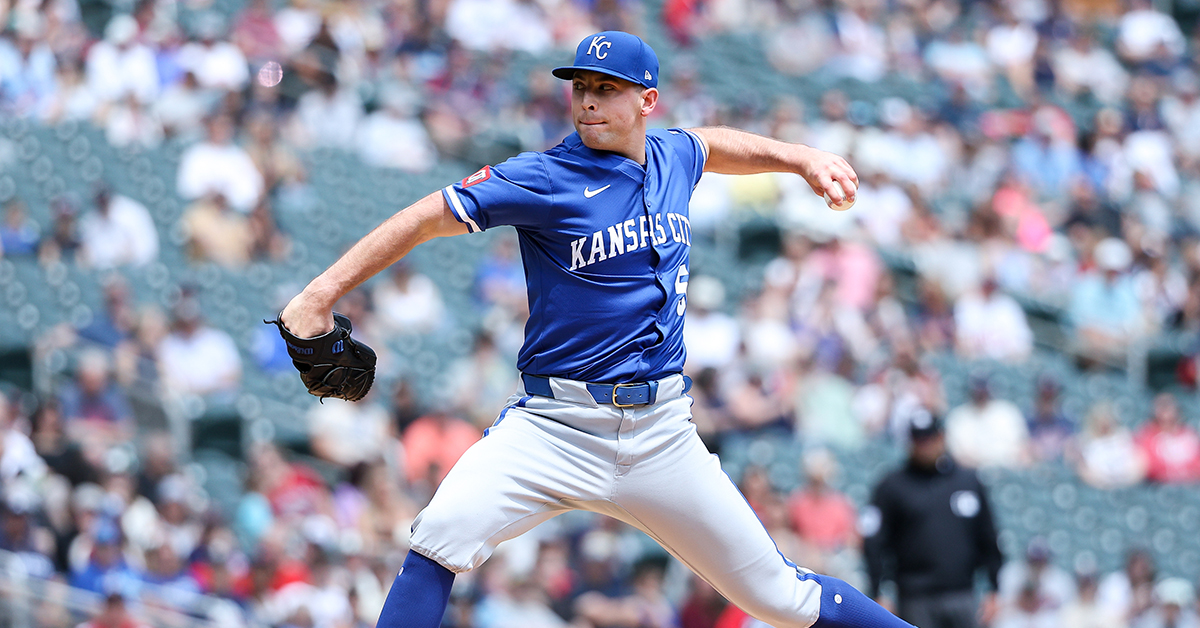
The reason why Stephen Kolek appears in the table above is because his groundball rate is in the 85th percentile among starters with at least 60 innings pitched this year and his home run rate is in the 78th percentile. He doesn’t strike out that many and his walk rate is merely average. If you’re rostering him, you’re banking on those two skills carrying most of his value. The first should be fine but the second could be particularly volatile as the weather warms up.
Welcome back to the Ottoneu Starting Pitching Planner. Based on the Roster Resource Probables Grid, I’ve organized every starter slated to start next week into four categories: start, maybe, risky, and sit. The first and last category are pretty self-explanatory. Starters who fall into the “maybe” category are guys you could start if you need to keep up with the innings pitched pace in points leagues or need to hit your games started cap in head-to-head leagues; they’re good bets to turn in a decent start, but you shouldn’t automatically insert them into your lineup. If you’ve fallen behind on the innings pitched pace or you’re really starving for starts in a head-to-head matchup, you could turn to a “risky” starter or two.
I’ve also calculated a “Matchup Score” for each series using a straight combination of opponent’s home/away wOBA, opponent wOBA over the last 14 days, and the park factor for the ballpark the teams are playing in. It’s indexed so that 100 is average and anything above that is a favorable matchup and anything below is unfavorable. That matchup rating informs some of the sit/start recommendations I’m making, though the quality of the pitcher definitely takes precedence. I should also note that I’ve updated the way I’m calculating the park factors for the two new minor league stadiums that the Athletics and Rays are playing in this year; I’m taking the one-year park factors from Statcast and regressing them towards neutral, with the one-year factors increasing in weight as more games are played in those stadiums (those series are still marked in yellow below).
The search for pitching help is never ending. Between injuries and ineffectiveness, fantasy players are always on the lookout for pitchers who are performing well who can provide some reinforcements. Last time I ran this column, I focused on eight starting pitchers who were pitching well at the time. This time around, my focus will shift to the bullpen — with three starters sprinkled in for good measure.
Over his first seven appearances (six starts and one bulk relief appearance) for the Brewers this year, Quinn Priester’s walk rate was an untenable 14.2%. In his six appearances since then (three starts, three bulk outings), his walk rate has been a very good 3.8%. He’s been pitching in the zone a bit more often — he had a 50.9% zone rate during that first stretch and a 55.2% zone rate during the second — while still maintaining an acceptable strikeout rate and an elite groundball rate. The groundball rate alone should give him a high-ish floor for Ottoneu, and the improved command makes him an interesting dart throw. Just make sure to monitor his usage as a traditional starter or a bulk reliever.
Injuries to George Kirby, Logan Gilbert, and Bryce Miller have forced Emerson Hancock into a much more prominent role in the Mariners rotation than the team probably expected. His season stats are being dragged down by two very ugly starts: a six-run, two-out disaster in his first start of the season and a seven-run, five-inning clunker against the Yankees on May 12. I don’t recommend doing this as a frequent practice, but if you remove those starts from his overall stats, his ERA drops from 4.48 to 2.60, his FIP from 4.81 to 4.09, and his Pts/IP rises from 3.05 to 4.26. That is a perfectly cromulent starter in Ottoneu as long as you’re benching him in particularly difficult matchups.
Mike Burrows isn’t the Pittsburgh pitching prospect we’ve all wanted to see in the big leagues (that would be Bubba Chandler), but he’s got a couple of interesting attributes that could make him an interesting pick up in Ottoneu. First of all, his changeup is currently returning a 51.7% whiff rate and a .252 xwOBA allowed. His slider’s xwOBA allowed is even lower at .221, though it’s not getting the swings and misses like his change is. The problem is that his fastball is far too hittable, which means his ceiling is capped pretty low. Still, he’s allowed just three runs total in his last three starts and is running an excellent 6.67 strikeout-to-walk ratio during this stretch. As long as the changeup continues to be a plus plus bat missing weapon and the slider continues to suppress contact, he’ll likely have stretches like this where he looks dominant. The run-of-the-mill fastball will bring him back to earth eventually.
Let’s tackle all these relievers by team. The Orioles have had a really tough time finding a consistent setup man to pitch in front of closer Félix Bautista. Six different pitchers have recorded a hold over the last week but the three pitchers listed in the table above look like the most interesting of the bunch. Bryan Baker has increased his strikeout rate 10 points this year while simultaneously cutting his walk rate to a career low. Fueled by an absolutely devastating changeup, he’s the guy I’m targeting out of this ‘pen. Seranthony Domínguez is no stranger to high-leverage work, though his inconsistent command means he’s been pretty volatile throughout his career. He’s on a heater right now, allowing just five baserunners over his last nine outings while striking out 16. Acting as the left-handed specialist in the bullpen, Gregory Soto is earning holds at a consistent pace while also providing solid rate stats.
It looks like Garrett Whitlock and Greg Weissert have settled in as the setup options in front of closer Aroldis Chapman in the Red Sox bullpen. Interestingly, both setup guys have earned saves in the last week after Chapman was unavailable for a few days and then used in the eighth inning on Wednesday to face the top of the Mariners lineup. Whitlock has overcome a long injury history and a failed attempt to convert him to a starter to settle in as a high-leverage reliever this year, a role he was familiar with back when he first broke into the big leagues. His strikeout rate has jumped up to 30.1%, though his walk rate is still a little high at 9.2%. Weissert hasn’t been as dominant as Whitlock, but he’s getting high-leverage opportunities and has done well to convert those opportunities into holds and saves.
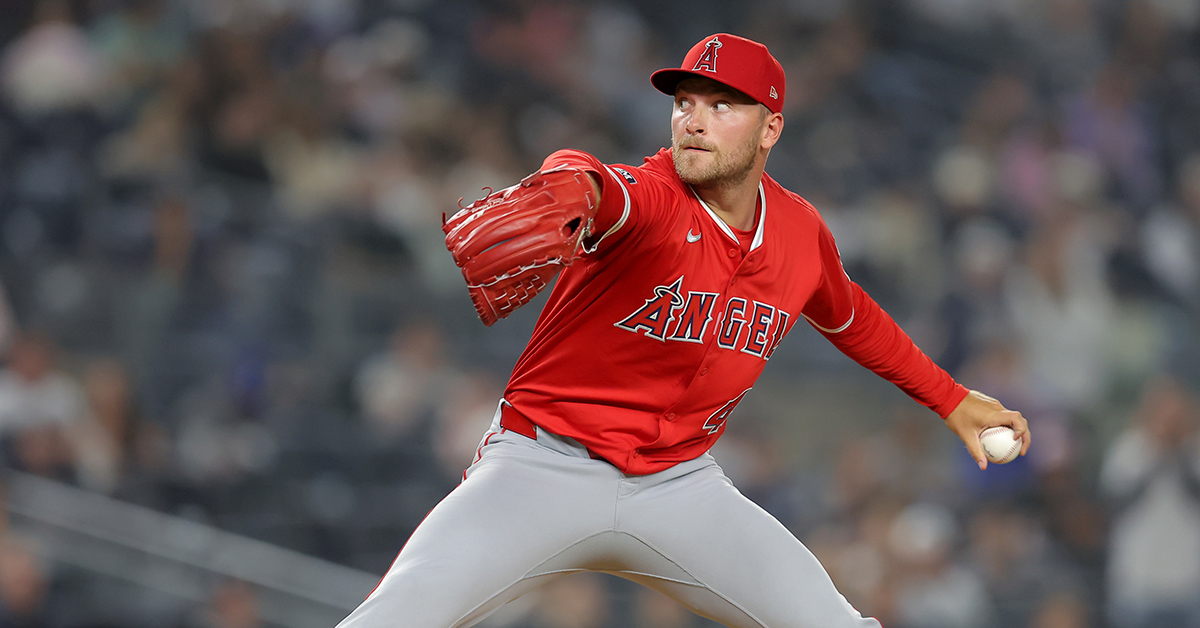
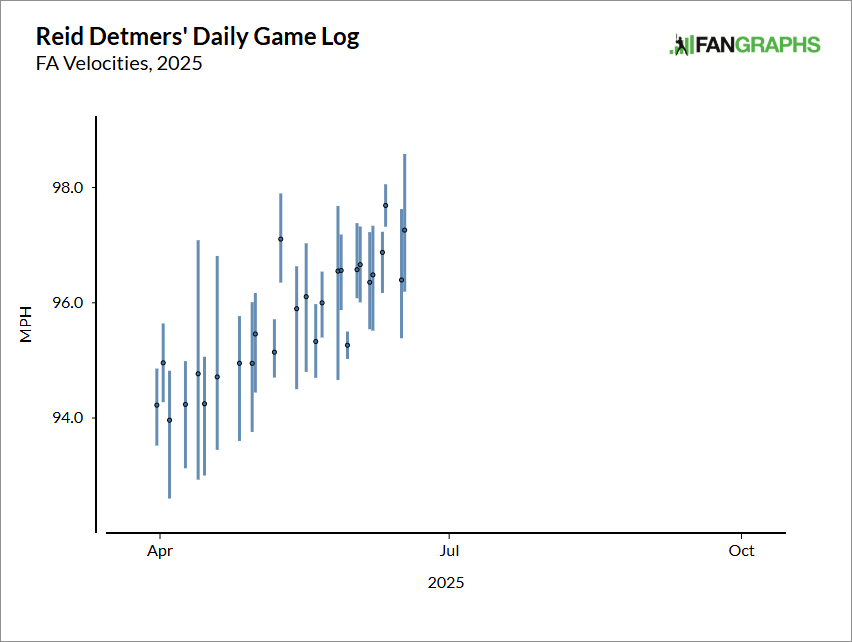
Across three outings from April 30–May 7, Reid Detmers allowed 12 runs while recording just a single out. Since that low point, he’s allowed a single run in 16 appearances and is suddenly looking like a dominant high-leverage reliever. His strikeout rate is nearly 40% during this stretch and he’s earned six holds and two saves for the Angels. He has been throwing his fastball about two ticks harder than earlier in the season.
His pitch mix looks the same and there haven’t been any big changes to his approach: his zone rate and chase rate are ever so slightly higher during this hot streak, but batters are swinging and missing at his pitches a lot more often. His success might just come down to a harder fastball and better execution.
I included Nick Mears in this column back on May 13 and he had a bit of a hiccup right after that write up; across his next seven appearances after that article posted, he allowed six runs in 7.1 innings while striking out just three. Across his next seven appearances, he’s been a lot better, holding his opponents scoreless while allowing just two baserunners and striking out eight. He’s firmly behind Trevor Megill and Abner Uribe in the pecking order, but he could be working his way back into high-leverage opportunities in the sixth or seventh inning.
The Twins bullpen has been a bit of a mess recently — they’ve lost three games for the team in the past week — but that just means there are new opportunities for relievers to gain the trust of manager Rocco Baldelli. Jhoan Duran and Griffin Jax are probably safe in their roles, but Louis Varland and Brock Stewart could be sneaking into high-leverage work ahead of those two. Varland has transitioned from the rotation to the ‘pen this year and has looked pretty solid as a reliever. He’s got the big fastball and devastating curveball to thrive in the late innings. Stewart has what Stuff+ thinks is one of the very best sliders in baseball. He’s been particularly injury prone during his career and his command can be spotty at times, leading to some volatility. Still, the 35% strikeout rate is nothing to scoff at, and as long as he’s healthy, he should be a high-leverage option for the Twins.
Welcome back to the Ottoneu Starting Pitching Planner. Based on the Roster Resource Probables Grid, I’ve organized every starter slated to start next week into four categories: start, maybe, risky, and sit. The first and last category are pretty self-explanatory. Starters who fall into the “maybe” category are guys you could start if you need to keep up with the innings pitched pace in points leagues or need to hit your games started cap in head-to-head leagues; they’re good bets to turn in a decent start, but you shouldn’t automatically insert them into your lineup. If you’ve fallen behind on the innings pitched pace or you’re really starving for starts in a head-to-head matchup, you could turn to a “risky” starter or two.
I’ve also calculated a “Matchup Score” for each series using a straight combination of opponent’s home/away wOBA, opponent wOBA over the last 14 days, and the park factor for the ballpark the teams are playing in. It’s indexed so that 100 is average and anything above that is a favorable matchup and anything below is unfavorable. That matchup rating informs some of the sit/start recommendations I’m making, though the quality of the pitcher definitely takes precedence. I should also note that I’ve updated the way I’m calculating the park factors for the two new minor league stadiums that the Athletics and Rays are playing in this year; I’m taking the one-year park factors from Statcast and regressing them towards neutral, with the one-year factors increasing in weight as more games are played in those stadiums (those series are still marked in yellow below).
The search for pitching help is never ending. Between injuries and ineffectiveness, fantasy players are always on the lookout for pitchers who are performing well who can provide some reinforcements. There have been a bunch of unheralded starters compiling strong starts since the calendar rolled over to May. Here are eight who are rostered in less than 60% of all Ottoneu leagues.
I covered a couple of guys listed above the last time I ran this column: Chad Patrick and Chris Paddack. They’ve both continued to pitch excellently and what might have been a hot streak has now turned into a solid two months of production. Patrick’s fastball velocity has ticked up as the season has progressed and he’s seen his strikeout rate rise as a knock-on effect. Paddack hasn’t been as good as Patrick but he’s extended his stretch of starts with two or fewer runs allowed to five games now.
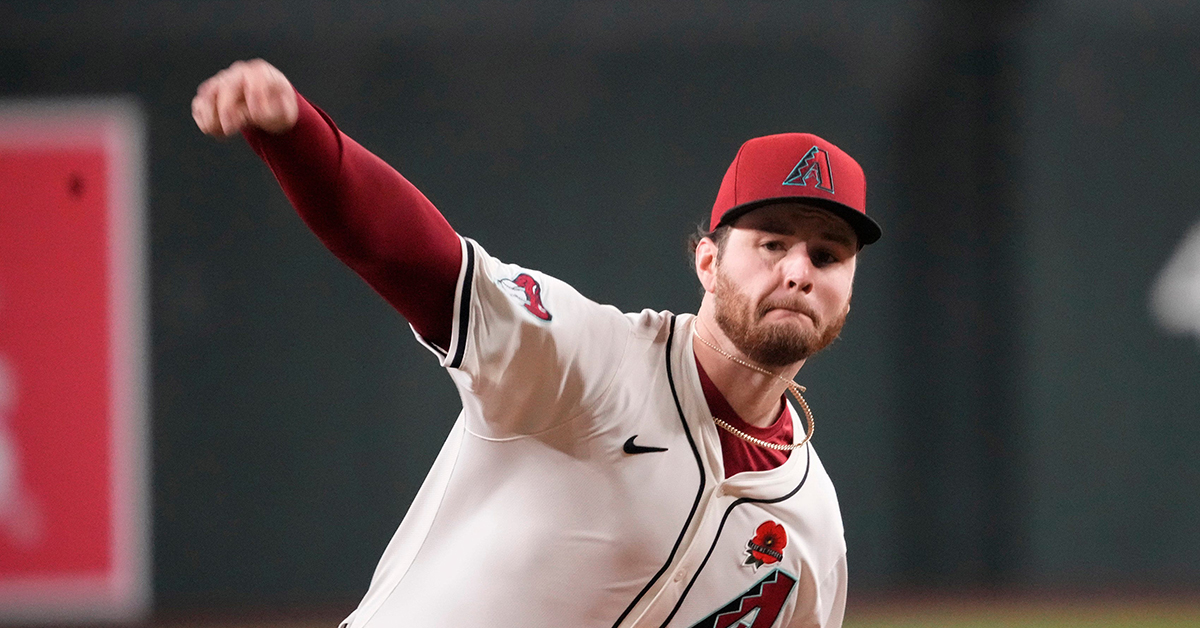
Ryne Nelson has gotten an opportunity to start recently as the Diamondbacks have dealt with a number of injuries to their roster. He was probably ticketed for a return to the bullpen with the impending return of Eduardo Rodriguez but Corbin Burnes’s elbow injury should give Nelson an extended look in the rotation. He had a nice stretch of starts during the second half of the season last year — a 3.05 ERA and a 3.14 FIP from the beginning of July through the end of the season — and the hope is that he can replicate that mini-breakout this year. He won’t strikeout that many leaving him at the whim of batted ball luck, but he’s proven he can find success with that profile in the past.
Sean Burke entered the season with a bit of helium thanks to an intriguing cup of coffee last year. He was the White Sox Opening Day starter and he tossed a six-inning scoreless gem in the first game of the year. Things went downhill from there; he allowed 22 runs over his next five starts and both his ERA and FIP were up over six. His next six appearances have been much better to the tune of a 2.73 ERA and a 4.26 FIP. He’s still struggling with his command but he’s managed to navigate the extra traffic. The other thing to note is that the White Sox used an opener in front of Burke in his last appearance. If they continue that trend, you should be aware of the Ottoneu rules surrounding openers/followers: bulk pitchers who come in after an opener only get points if they’re slotted into a RP slot since they’re making a relief appearance.
Bailey Falter has been on an impressive run of starts since the beginning of May; over his last six starts he’s allowed a total of four runs! The underlying peripherals look pretty ugly however as he’s struck out just 19 in 35.2 innings while walking 13. He’s surviving by suppressing every batted ball put in play against him. I wouldn’t trust that he’s going to continue this hot streak.
Ryan Yarbrough has been fantastic since the Yankees moved him to their starting rotation at the start of May. He’s allowed no more than two runs in any of his five starts and has produced a fantastic 4.8 strikeout-to-walk ratio. His changeup and sweeper are both returning whiff rates north of 40% and he’s emphasized his cutter in his pitch mix to keep right-handed batters at bay. One thing to note for Ottoneu players: he’s allowed a home run in four of his five starts which has held him back from truly racking up the points in this format.
If you’re really desperate for some innings, Germán Márquez has looked decent-ish over his last few starts after a particularly ugly start to the season. Even at his peak, his points per innings pitched never crossed over five since his home ballpark is so tough to pitch in. I will note that he’s allowed just four home runs this year and none since May 4.
After bouncing around four teams over the past year, Adrian Houser has caught on with the White Sox this May. His first three starts for Chicago have gone as well as could be expected; he’s allowed a total of three runs while running a decent 2.8 strikeout-to-walk ratio. He’s had spurts of effectiveness in the past while he was with Milwaukee and it’s possible he’s found something that works this year. He’s added a ton of horizontal movement to his changeup and is currently running a 52.9% whiff rate with that pitch. Monitor his performance over the next few weeks and see if that pitch is still as effective once batters have a better scouting report on it.
Welcome back to the Ottoneu Starting Pitching Planner. Based on the Roster Resource Probables Grid, I’ve organized every starter slated to start next week into four categories: start, maybe, risky, and sit. The first and last category are pretty self-explanatory. Starters who fall into the “maybe” category are guys you could start if you need to keep up with the innings pitched pace in points leagues or need to hit your games started cap in head-to-head leagues; they’re good bets to turn in a decent start, but you shouldn’t automatically insert them into your lineup. If you’ve fallen behind on the innings pitched pace or you’re really starving for starts in a head-to-head matchup, you could turn to a “risky” starter or two.
I’ve also calculated a “Matchup Score” for each series using a straight combination of opponent’s home/away wOBA, opponent wOBA over the last 14 days, and the park factor for the ballpark the teams are playing in. It’s indexed so that 100 is average and anything above that is a favorable matchup and anything below is unfavorable. That matchup rating informs some of the sit/start recommendations I’m making, though the quality of the pitcher definitely takes precedence. I should also note that I’ve updated the way I’m calculating the park factors for the two new minor league stadiums that the Athletics and Rays are playing in this year; I’m taking the one-year park factors from Statcast and regressing them towards neutral, with the one-year factors increasing in weight as more games are played in those stadiums (those series are still marked in yellow below).