Archive for Meta Analysis

Projection Busting Research Updated

Over the years, I’ve been working on how to fine-tune my player evaluation process. The following are six datasets that I’ve found useful I’ll not go into detail on any of them since I provide a link to the original article. The following is basically a referenceable data dump.

Note: I know there is a lot of content and when questions arise, make sure the area in question is obvious in the comment. Also, I’ll only answer questions here and not in the original articles.

Voit/Muncy All-Stars (link)

These are older AAA hitters who have shown signs of a breakout.

Voit/Muncy All-Stars
Name Position Age Team PA BB% K% GB% ISO
Adam Engel OF 27 White Sox 277 8% 22% 43% .194
Addison Russell SS 25 Cubs 119 12% 21% 38% .281
Andy Ibanez 2B/3B 26 Rangers 529 10% 17% 37% .197
Austin Dean OF 25 Marlins 282 10% 18% 39% .298
Billy McKinney OF 24 Blue Jays 154 14% 16% 35% .217
Breyvic Valera 2B 27 Yankees 348 10% 10% 34% .200
Bryan Reynolds OF 24 Pirates 57 12% 19% 38% .367
Cavan Biggio 2B 24 Blue Jays 174 20% 16% 30% .203
Chance Sisco C 24 Orioles 196 10% 22% 42% .238
Chas McCormick OF 24 Astros 225 12% 15% 37% .204
Cheslor Cuthbert 3B 26 Royals 219 8% 21% 39% .218
Connor Joe 1B/3B 26 Dodgers 446 16% 18% 42% .203
Cristhian Adames SS 27 Giants 165 12% 19% 42% .234
Daniel Pinero 3B/SS 25 Tigers 110 16% 23% 32% .220
DJ Stewart OF 25 Orioles 277 14% 18% 41% .257
Donnie Dewees OF 25 Cubs 419 10% 15% 41% .207
Esteban Quiroz 2B/SS 27 Padres 366 14% 22% 38% .268
Harrison Bader OF 25 Cardinals 75 11% 21% 26% .381
Jason Vosler 3B 25 Padres 426 11% 24% 37% .232
Jaylin Davis OF 24 Giants 117 12% 24% 40% .353
Jeimer Candelario 3B 25 Tigers 178 12% 20% 42% .268
Johan Camargo SS 25 Braves 64 8% 19% 35% .207
Jonah Heim C 24 Athletics 119 9% 15% 34% .198
Jose Rojas 3B 26 Angels 578 10% 23% 31% .283
Josh VanMeter 2B/3B 24 Reds 211 11% 18% 38% .320
Kevin Cron 1B 26 Diamondbacks 377 16% 20% 26% .446
Mark Payton OF 27 Athletics 447 10% 17% 35% .319
Matt Thaiss 1B 24 Angels 372 16% 17% 42% .203
Michael Brosseau 3B 25 Rays 315 11% 18% 40% .263
Michael Perez C 26 Rays 216 13% 24% 36% .250
Mike Ford 1B 26 Yankees 349 13% 16% 40% .303
Nick Dini C 25 Royals 213 10% 14% 33% .269
Nick Tanielu 2B/3B 26 Astros 503 9% 17% 36% .225
Oscar Mercado SS/OF 24 Indians 140 11% 23% 40% .202
P.J. Higgins C 26 Cubs 140 12% 21% 40% .231
Phillip Ervin OF 26 Reds 172 11% 20% 31% .193
Roberto Pena C 27 Angels 155 11% 19% 32% .196
Ronald Guzman 1B 24 Rangers 135 13% 23% 39% .197
Rowdy Tellez 1B 24 Blue Jays 109 13% 23% 34% .323
Ryan McBroom 1B 27 Yankees 482 12% 21% 38% .259
Ryan O’Hearn 1B 25 Royals 149 11% 21% 39% .302
Taylor Jones 1B 25 Astros 531 13% 21% 37% .210
Taylor Ward C/3B 25 Angels 512 16% 20% 38% .278
Ty France 1B/3B 24 Padres 348 9% 15% 31% .372
Will Smith C 24 Dodgers 270 15% 18% 28% .335
Willie Calhoun 2B/OF 24 Rangers 172 19% 14% 33% .232
Yermin Mercedes C 26 White Sox 220 11% 19% 28% .337

Read the rest of this entry »


Risk, Uncertainty, and Fantasy Baseball

Gred Gigerenzer (yes that’s his real name) has been a leading advocate on how to correctly measure and articulate risk. I’d highly recommend his book Risk Savvy: How to Make Good Decisions, but today, I’m going to focus on some passages from another book of his, Calculated Risk, which focuses on risks in the medical profession. Some of the passages seem to resonate with me about the fantasy expert community, especially this question: what should be the intent and expectations of touts?

One point Gigerenzer hopes to get across is the difference between Risk and Uncertainty. For him, Risk is measurable such as pitcher X as a 40% chance of going on the IL based on his age and past injury history. Uncertainty involves values that can’t be (or aren’t) measured like player Y is going through a divorce so his production is down.
Read the rest of this entry »


Let’s Talk About Launch Angle Generally

Edit: Further investigation has brought to my attention that the results presented below are slightly askew, although not incorrect. All discussion below regarding hit frequency (BABIP) and contact quality (expected wOBA on contact, or xwOBAcon) should have been framed specifically in the context of non-home run batted ball events. This is significant, because home runs are a big deal, but it’s also insignificant. Allow me to explain.

When we re-include home runs, the relationship between launch angle tightness (stdev[LA]) and contact quality weakens dramatically. I think it comes down to the graph shown in the middle of the post below. Removing home runs narrows the range of productive launch angles, thus making a tighter range of launch angles (confined primarily to line drives) more appealing. When you include home runs, it expands the range of productive launch angles to include productive fly balls in addition to productive line drives. There’s literally more margin for error when we reconsider home runs, making a tighter range of launch angles was valuable.

That doesn’t mean launch angle tightness isn’t important! If anything, removing home runs was a nifty way to demonstrate this fact.

Anyway, I have updated this post with red text to clarify that references to contact quality exclude home runs — and that the findings from this post are technically correct, just through a certain lens.

* * *

Last week, I published some work regarding launch angle “tightness,” aka a hitter’s ability to replicate his average angle as closely as possible as often as possible. Effectively a measure of consistency, I found launch angle tightness (consistency, variance, whatever you want to call it) bore a moderately strong relationship with batting average on balls in play (BABIP).

Truth be told, I began to question my finding almost immediately for reasons I’ll discuss shortly. After inquiries from The Athletic’s Eno Sarris, FantasyPros/PitcherList’s Nick Gerli, and even Cody Asche (this is the mildest of brags) that echoed my internal self-doubting dialogue, I dove into the question further.

Ultimately, the best explanation for the importance of launch angle consistency is to simply elaborate upon launch angle generally. So, consider this a de facto primer on launch angle. It’s probably not the first and certainly won’t (or shouldn’t) be the last. But in the context of my post from last week, it simply makes sense to bring the conversation full circle and wrap it up nicely with a bow. And the final result is gratifying, I hope.

Enjoy (or not, I’m not your dad):

Read the rest of this entry »


Injured Hitters: Projection Adjustments

Historically, I’ve “corrected” hitter projections to my own liking and every time I’ve backtested them to the actual results, my adjustments have failed miserably. So why create more work when the end results make my final product worse? Am I a glutton for punishment? In all fairness, I’m sure a heavy dose of Dunning-Kruger is going on but I also believe there may be a sweet spot where personal scouting can come into play. Today, I’m going back to the well one more time to see if some injured hitters should have more encouraging projections because they may have played hurt.

First, I’ve always thought playing through an injury meant that the team and the player were accepting suboptimal production. Then the player could come back healthy and full productive the next season.
Read the rest of this entry »


The 2020 Edition of The Process is Now Available in Paperback

A few weeks back, I posted that the 2020 edition of The Process was available in e-book form for downloading. All the loops have been jumped and now all it is available in paperback form at Amazon.

Here are some of the additions:

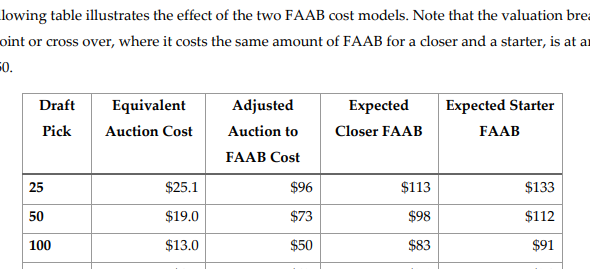
• A comparison to see if it’s more efficient to buy closers versus starters in the draft or wait for free agency for each one.

Read the rest of this entry »


Hitting Tiers Via the Auction Calculator

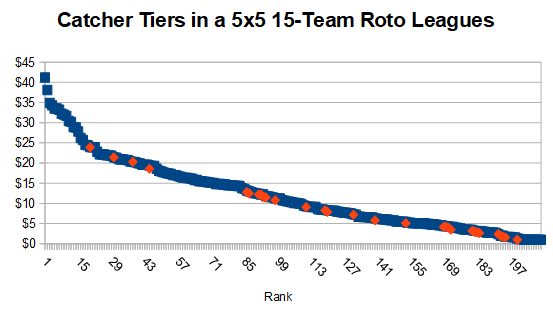
With people already participating in 2020 drafts, I thought it was time to see where and if any positional tiers exist. I don’t believe in making up a tier where a dropoff doesn’t exist. I’m more looking for spots where for two or more rounds, a position should not even be in consideration to be drafted. Also, is there a point where the position just falls off and no one decent is left?

To set up the tiers, I used this 15-team Roto setup and our Depth Chart projections. I know everyone won’t agree with all the projections. I don’t, but they’ll provide a nice guideline for this discussion. It’s time to start with catchers.

Catcher

Tiers

  • Tier 1. It’s four options and then wait.
  • Tier 2. The rest of the options are evenly spaced until the end.

Read the rest of this entry »


Departing the Fly Ball Revolution — May 2019, A Review

Yesterday, I reviewed the hitters who had increased their FB% by at least 10% through May 4 of the season and noted how they had performed over the rest of the season. As a group, they held onto a little bit less than half of their gains from 2018. It goes to show that regression toward historical averages are a powerful force, but that batted ball profiles are more controllable and changes could indicate a real change in approach. Will the same results show up when reviewing the hitters who “departed” the fly ball revolution through early May? Let’s find out if these guys got their FB% marks back to where they settled in 2018 or if the early marks were the first sign of an altered batted ball profile.

Read the rest of this entry »


The World of the Weird and Extreme — Through May 4, 2019 Pitchers, A Review

In Early May, I dove into the world of small sample size theater to discuss some of the statistical oddities that had occurred so far on the pitching side of the ledger. Let’s review how these pitchers performed the rest of the way in the metrics highlighted.

Read the rest of this entry »


When to Breakout the Wallet with FAAB Bids?

While it might be better to focus on FAAB usage right before the season starts, I wanted to have an idea on how to focus my draft resources. Also, FAAB management was one of my major faults after I picked over my 2019 teams. It was an issue and I need to address it. Now is the time. I took the 50 players with the highest average FAAB bids in the 2019 NFBC Main Event ($1000 in FAAB) and found which players were the best and worse deals and did the best deals have similar actionable traits.

Note: One unintended side effect was that the minimum average value was $51, so all players with a bid of over $50.

To rank the player’s usefulness, I pair them up against each other and let my Twitter followers which of the two players were a better deal last year. While not ideal or the only method I could have used (I could create from value to EOS), it was the quickest and the rankings pass the idiot check (me, myself, and I).

Read the rest of this entry »


2019 Deserved Barrel% – Full List

A couple of weeks ago, I devised a deserved barrel rate (where barrel rate is calculated as a percentage of batted ball events, or Barrel/BBE) based exclusively on a hitter’s average exit velocity (EV) and average launch angle (LA). To employ such a simple model, I made a broad but accurate assumption: the average hitter’s average EV (or LA) has a distribution of EVs (or LAs) centered around it, and this distribution does not differ dramatically from other hitters’ distributions.

In layman’s terms, the typical hitter’s average launch angle is his — he owns it, and it reflects his swing plane and mechanics — but he is no better than any other typical hitter in repeating his average launch angle. He, like everyone else, will likely vary from the mean by a certain margin of error. I make the same assumption of exit velocity as well. The two variables bear almost zero correlation to each other. In light of this assumption, the best thing a hitter can do is maximize his exit velocity and hopes it coincides with an optimal launch angle.

(Some folks have suggested I include the percentage of balls hit 95+ mph to refine deserved barrels. The notion intrigues me. However, to illustrate a point: if you have two hitters with identical average EVs, would you expect their distribution of EVs to be dramatically different? Probably not. The inclusion of hard-hit rate accepts as fact that one hitter might be better at hitting 95+ mph more frequently — which would also suggest he hits more softly more frequently as well, and with certainty. This doesn’t stand out to me as a repeatable, let alone necessarily desirable, trait.)

Read the rest of this entry »