Archive for Hitters

Injured Hitters: Projection Adjustments

Historically, I’ve “corrected” hitter projections to my own liking and every time I’ve backtested them to the actual results, my adjustments have failed miserably. So why create more work when the end results make my final product worse? Am I a glutton for punishment? In all fairness, I’m sure a heavy dose of Dunning-Kruger is going on but I also believe there may be a sweet spot where personal scouting can come into play. Today, I’m going back to the well one more time to see if some injured hitters should have more encouraging projections because they may have played hurt.

First, I’ve always thought playing through an injury meant that the team and the player were accepting suboptimal production. Then the player could come back healthy and full productive the next season.
Read the rest of this entry »


Tommy Pham and Hunter Renfroe Swap Coasts

It’s only the beginning of December and we’ve already seen a number of interesting trades. And Mike Moustakas has already signed a contract! What an offseason so far. On Friday, the Rays and Padres agreed to a trade, which included Tommy Pham moving to the latter and Hunter Renfroe to the former. Let’s take a look at the park factors to figure out how the moves might affect their production.

Read the rest of this entry »


Let’s Talk About Launch Angle “Tightness”

Yesterday, I finally followed up on a note written on my white board for months: “sd(LA) –> BABIP?” The results from my research: the tightness of a hitter’s launch angle is moderately positively correlated with his batting average on balls in play (BABIP). I measure “tightness” in terms of variance. The narrower the distribution of his launch angles, the tighter. The wider, the looser. There is also weak evidence to suggest a tighter launch angle correlates with more consistent exit velocity (EV).

(Turns out Brock Hammit, who is part of the Brewers’ player development team, investigated this very idea in June. Small world! Great minds! All that good stuff.)

As noted in my Tweet, the crux of the finding hints at something previously quantifiable only by the eye test: bat control. In effect, it’s a quantification of the hit tool — to me, the most interesting possible application. Would it surprise you to learn that Joey Votto has the tightest launch angle in the Statcast EraTM? Followed by hitting savants both current and former, such as Freddie Freeman, Miguel Cabrera, Joe Mauer, Mike Trout, Michael Brantley — and maybe less-expected and arguably underrated names (underrated exclusively in the greater “hit tool” discussion) like Justin Turner, Daniel Murphy, J.D. Martinez, and DJ LeMahieu?

Tightest Launch Angles – Statcast EraTM
Hitter Name BBE stdev(LA) EV
Joey Votto 2,148 21.8 88.5
Nick Castellanos 2,132 22.0 88.7
Freddie Freeman 2,054 22.4 89.8
Miguel Cabrera 1,692 22.6 92.1
Joe Mauer 1,738 22.7 89.6
Brandon Belt 1,723 23.0 87.4
Matt Carpenter 1,881 23.0 88.7
J.D. Martinez 1,938 23.2 91.3
Justin Turner 1,894 23.2 89.5
DJ LeMahieu 2,452 23.6 90.2
Mike Trout 1,860 23.6 90.5
Michael Brantley 1,839 23.7 88.7
Eugenio Suarez 1,872 24.1 87.9
Matt Kemp 1,672 24.3 88.4
Daniel Murphy 2,068 24.4 88.7
stdev(LA) = Standard deviation of launch angle
Top 15 of 120 hitters with 1,600 batted ball events (BBEs) since the beginning of 2015.

These hitters all have or had outstanding contact skills, superb batted ball efficacy, or both. If you click through to any of their player pages, you’ll encounter routinely elevated BABIPs.

Is there more to this than meets the eye? I’m not sure. Obviously all of this here is but a small part of a much bigger puzzle and should be used in conjunction with, and not in place of, our existing knowledge about player performance. I wouldn’t consider this the be-all, end-all of BABIP analysis by any means, although I do think it’s significant.

That said, here are three potentially pertinent applications of this knowledge:

Read the rest of this entry »


Hitting Tiers Via the Auction Calculator

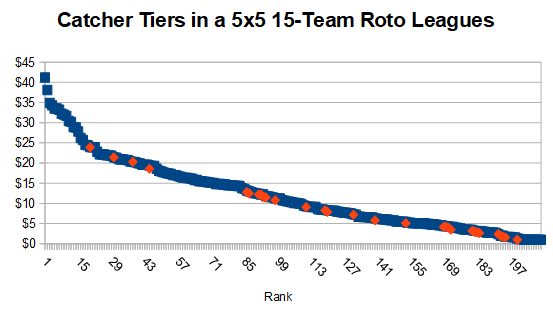
With people already participating in 2020 drafts, I thought it was time to see where and if any positional tiers exist. I don’t believe in making up a tier where a dropoff doesn’t exist. I’m more looking for spots where for two or more rounds, a position should not even be in consideration to be drafted. Also, is there a point where the position just falls off and no one decent is left?

To set up the tiers, I used this 15-team Roto setup and our Depth Chart projections. I know everyone won’t agree with all the projections. I don’t, but they’ll provide a nice guideline for this discussion. It’s time to start with catchers.

Catcher

Tiers

  • Tier 1. It’s four options and then wait.
  • Tier 2. The rest of the options are evenly spaced until the end.

Read the rest of this entry »


At What Age is a Hitter’s Projection No Longer Reliable?

I blame my podcat mate Rob Silver for today’s study. First, he stated this:

And then he said this:

Of course, players age. Some quickly. Some not as fast. While few hitters remain productive into and past their mid-30’s, I needed a simple rule on how to deal with these vets. I found one and since I need to provide content to be paid, so does the world.
Read the rest of this entry »


2020 Buybacks

Everyone likes finding the next big thing in fantasy baseball and cashing in, but sometimes the best pickup is buying back in on a player coming off a down season in hopes of a return to previously established levels of production or reach new heights hinted at by their prospect status and minor league production. Here is a group of players I’m buying late:

1B: Luke Voit | 17th at position, 169th pick

Voit only played 47 games in 2018, but he posted a nice 1.069 OPS with 15 HR and 36 RBI across 161 PA. His move to New York seemed to spur a breakthrough that many were hoping he could build upon in 2019. A sports hernia made that tough, though, costing him time in both July and August and likely playing a role in his .673 OPS during September. Before the injury it was looking like he was going to turn his 2018 into a full-scale breakout as he hit .280/.393/.509 with 17 HR through June (78 games). Overall, he still posted a solid 126 wRC+. Assuming he recovers in the offseason, he should get back on track in 2020 and I could see a .270 AVG, 30 HR, 100 RBI, and 100 R.

Read the rest of this entry »


Heading in Opposite Directions: J.D. Martinez and Jorge Soler

For each of the previous installments of this series, where I have compared the 2019 seasons of two players on different trajectories who achieved similar Roto value, I have run a poll. The assumption behind the polls is that the two players could be similarly valued for 2020. I’ve used the polls to get a pulse on which player would be viewed as the better fantasy performer — the one on the upswing or the one who just had a “down” year?

In comparing Jorge Soler and J.D. Martinez, whose 5×5 Roto values were separated by one-tenth of a dollar, there is no mystery as to which player will be targeted earlier on draft day. In the #2EarlyMocks, Martinez ranked seventh among outfielders with an 18.6 ADP, while Soler ranked 30th with a 97.3 ADP. In the recently-completed Pitcher List Experts Mock that I participated in, Martinez was the 20th player chosen overall, and Soler stayed on the board until the 73rd pick. Soler may have slightly outearned Martinez this year, but the Red Sox outfielder/DH has had success for so much longer that it is not at all surprising that fantasy owners would not view them as equivalent.
Read the rest of this entry »


Departing the Fly Ball Revolution — May 2019, A Review

Yesterday, I reviewed the hitters who had increased their FB% by at least 10% through May 4 of the season and noted how they had performed over the rest of the season. As a group, they held onto a little bit less than half of their gains from 2018. It goes to show that regression toward historical averages are a powerful force, but that batted ball profiles are more controllable and changes could indicate a real change in approach. Will the same results show up when reviewing the hitters who “departed” the fly ball revolution through early May? Let’s find out if these guys got their FB% marks back to where they settled in 2018 or if the early marks were the first sign of an altered batted ball profile.

Read the rest of this entry »


Joining the Fly Ball Revolution — May 2019, A Review

In early May, I identified and discussed 17 hitters who had boosted their fly ball rates by at least ten percentage points (30% to 40%, for example) through May 5th. With the fly ball revolution in full swing, these were potentially the newest members. For high HR/FB rate guys, more fly balls is probably a good thing as it will increase homers and runs scored, and probably runs batted in, which should be enough to offset a decline in batting average. Did these hitters maintain their early increased FB% marks or did they experience regression back to 2018 levels over the rest of the way?

Read the rest of this entry »


2019 Deserved Barrel% – Full List

A couple of weeks ago, I devised a deserved barrel rate (where barrel rate is calculated as a percentage of batted ball events, or Barrel/BBE) based exclusively on a hitter’s average exit velocity (EV) and average launch angle (LA). To employ such a simple model, I made a broad but accurate assumption: the average hitter’s average EV (or LA) has a distribution of EVs (or LAs) centered around it, and this distribution does not differ dramatically from other hitters’ distributions.

In layman’s terms, the typical hitter’s average launch angle is his — he owns it, and it reflects his swing plane and mechanics — but he is no better than any other typical hitter in repeating his average launch angle. He, like everyone else, will likely vary from the mean by a certain margin of error. I make the same assumption of exit velocity as well. The two variables bear almost zero correlation to each other. In light of this assumption, the best thing a hitter can do is maximize his exit velocity and hopes it coincides with an optimal launch angle.

(Some folks have suggested I include the percentage of balls hit 95+ mph to refine deserved barrels. The notion intrigues me. However, to illustrate a point: if you have two hitters with identical average EVs, would you expect their distribution of EVs to be dramatically different? Probably not. The inclusion of hard-hit rate accepts as fact that one hitter might be better at hitting 95+ mph more frequently — which would also suggest he hits more softly more frequently as well, and with certainty. This doesn’t stand out to me as a repeatable, let alone necessarily desirable, trait.)

Read the rest of this entry »