Batted Ball Analysis: Goldy, Shaw, Moncada, & Santana
Earlier this week, I examined the batted data on four hitters and I’m diving into four more today. My goal is to see if their breakout or struggles stemmed from normal aging or swing or approach change. Sometimes the change is obvious and other times, it’s murky.
Currently, I’m using five StatCast data points per month:
- Average Launch Angle
- Average Exit Velocity
- Max Exit Velocity
- Hard Hit Launch Angle: The average launch angle for all batted balls hit over 98 mph.
- Average Hard Hit Difference: The difference between the HHLA and the angle for the sub-98 mph hits. From yesterday’s research, hitters start to see a production decline at a 0 AHHD and it accelerates around -4.4 AHHD. Basically, the batter is trying to get too much loft and his batted balls are going for weak flyouts.
I’m plotting the best-fit curves using the LOWESS (LOcally WEighted Scatter-plot Smoother) method. The curves use the nearest data points to create a best-fit line. Additionally, I’ve weighted the curve by the monthly batted balls. These values are represented by the dot size in each graph.
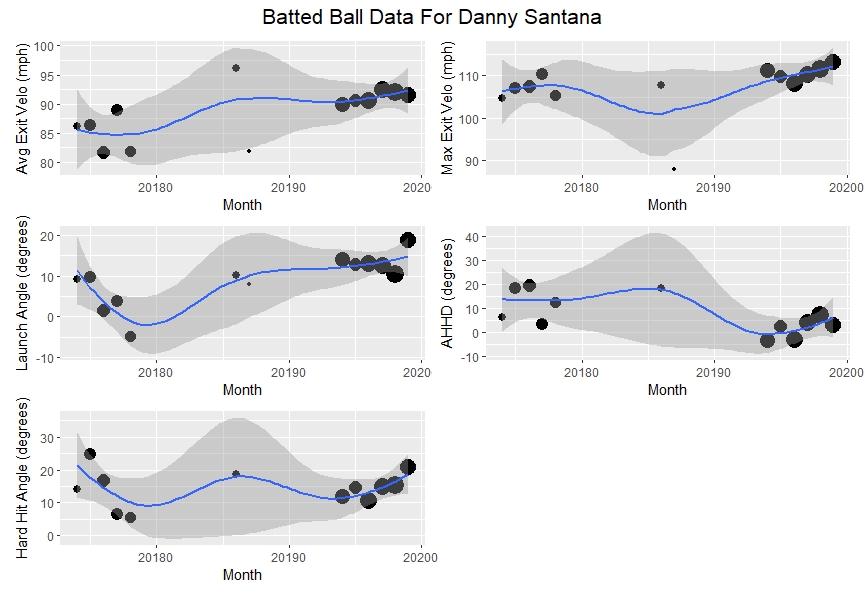
Santana experienced a breakout last season with easily his best results to date (28 HR, 21 SB, .283 AVG), but it could have been just a career season for the 29-year-old? He pulled all the stops to become a productive hitter. He raised his average launch angle to merge with his hard-hit angle. These two shrunk he Hard Hit difference into an ideal 0 degrees difference.
Additionally, his Max Exit Velo took a small step up to boost his results. When the Max Velo change combined with the improved launch angle, his Average Exit velocity soared.
He did everything an owner is looking for in a breakout. The question becomes, can he maintain the changes? I believe Santana will get every chance to repeat. He’s the type of hitter real-life teams hope to find on the scrap heap and Texas is no different. They see the changes. If he gets any love from the team, they may believe the changes (the have the Spring Training StatCast data) have stuck and it may be time to buy-in.
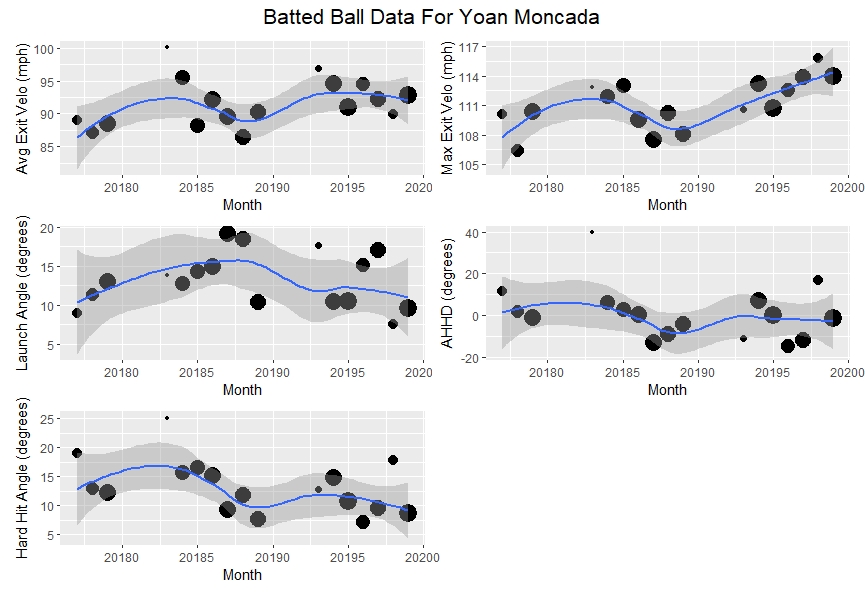
I asked for recommendations for these evaluations and David Phillips stepped up and requested Moncada. I couldn’t find any news of a swing change/adjustment but when a player’s OPS jumps 200 points (.714 to .915) an investigation is warranted.
Simply, the 24-year-old Moncada added power producing more hits that traveled further distances. His Average Exit Velocity went from 90.6 mph to 92.8 mph and his Max Exit Velocity from 113.1 mph to 115.8 mph.
Another change that happened during the 2018 season when he started to lower his launch and become more of a line-drive hitter. The results weren’t seen in his 2018 stats except for his GB% going from 36% to 40%.
It’s not an exciting answer but most times, it’s not.
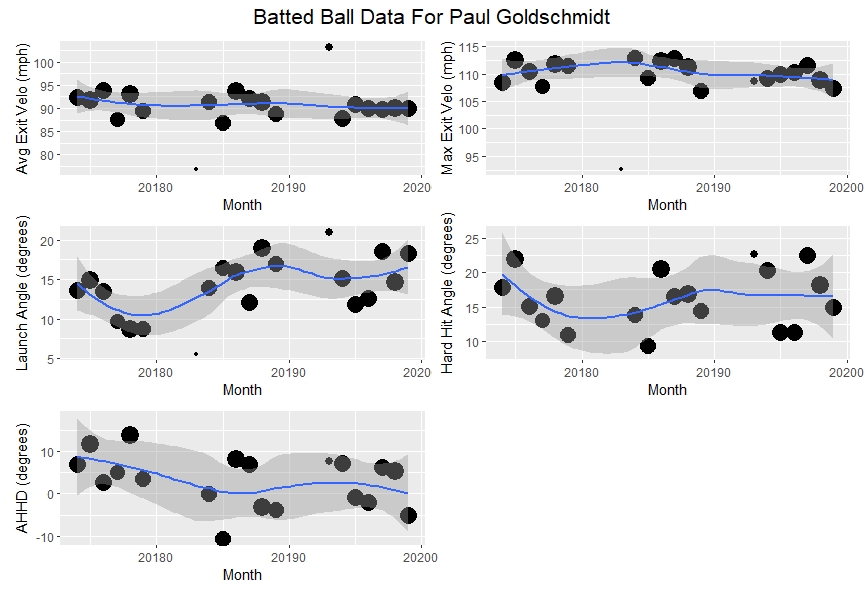
What a set of boring plots. While there were some launch angle changes in 2017, Goldschmidt’s approach has been steady over the past two seasons. So why when everyone else was seeing their power trend up from the juiced ball, his OPS dropped 100 points (.922 to .821)?
Two things. Teams quit fearing him with 29 intentional walks in 2015 dropping to just two last season. Also, his Zone% was up 1% point and First Strike rate up 5% points. He was no longer one of the most feared hitters in the league.
Also, he posted a career-low .302 BABIP. Will his BABIP bounce back near his career .348 mark or is this the end? Tough to tell.
The most likely answer is that the 32-year-old is on a steady decline. While the projection systems expect some regression towards his 2017 and 2018 seasons, I’m not. I’m just using a 2020 projection based on just his 2019 season.
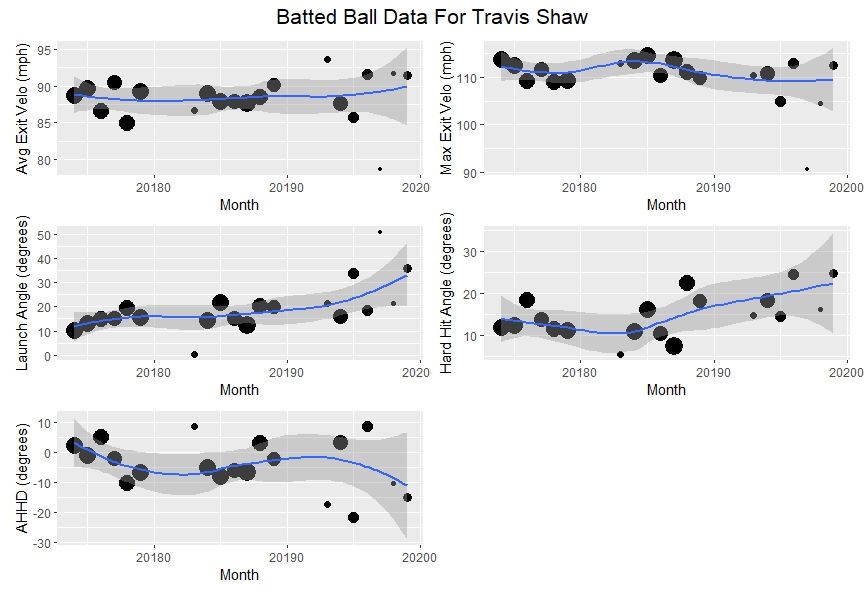
After investigating Shaw’s struggles, will force me to dive into the code and add another graph. I need to have a quick reference for Contact Rate for future analysis. Even though he had a 2019 swing change, the results were masked by his Contact% dropping from 81% to 71% pushing his strikeout rate up from 18% to 33%. The lack of contact can be seen from last season’s small sample sizes.
The advantage of the LOWESS curves can be utilized to help make some conclusions from Shaw’s erratic production. He raised his average launch angle almost 15 degrees that tanked his Hard Hit difference. He was trying to hit for more distance but put no oomph behind those flyballs. His HR/FB% dropped from 18% to 10%.
No contact + less power = minor league demotion. He hopes to fix his 2019 struggles and go back to his 2018 swing.
Jeff, one of the authors of the fantasy baseball guide,The Process, writes for RotoGraphs, The Hardball Times, Rotowire, Baseball America, and BaseballHQ. He has been nominated for two SABR Analytics Research Award for Contemporary Analysis and won it in 2013 in tandem with Bill Petti. He has won four FSWA Awards including on for his Mining the News series. He's won Tout Wars three times, LABR twice, and got his first NFBC Main Event win in 2021. Follow him on Twitter @jeffwzimmerman.
Jeff,
Good stuff! Based on the analysis, I’m guessing Moncada (in addition to being more agressive at the plate) leveled out his (golf) swing and that enabled him to make more solid contact – driving the ball with more authority while reducing the number of popups and dribblers. And, if he maintains his adjustments, his future looks bright. Is that about right? Thanks