Batted Ball Analysis: Marte, Bell, Davis, & Ramirez
Yesterday, I introduced Hard Hit Launch Angle (HHLA) and Average Hard Hit Difference (AHHD) after reading a report from Driveline Baseball. After working my way through much of the boring but necessary background information, I’m now going to dive into some players to help explain some of their changes in production. In several cases, nothing was obvious with previous stats, but the two new measures helped a ton to explain some changes. Here is an examination of four hitters who broke out or busted last season.
For the analysis, I’m debuting new comparison graphs. They are monthly StatCast data is plotted against:
- Average Launch Angle
- Average Exit Velocity
- Max Exit Velocity
- Hard Hit Launch Angle: The average launch angle for all batted balls hit over 98 mph.
- Average Hard Hit Difference: The difference between the HHLA and the angle for the sub-98 mph hits. From yesterday’s research, hitters start to see a production decline at a 0 AHHD and it accelerates around -4.4 AHHD. Basically, the batter is trying to get too much loft and his batted balls are going for weak flyouts.
I’m plotting the best-fit curves using the LOWESS (LOcally WEighted Scatter-plot Smoother) method. The curves use the nearest data points to create a best-fit line. Additionally, I’ve weighted the curve by the monthly batted balls. These values are represented by the dot size in each graph.
Two Up
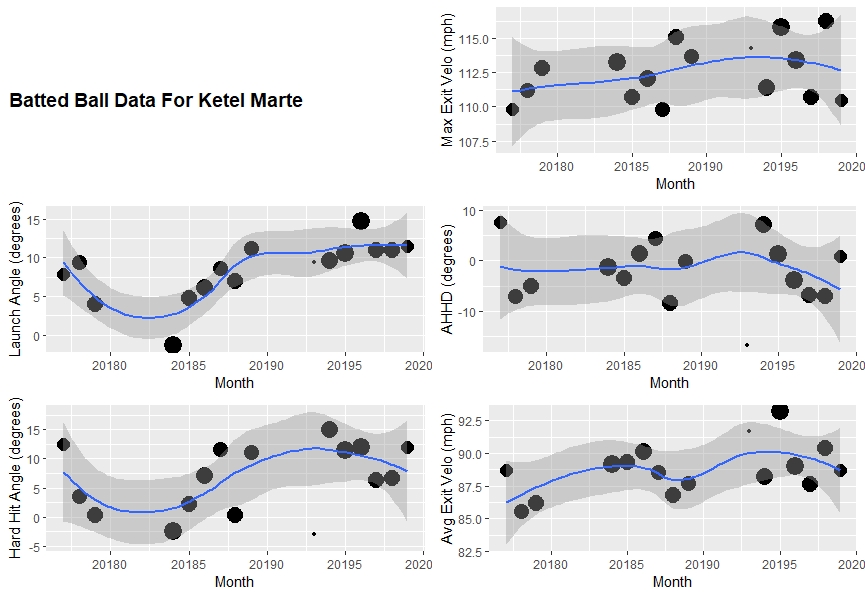
Marte was the epitome of a breakout after posting a .768 OPS in 2018 and it jumped to .981 last season. His results did improve in the second half of 2018 (.723 OPS to .841 OPS), but it was tough to buy into any change unless his batted ball data was examined.
He was raising his normal and Hard Hit LA by ~5 degrees as the season went on. The other key is that he was able to keep his AHHD near zero. He wasn’t creating a variance in his swing that other hitters encounter (see Josh Bell and Jose Ramírez). Additionally, he upped his Max velocity a bit. And for 2020, he kept all the changes … kind of.
In the last couple of months, his HHLA dropped along with his AHHD. The drop wasn’t spotted since he posted his best OPS of the season (1.183) in September. Overall, I believe in Marte’s breakout since there was a noticeable change behind it. The key for his next season, can he maintain the adjustments.
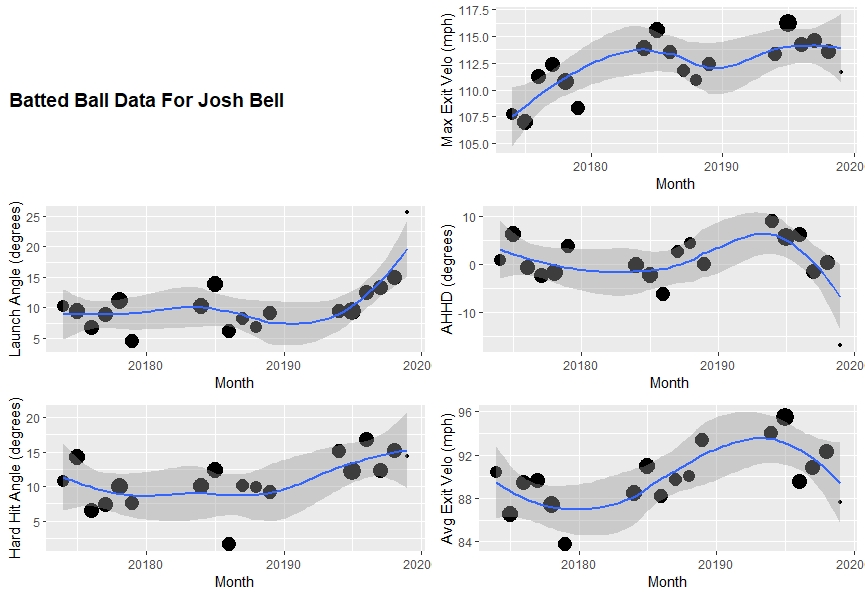
Josh Bell made a few adjustments to help propel him to a first-half breakout. Few indicators pointed to Bell’s 2018 breakout besides a jump in his walk rate (11.5% in the 1H to 16.3% in the 2H). His 2018 batted ball data was a mix of Max EV down and Average EV up. The other three stayed the same.
Then in 2019, everything started up especially the Hard Hit LA, regular LA, average EV. He rode the swing change to a first-half 1.024 OPS. And then he got a little greedy and kept trying to raise his overall launch angle but his Hard Hit LA stayed constant tanking his Hard Hit Difference. His batted ball profile became inefficient and his average EV tanked. For the second half, he posted a pedestrian .780 OPS. The hope is that first-half Bell returns but odds are long since he’s only done it once.
Two Down
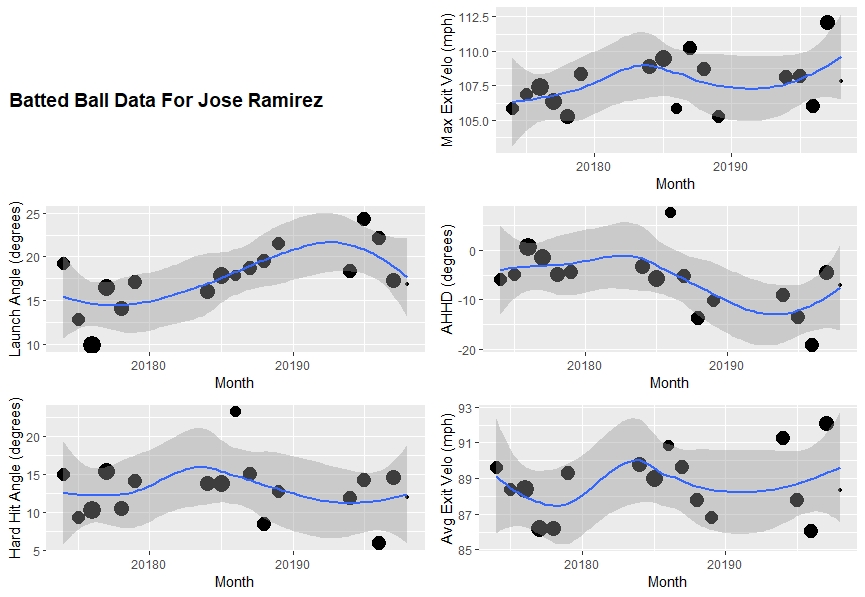
Even though Ramirez struggled a bit to end 2018 (.637 OPS in September), he was being drafted in the first round as a five-category contributor. His 2019 start was a continuation from the end of 2018 with .652 OPS in the first half.
He was trying to get more loft on the ball with a steady increasing launch angle from 15 degrees to ~22 degrees. His Hard Hit LA stayed the same, so he ended up hitting too many weak flyballs for outs. In the second half, he quit trying to just hit so many flyballs by leveling out his swing and he posted a 1.105 OPS in the second half.
I’m of the opinion that Ramirez will try to forget about the first of 2019 and hit as he had up until that disaster.
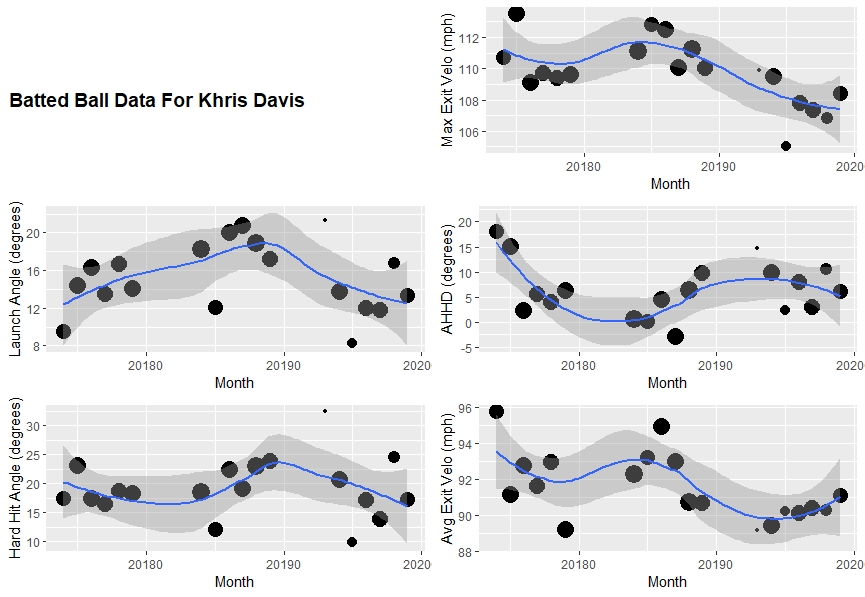
These charts aren’t just for detecting swing changes. They’re great for injuries. Mr .247 had easily been the most consistent hitter for several seasons. He started out 2019 just like any other hitting 10 home runs in March. After an early May hip injury, he only hit 13 home runs over the rest of the season.
Everything fell apart for him with both his exit velocities and launch angles tanking. While some hitters recover as the season goes on, Davis’s results just continue to worsen with sad .735 OPS in the first half and down to .605 in the second. His Exit Velocities never got close this 2017 and 2018 values. Davis’s owners are hoping that he gets healed and puts the 2019 season behind him.
Jeff, one of the authors of the fantasy baseball guide,The Process, writes for RotoGraphs, The Hardball Times, Rotowire, Baseball America, and BaseballHQ. He has been nominated for two SABR Analytics Research Award for Contemporary Analysis and won it in 2013 in tandem with Bill Petti. He has won four FSWA Awards including on for his Mining the News series. He's won Tout Wars three times, LABR twice, and got his first NFBC Main Event win in 2021. Follow him on Twitter @jeffwzimmerman.
I’m in a NL-only draft league with ten teams, so it’s very deep. We get six keepers each year. Bell is one of my possibilities but he scares the crap out of me.
The other option is Corey Seager. Or keep both of them and cut Luis Castillo.
All three seem like keepers in NL-only. that said, I’d go for Seager. He could bust out with TJS over.
Amazing. Any chance of creating a video on this topic? It deserves one.