Welcome back to the Ottoneu Starting Pitching Planner. Based on the Roster Resource Probables Grid, I’ve organized every starter slated to start next week into four categories: start, maybe, risky, and sit for Ottoneu points leagues. The first and last category are pretty self-explanatory. Starters who fall into the “maybe” category are guys you could start if you need to keep up with the innings pitched pace in points leagues or need to hit your games started cap in head-to-head leagues; they’re good bets to turn in a decent start, but you shouldn’t automatically insert them into your lineup. If you’ve fallen behind on the innings pitched pace or you’re really starving for starts in a head-to-head matchup, you could turn to a “risky” starter or two.
I’ve also calculated a “Matchup Score” for each series using a straight combination of opponent’s home/away wOBA, opponent wOBA over the last 14 days, and the park factor for the ballpark the teams are playing in. It’s indexed so that 100 is average and anything above that is a favorable matchup and anything below is unfavorable. That matchup rating informs some of the sit/start recommendations I’m making, though the quality of the pitcher definitely takes precedence. To start the season, I’ll be relying on projected team wOBA until there’s sufficient in-season data to start calculating these matchup ratings.
Trades are the lifeblood of fantasy baseball home leagues. The conversations around them help keep us connected and engaged, and make our league more fun.
Striking deals isn’t always easy. There are often hurt feelings around lopsided proposals, league-mates who value players differently, and that one guy who wants to veto everything. We can improve our fantasy squads with the waiver wire, but our collective hit rates are low. Quite often, those pickups backfire — a hitter’s cold streak or a pitcher’s blowup, which inevitably leads to dropping the player. The one facet we have control of in home leagues is trading.
Managers are often emotionally tied to certain players – specifically, missed draft targets or players from their favorite baseball team. Also, we’re not all great at zooming out to a long-term view and getting stuck in the moment. Good analysis can be washed away by recency bias and small sample sizes. No one can force us to make a deal, so it’s the one element of the game we have some control over and can use proper value assessment and negotiation techniques to our advantage.
This column will recommend hitters and pitchers to try selling high or buying low, and touch on trade strategies. No two leagues or two managers are the same. You know your league-mates best: what kind of deal they’ll scoff at, which player type they’re willing to deal for or acquire, and how good their player and market-valuation skills are. I’ll dig deep and present realistic opportunities.
SIERA and K-BB% to Spot Under- and Over-Performing SPs
ERA indicators or ERA estimators or peripherals — these are interchangeable terms for a set of Sabermetric statistics that fantasy baseball managers use to help predict future performance of pitchers. These ERA indicators (xERA, FIP, xFIP, SIERA) are not interchangeable since they include different inputs and have varying purposes. FIP excludes balls hit into play. xFIP utilizes the league average HR/FB%. SIERA incorporates a pitcher’s underlying skill level into the equation and adjusts for the type of balls in play. The SI stands for “Skills Interactive”, and you can learn more about SIERA in the original article here. SIERA is far from perfect, but many studies over the last 15 years have proven it to have a slightly higher correlation to ERA than the other indicators.
Over the years, I have utilized a simple formula (ERA minus SIERA) to identify pitchers who could be deemed “lucky”, with negative regression on the horizon, and vice versa — “unlucky” with a higher likelihood of positive regression. To further qualify the luck or lack thereof, I review BABIP and LOB% (left-on-base rate, or strand rate). In the context of fantasy baseball FAAB/waiver pickups or trades, I dig into pitchers’ year-to-date starts and look at their projected upcoming starts – both from a perspective of ballpark/environment and strength of opponent. Moreover, and most importantly, I am reviewing the most important metric of all, which is K-BB% (the difference between their strikeout rate and walk rate). Proficient at punching batters out, able to locate pitches and not walk a lot of guys? You’re probably going to have above-average results.
Before our sage readers bring out their pitchforks, note that I recognize there is a lot of nuance here and not everything can be overly simplified. Of course, a high or low BABIP is impacted by team defense, or if a pitcher generates weak or hard contact. Nevertheless, I assume a pitcher with four seasons of around a league-average BABIP (.290) who has a .365 BABIP through five starts is going to regress towards his career mean. The same for a pitcher with a 100% LOB% through five starts, regressing towards the league average of 70-75%.
The perfect example for this point in the season is the pitcher who has been the very best in baseball, Los Angeles Angels righty, José Soriano.
Through five starts, Soriano has a 0.28 ERA, 3.04 SIERA, 2.82 xFIP, 21.7 K-BB%, .149 BABIP, and a 100% LOB.
In his first two full seasons as a starter (2024-2025), those rates were: 3.93 ERA, 3.97 SIERA, 3.65 xFIP, 10.6 K-BB%, .291 BABIP, and a 69% LOB.
It wouldn’t be far-fetched to assume that Soriano will regress from a 0.28 ERA. In fact, it’s common sense. His BABIP and LOB will regress towards his league-average marks from 2024-2025, but likely both will still be well above league-average. We see that his 2024-2025 ERA, SIERA, and xFIP were similar (in the 3.65-4.00 range) and that his current indicators are closer to 3.00. If Soriano ends up with a 3.50 ERA this season, that means there’s some ERA damage to come (to be expected), but he will still end up being a massive provider of fantasy profit at his 250+ ADP. The question to ask ourselves in trade leagues: can we net a top-10 starting pitcher for Soriano in a “sell-high” scenario from a league-mate who only peruses box scores, doesn’t dive into advanced metrics or consider indicators?
Let’s take a look at the qualified starting pitchers with the highest (unluckiest) and lowest (luckiest) differentials between their ERA and SIERA. I use “unlucky” and “lucky” in quotations for these sorted leaderboards to simply denote these differentials noting that luck isn’t a metric.
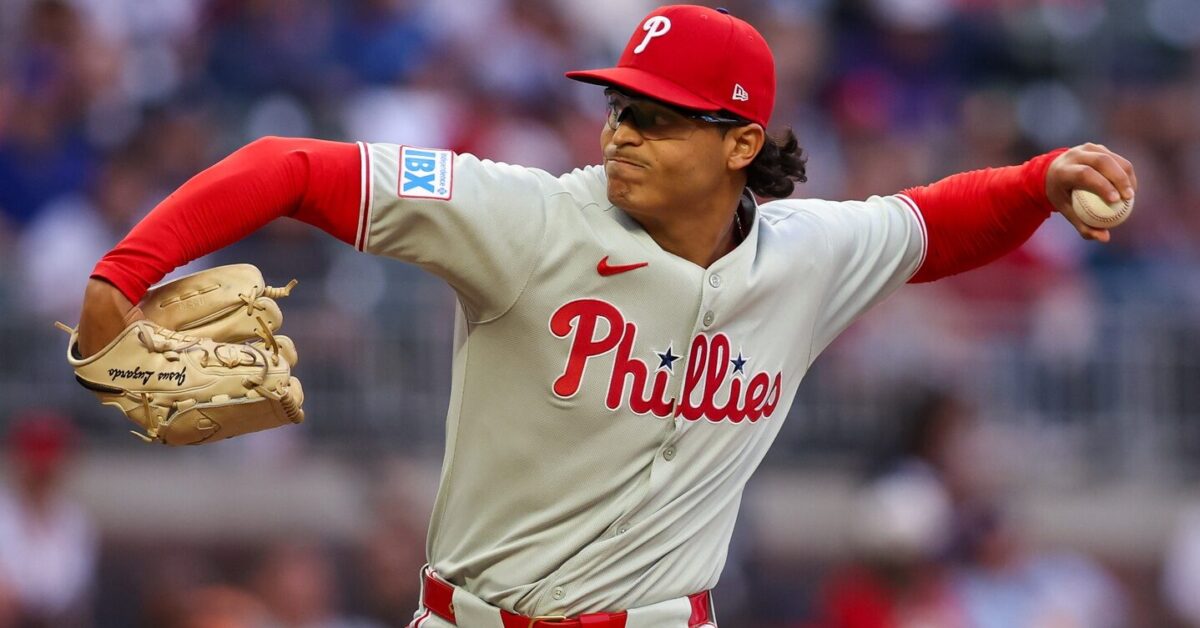
We knew the Jesús Luzardo Experience would be the ultimate roller coaster going into the season. Luzardo is a top-10 skills arm with extreme highs and lows. This is the guy who served up 20 earned runs in back-to-back starts in the week of the 2025 Memorial Day holiday, but allowed two runs or fewer in 50% (16/32) of his starts last season. Luzardo punched out seven or more batters in 18 of those 32 starts. So far in 2026, Luzardo has an exceptional 30:5 K:BB in 22 innings, an extremely high BABIP of .417 (career: .307), a super low LOB of 41.7% (career: 70%) and a massive difference between his ERA (7.94) and SIERA/xFIP (2.45/1.93). He is the ultimate “buy-low” target, though whether we strike a deal or not is based on mindset of the league-mate who currently rosters him. Are they metrics-saavy and have good fantasy common sense? If so, you probably won’t get a surefire advantage on a deal. Would I trade Soriano for Luzardo? It’s 10x more equitable than it was on March 15, but yes, yes I would, and I’d obnoxiously ask for a throw-in player “to make the deal fair.” (winky emoji)
There is no doubting the high level of concern someone who drafted Garrett Crochet in the first or second round of their draft might have. His implosion in Minnesota (10 ER in 1.2 IP) came out of the blue. Last Sunday, he cruised through four innings against the Tigers before getting torched for four runs on two singles and two homers, in the fifth. Crochet’s BABIP is high (.368) and LOB is low (55.6%), though not at extreme Luzardo levels. His fastball velocity is slightly down from last season (0.5 mph), as is his strikeout rate (-5.4%) and his swinging-strike rate (-3%). It doesn’t look awful under the hood, but because Crochet was drafted as a top-3 pitcher and these blowups are uncharacteristic of him, the trepidation in dealing for him is high.
Digging into FanGraphs player profiles on the rest of these players elicit a common theme in addition to the large ERA-SIERA differentials: above-average BABIPs, below-average LOBs, and, for the most part, a slight velocity decrease. In the case of Mike Burrows, his SwStr% is up from last season (12% to 12.7%) and his barrel rate is greatly reduced (10.8% to 5.7%). Burrows’ next three projected starts are against the Yankees (home), Red Sox (away), and Dodgers (home), so perhaps we weather the storm and pluck him off waivers in a few weeks when his schedule improves.
Yusei Kikuchi’s four-seam fastball velocity is slightly up from last season (94.8 mph to 95.4), but it’s an offering he continues to decrease because it typically gets crushed. He’s an example of a pitcher I typically avoid drafting and want nothing to do with. Streaming Jake Irvin (career 4.99 ERA) is always a case of playing with fire. He’s another pitcher I never want anything to do with.
David Peterson and Aaron Nola are on the downswings of their careers, but both have a high chance of improving their ERAs. Everything under the hood appears similar to last season. Logan Webb, Nathan Eovaldi, and Logan Gilbert are three arms I’d explore deals on.
Other than Soriano, the standout “lucky” pitcher worth shopping is Justin Wrobleski. The sample size is smaller than most on the list (24 IP: three starts, one 4-IP piggyback), but we can still confidently yell “negative regression” so long as our league-mates don’t hear it. Wrobleski has a 9.8% strikeout rate (9 Ks), a .205 BABIP and has yet to allow a home run. Wrobleski earns confidence points as a member of the Dodgers rotation, but will rarely earn two starts in a week because of they run a six-man, and he’s no lock to remain in it for the long-run with Blake Snell and River Ryan eventually joining it.
Seth Lugo has been masterful through five starts, but he’s the same guy he’s always been — 91-92 mph FB velo, 8-9% BB, sub-10% SwStr. The big difference this season is he has yet to allow a home run. Edward Cabrera hasn’t allowed a home run either, but there is little else in his profile to elicit confidence. Cabrera’s .286 BABIP is close to his career mark and to league-average, his strikeout rate is way down (25.8% to 18.7%), his 12.1% walk rate is closer to his career mark (11.7%) which may portend last season’s 8.3% as an outlier, and his Stuff+ ratings are down across the board. Cabrera’s next start is against the Phillies at home, this Thursday. I would not be looking to trade for E-Cab, though I would explore dealing him for a more durable pitcher with a higher health grade around his preseason ADP, like MacKenzie Gore or Robbie Ray.
Many others on this list aren’t particularly enticing from a name-brand, reputation or fantasy value perspective — Michael Wacha, Clay Holmes, Eduardo Rodriguez, and Bryce Elder fall under this category. Seeing Jack Flaherty’s 3.7 K-BB% induces agita, especially when noting the decline from 2024 (24%) and 2025 (18.9%). We can’t technically call it a decline yet since it’s only been five starts, but he’s another roller coaster guy who is tough to ride with. Last season, he served up at least four earned runs in 26% of his starts failed to reach the fifth inning in 28%. He somehow managed an 8-15 record on a playoff team that finished 12 games above .500.
There will always be outliers, but the holes poked into this process would be tiny pinholes. This process have assisted in my fantasy baseball endeavors for many years and I always strive to improve it and learn from experience and those around me. Reviewing ERA and SIERA differentials, BABIP and LOB rates relative to average, recent and future matchups, and of course strikeout-to-walk ratios are good first steps in assessing over/underperforming pitchers and their rest-of-season fantasy value.
From 2021 to 2025 among pitchers with at least 100 innings recorded, Stuff+ has a 0.708 correlation with strikeout rate. That’s quite significant. Although I don’t have the stabilization point of Stuff+, I have to imagine it becomes meaningful far more quickly than strikeout rate. Assuming that’s the case, it follows that monitoring Stuff+ changes is key to predicting future strikeout rate direction.
Welcome back to the Ottoneu Starting Pitching Planner. Based on the Roster Resource Probables Grid, I’ve organized every starter slated to start next week into four categories: start, maybe, risky, and sit for Ottoneu points leagues. The first and last category are pretty self-explanatory. Starters who fall into the “maybe” category are guys you could start if you need to keep up with the innings pitched pace in points leagues or need to hit your games started cap in head-to-head leagues; they’re good bets to turn in a decent start, but you shouldn’t automatically insert them into your lineup. If you’ve fallen behind on the innings pitched pace or you’re really starving for starts in a head-to-head matchup, you could turn to a “risky” starter or two.
I’ve also calculated a “Matchup Score” for each series using a straight combination of opponent’s home/away wOBA, opponent wOBA over the last 14 days, and the park factor for the ballpark the teams are playing in. It’s indexed so that 100 is average and anything above that is a favorable matchup and anything below is unfavorable. That matchup rating informs some of the sit/start recommendations I’m making, though the quality of the pitcher definitely takes precedence. To start the season, I’ll be relying on projected team wOBA until there’s sufficient in-season data to start calculating these matchup ratings.
Note: The two-game SDP-ARI series on April 25–26 will be played in Mexico City at Estadio Alfredo Harp Helú. The park factors for this stadium are off the charts — it’s at a higher elevation than Coors Field without the enormous outfield dimensions of that ballpark. Start your Padres and Diamondbacks SPs at your own risk.
Andrew Dolphin – USA TODAY NETWORK via Imagn Images
Happy Friday, and happy Pitcher Playing Time Changes day! I skipped last week because there wasn’t a whole lot going on with playing time changes yet, but unfortunately for the UCLs of Cade Horton and Zach Eflin, that’s not the case this week. Here are the most significant swings in projected playing time:
Significant Projected Playing Time Changes, SP, 4/3 to 4/10
Welcome back to the Ottoneu Starting Pitching Planner. Based on the Roster Resource Probables Grid, I’ve organized every starter slated to start next week into four categories: start, maybe, risky, and sit for Ottoneu points leagues. The first and last category are pretty self-explanatory. Starters who fall into the “maybe” category are guys you could start if you need to keep up with the innings pitched pace in points leagues or need to hit your games started cap in head-to-head leagues; they’re good bets to turn in a decent start, but you shouldn’t automatically insert them into your lineup. If you’ve fallen behind on the innings pitched pace or you’re really starving for starts in a head-to-head matchup, you could turn to a “risky” starter or two.
I’ve also calculated a “Matchup Score” for each series using a straight combination of opponent’s home/away wOBA, opponent wOBA over the last 14 days, and the park factor for the ballpark the teams are playing in. It’s indexed so that 100 is average and anything above that is a favorable matchup and anything below is unfavorable. That matchup rating informs some of the sit/start recommendations I’m making, though the quality of the pitcher definitely takes precedence. To start the season, I’ll be relying on projected team wOBA until there’s sufficient in-season data to start calculating these matchup ratings.
The 2026 fantasy baseball season is still in its infancy, and in the grand scheme of things, we don’t really know what to expect over the next ~six months. Established studs will disappoint, new fantasy heroes will emerge, and performances will undulate to the point of causing madness. The unpredictability is why we have so much fun playing and analyzing this game of ours.
With that being said, trends are starting to set in and there are a few players that I am believing in more and more as the sample sizes continue to grow and the data becomes clearer. In this article, I’ll be highlighting five pitchers who have shown signs of breaking out that I believe will be sustainable throughout the 2026 season.
There will undoubtedly be some ups and downs, but I believe these arms are worth picking up/trading for before they become the established studs that I think they’ll develop into.
Since the majority of stats remain in small sample size territory, especially for starting pitchers who may have only made one start so far, I like to dig into the underlying metrics that could ultimately drive a change in results. One of those drivers is pitcher fastball velocity. We know that velocity is highly correlated with strikeout rate and ERA, so all else being equal, higher fastball velocity should result in a higher strikeout rate and lower ERA. Of course, each individual pitcher start is a small sample, so you’re not always going to see the increased strikeout rate or lower ERA immediately, or vice versa. That’s why it’s prudent to track velocity changes early on to better predict where a pitcher’s strikeout rate and ERA may be headed.
Welcome back to the Ottoneu Starting Pitching Planner. Based on the Roster Resource Probables Grid, I’ve organized every starter slated to start next week into four categories: start, maybe, risky, and sit for Ottoneu points leagues. The first and last category are pretty self-explanatory. Starters who fall into the “maybe” category are guys you could start if you need to keep up with the innings pitched pace in points leagues or need to hit your games started cap in head-to-head leagues; they’re good bets to turn in a decent start, but you shouldn’t automatically insert them into your lineup. If you’ve fallen behind on the innings pitched pace or you’re really starving for starts in a head-to-head matchup, you could turn to a “risky” starter or two.
I’ve also calculated a “Matchup Score” for each series using a straight combination of opponent’s home/away wOBA, opponent wOBA over the last 14 days, and the park factor for the ballpark the teams are playing in. It’s indexed so that 100 is average and anything above that is a favorable matchup and anything below is unfavorable. That matchup rating informs some of the sit/start recommendations I’m making, though the quality of the pitcher definitely takes precedence. To start the season, I’ll be relying on projected team wOBA until there’s sufficient in-season data to start calculating these matchup ratings.