Archive for Roto

Nicklaus Gaut’s 2023 RP Rankings

From the shared draft boards of Twitter to the unruly outlaws in the Reddit commentsphere, closers seem to have gone scorched earth on the fantasy baseball landscape, turning us all into post-apocalyptic warriors fighting over a precious and disappearing resource. Saves remain concentrated at one end of the closer spectrum but are increasingly diffused amongst the rest of the population. All the while, the ADP tide rises. Chaos.

Cars on fire, people wandering the streets making nonsensical declarations like, “At that point, I felt like I just had to take Jose Leclerc at pick #92”, or “If Kyle Finnegan just takes another step forward, he’ll be a steal at pick #175”; Justin Mason was just spotted wandering the halls of FanGraphs with his head down, muttering over and over that he’s “totally fine with Doval and Lopez as my top-two, it’ll be okay…totally fine…totally fine, tot-…”. Read the rest of this entry »


Recipe: Thinning The Herd With K/9, SwStr%, and pVals – Part 2

Last week I detailed my late-round starting pitcher recipe, “Thinning the Herd”. I wrote about the first six pitchers on this list and this week I’ll continue with the bottom six. As a reminder, here’s my ingredients list:

  • A SwStr% in 2022 of at least 11%. (2022 MLB SP average – 10.7%)
  • A K/9 projection (steamer) of eight or better. (2022 MLB SP average – 8.18)
  • Positive pVals (Pitch Info) on at least two pitches in 2022.
  • An ADP greater than 100.

Read the rest of this entry »


Recipe: Thinning The Herd With K/9, SwStr%, and pVals – Part 1

Sticky metrics refer to statistics that are highly correlated from year to year. Here’s an example. Among all qualified pitchers in 2022, Jordan Montgomery ranked 11th with a 12.9% swinging strike rate (SwStr%). Bringing the innings-pitched threshold down to 150 in 2021, he ranked ninth with a career-high 13.7%:

Jordan Montgomery's SwStr%

In every season except 2018, he’s had an above-average SwStr%. Projections don’t predict SwStr%, but if they did you could imagine that Montgomery would easily be projected above 12%.

Read the rest of this entry »


Nicklaus Gaut’s 2023 Outfielder Ranks

We’ve now covered my ranks at catcher, first base, second base, third base, and shortstop, before making a stop in Splitsville last week. Let’s close our hitters out – time to hit that grass.

It’s not that the outfielders are shallow by talent but depending on your league and roster size, eventually, you’ll reach a cliff past which full-time players are few and far between. Full and part platoons start wreaking havoc on projecting final production, and while some part-timers will still end up with enough playing time to be fantasy-viable, trying to properly judge their value from week to week may be a fantasy headache some managers just may not want. Read the rest of this entry »


Somedays You Have It And Somedays You Don’t: Robbie Ray’s Slider

Troy Taormina-USA TODAY Sports

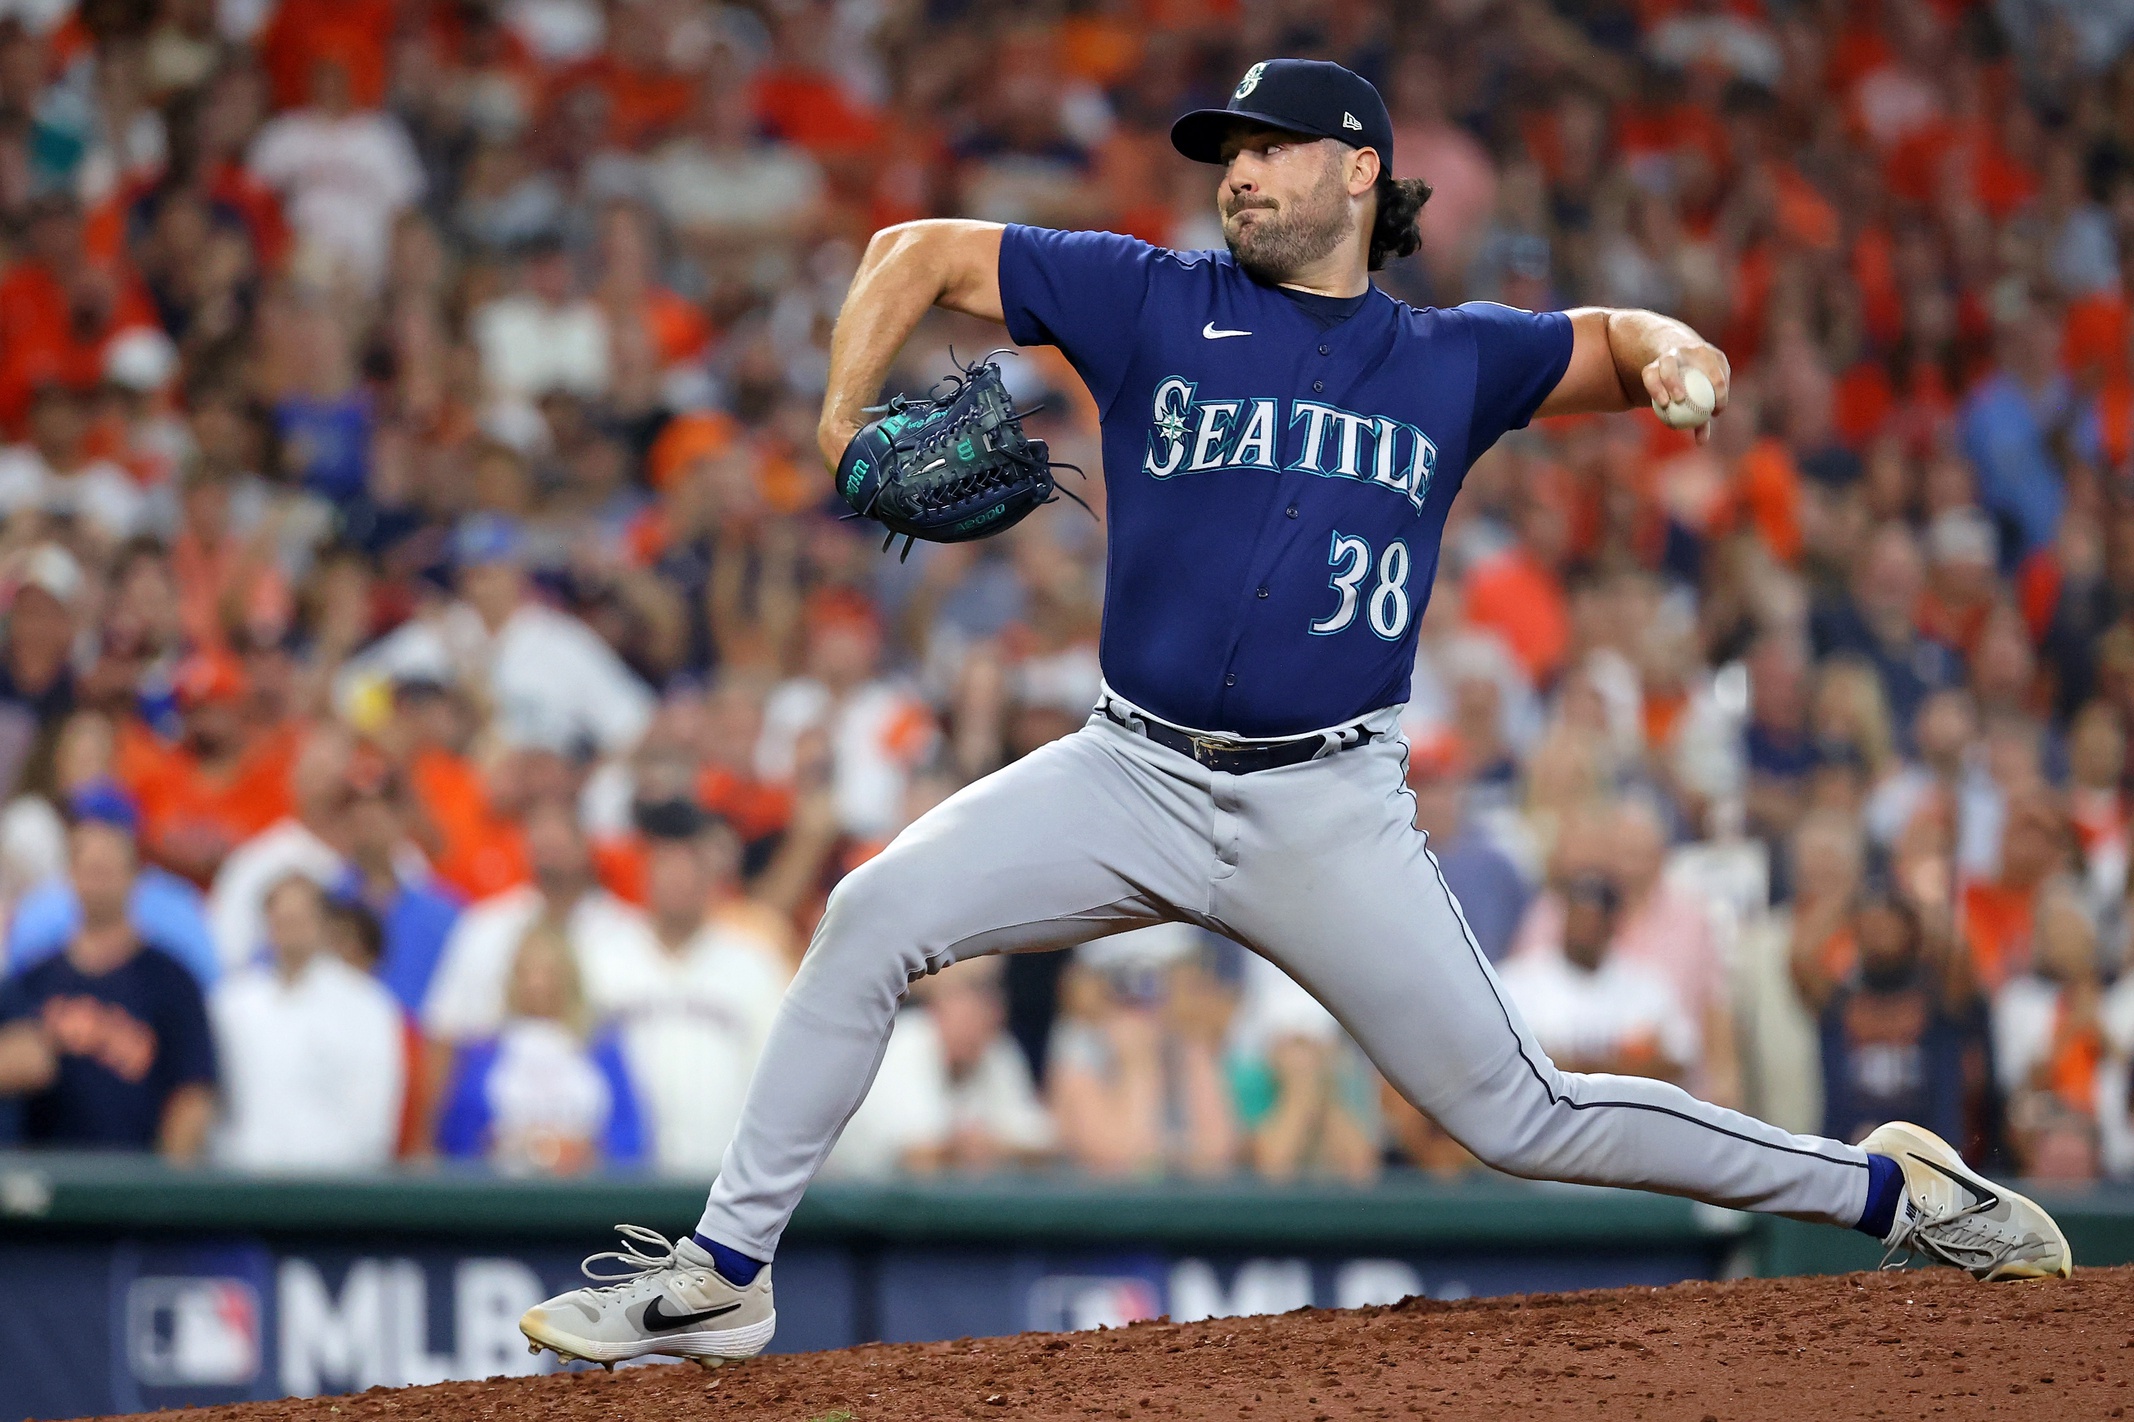
It has always been difficult for me to understand pitcher volatility. Well, the volatility part isn’t hard to understand, actually, it’s very simple. Pitching in the big leagues is incredibly difficult and one tiny little element of a pitcher’s game could be off to make the whole outing unravel. But, what is hard to understand is what little element that is. Did a 1 mph drop on a four-seamer really make it all go south? Or, was it a matter of half an inch of location? Is it even measurable? Like, what if it was just bad gas from the previous night’s chimichanga that threw things off? Do you see where I’m going? I want to know why a pitcher does so well one day and so poorly the next. For my first round of this, I’ll start slow and focus on only one pitch, narrowing the question down to, why does one pitch perform well one day and bad the next? In today’s investigation, I’ll analyze and compare Robbie Ray’s July 3rd 2.6 wSL Pval (Pitch Info) with his July 24th -3.4 wSL pVal. Let’s have some fun.
Read the rest of this entry »


Imagine Thinking Hitter Splits Matter

Wendell Cruz-USA TODAY Sports

Wait a tick – this can’t be right. We’ve been trucking right along with our positional reviews, taking a twisted path around the horn, going from catcher, to first base, third base, shortstop, and second base, most recently. Clearly, it’s time for the outfielders, yeah?

Afraid not, mon freres. Heading into the positional review for outfielders, I already knew we’d be forced to dip into a ton of platoon talk, as swapping players in and out according to pitcher handedness continues to be a plague across the fantasy baseball landscape.

This pestilence seems most pervasive in the outfield, in regard to our fantasy teams, with the fear that this player, or that one, will suddenly be sitting versus this hand, or that one, leaving us to find another full-time option or scrambling on the wire from week to week to find someone to swap in for your boy because he’s facing a lefty in four of six games. Or, being forced to throw someone else back to the wire because they’re apparently only facing lefties now. Super annoying. Read the rest of this entry »


Nicklaus Gaut’s 2023 Second Base Ranks

The New Year cometh (cameth?) and now so too does our last rankings stop on the infield. We’ve now seen in hindsight just how good we had it at catcher and first base, as shortstop is deep but gets shallow fast, and third base is mostly a pit of danger after the first eight guys, or so. Well, bad news, chuckles – second base is no picnic; unless you like yours with bears and half-eaten Jean Segura’s. Read the rest of this entry »


HR/FB Increases to Believe In

If a player hits the ball in the air often with power, it should go out for a home run often, right? Sure, certain ballparks, weather, and environmental conditions will add unpredictability to that statement, but we can generally follow the guideline of “hit ball hard in air, ball go far”. The first step to hitting the ball far would be to get the ball up in the air more often. This is nothing new. While a hitter can, and has, done damage with hard hit line drives (Juan Yepez, 2022) and even hard hit ground balls (Chris Taylor, 2022), in the air is better.

Take a look:

2022 MLB wOBA on Hard Hit…

  • ground balls .377
  • line drives .633
  • fly balls .867

That cute wee stanza shouldn’t excite readers too much, clearly, it doesn’t even necessitate the clean look of a FanGraphs table to hold it up. But, if a hitter puts the ball in the air, it doesn’t mean he will automatically do damage. If we take away the Hard Hit part of the splits above, it’s clear how important the Hard Hit aspect is:

2022 MLB wOBA on…

  • ground balls .215
  • line drives .685
  • fly balls .354

As we prepare for drafts, it may be worth our while to look at players who have started to both put the ball in the air more and hit those fly balls out more often. That combination is key. While that combination does contribute to increased home run totals, it may also lead to increased strikeouts. A single season’s K% and HR/FB% don’t necessarily have strong correlations, but when we break down HR/FB into percentile groups and aggregate K%, we see some pattern:
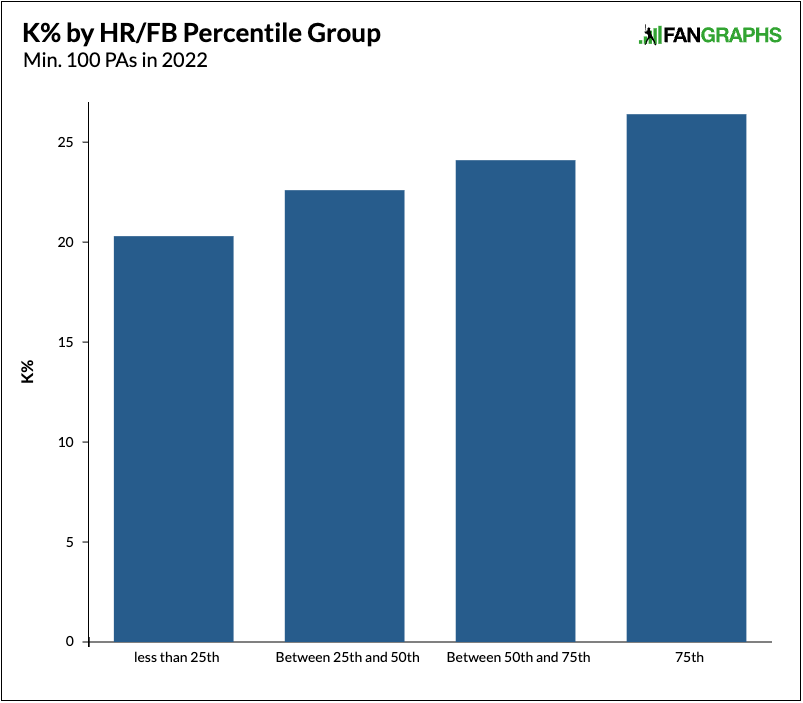
Bar Chart (K% by HR/FB Percentile, 2022)

The bar chart above simply points out that targeting hitters with high FB and HR/FB rates could make you draft a player like Keston Hiura (2022: K% 41.7%, HR/FB 29.8%). But, even with a .226 batting average he did hit 14 home runs in only 266 plate appearances last year. While there are many more than five players who qualify under this analysis, I’ve cherry-picked the five I find most intriguing. If you want to see all the players who I’m analyzing you can merge hitters who accumulated at least 100 PAs in both 2021 and 2022 and make comparisons between their fly ball rates and their home run per fly ball rates. There were 354 hitters total who accumulated 100 PAs in both 2021 and 2022, but 75 of them increased their FB% and their HR/FB% from year to year. Here are five that I am particularly interested in:

Cherry-Picked HR/FB Gainers 2021-2022
Name GB/FB 21 GB/FB 22 FB% 21 FB% 22 FB% Diff HR/FB 21 HR/FB 22 HR/FB Diff
Jazz Chisholm Jr. 1.6 0.9 31.0 40.8 9.8 18.2 23.3 5.1
Gleyber Torres 1.2 0.8 36.2 45.9 9.7 6.9 13.1 6.2
Luis Arraez 1.6 1.3 28.0 32.9 4.9 1.9 4.8 2.9
Rowdy Tellez 1.1 0.9 38.2 45.5 7.3 12.4 18.7 6.3
Anthony Santander 0.8 0.6 43.4 49.8 6.4 13.4 14.5 1.1
Among hitters with at least 100 PAs in both 2021 and 2022.

Jazz Chisholm Jr.
When I went to see how Jazz’s back was recovering, I found that he also had knee surgery? I’m not sure how I missed that but regardless, he’s penciled in as ready for Spring Training. One of the biggest knocks on young prospect Chisholm was his high K% which remains high, yet decreased in each of his three major league seasons:

30.6% (20) –> 28.6% (21) –> 27.4% (22)

While his K% has been going down, xwOBA, SLG, Barrel%, HardHit%, and launch angle increased. He is a pull-power hitter, so I wouldn’t expect him to keep dropping his K%. In fact, with a full season it may increase closer to his career by 28.4%, but if it comes with the steamer projected 28 home runs and 26 stolen bases, I personally would be willing to bump him up a few spots on my rankings.

Gleyber Torres
Is he really only 26 years old? Does he really have back-to-back stolen base double-digit seasons? He’s projected to be a 20(hr)-10(sb) player, Paul Sporer gave a hot take on his power for 2023, and he’s putting the ball in the air more often. What made his power dip so much in 2020/2021? It’s hard to say. But he did clearly start hitting the fastball again from a Pitch Info Pitch Value perspective:

-3.1 (20) –> -9.5 (21) –> 8.8 (22)

Those numbers are backed by Baseball Savant’s Run Value on the 4-seamer. Do you want a really quick glance theory? I think in 2020 and 2021 he tried to change who he is and he tried to get on base more often by swinging less. In 2022, he swung more often, and struck out more often, but hit the ball harder with a higher launch angle.

Luis Arraez
A few weeks ago I wrote about Arraez’s pull power, or, lack there of. While the contact-king isn’t likely to hit 20 home runs, he could add a lot of value if he were to first, sell out just a little more and second, hit the ball harder. Their is no doubt in my mind that Arraez has the batted ball skills to change his approach slightly. The real question is does he have the skills to add more power?

Rowdy Tellez
Some fantasy managers seem to be pretty high on Tellez this offseason and it makes sense. Like most of the players that hit fly balls with power, they strike out a lot too. But, Tellez’s ~20% K% the past two seasons isn’t all that bad. His batting average, however, is. A sultry .219 in 2022 should regress closer to his career average of .236, but steamer has it doing even better in 2023 at .247. But, it’s not average you’re after here, it’s power and steamer thinks that will increase as well. Rowdy finished 2022 with a slugging average of .461 and steamer pegs him at .485 for 2023. However, steamer also projects his home run totals to come back down from 35 in 2022 to 30 in 2023.

Anthony Santander
A healthy Santander is a good Santander. His 647 PA’s in 2022 marked a career high. Let’s go down the list of good things that happened for the O’s outfielder in 2022:
– Increased BB% (…and a better OBP because of it)
– Decreased K%
– Increased slugging
– Career-high home runs (33)
– Increased launch angle and barrel rate
All of those gains coincided with a slight increase, though a career high, fly ball rate. Steamer believes in the skills as well, projecting him for 30 dingers next year.

Bonus Round:

I intended to write about these two players before I saw an excellent, full-blown analysis on both in Nicklaus Gaut’s 2023 sleeper article. Both Cal Raleigh and Anthony Rizzo could be great power targets in 2023, Rizzo being more of a sleeper than Raleigh. Here are some quick notes on both players but I encourage you to read Gaut’s piece as well:

Rizzo
A change of approach to take advantage of Yankee Stadium’s short porch?
– 2023 tied career high homeruns (32) but he’s hit that exact mark (32) in four separate seasons.
– OBP is down, SLG is up
– pulling the ball more
– higher launch angles
– hitting it harder
– striking out more

Raleigh
– A young catcher with great power
– Max EV of 114!..and a launch angle above 20
– High, high K%, but could be improved on
– Projected for 521 (FGDC) PA’s in 2023


Nicklaus Gaut’s 2023 Shortstop Ranks

We’ve covered the slow foots at catcher and first base while seeing how cold the hot corner has gone. Let’s now speed things up and move over to shortstop, which is sneakily shallow. Just not in the way you’re thinking.

Read the rest of this entry »


To Be Twenty-Four: Taking Advantage of More Opportunities and Striking Out Less

Kiyoshi Mio-USA TODAY Sports

You need a little holiday gift for yourself, don’t you? Sure, you’ve probably received your copy of the Forecaster by now and you still have that racy romance novel to finish, but you should add a little more baseball analytics to your que. Go ahead, buy yourself a copy of FanGraphs’ own Mike Podhorzer’s Projecting X 2.0. I recently did and was not one bit disappointed. Many fantasy baseball touts refer to their “projections” often. You’ll hear pundit A say they are working on their projections and pundit B say their projections are vastly different than others, but it’s not always clear what that work entails or how they got those very different projections. Projecting X gives readers a better understanding of how projections should be created and empowers them to take on the task themselves. Regardless of who’s cooking your dinner, it’s always important to know the ingredients.

When writing about K% projections, Podhorzer sites his own research and some of Jeff Zimmerman’s research to identity three plate discipline metrics that help evaluators assess changes in hitter K%. Those three metrics are Z-Swing%, Contact%, and Zone%. Taking it one step further, Zimmerman’s age-curve research showed that hitter K% typically declines through age 24. Podhorzer’s e-book motivated me to take a look at these three metrics among young hitters from the past two seasons. Here are the hitters who accumulated at least 75 plate appearances in both 2021 and 2022 and finished 2022 as a 24-year-old:

2022 Age 24 Players (Min. 75 PA’s)
Name 21 PA 22 PA Zone%_Diff Contact%_Diff Z-Swing%_Diff K%_Diff
Taylor Trammell 178 117 -0.3 8.0 4.0 -13.9
Jesús Sánchez 251 343 -2.6 0.2 -4.2 -4.3
Andrew Vaughn 469 555 0.6 2.8 -1.2 -4.2
Lars Nootbaar 124 347 -2.8 0.9 -2.9 -2.1
Gavin Lux 381 471 -2.6 -0.1 -7.2 -1.6
William Contreras 185 376 -1.5 0.7 -8.0 -1.5
Luis Robert Jr. 296 401 -4.2 1.7 -1.7 -1.4
Jazz Chisholm Jr. 507 241 0.9 -2.7 2.1 -1.2
Brandon Marsh 260 461 -1.4 4.0 2.8 -0.7
Ronald Acuña Jr. 360 533 -0.6 2.3 6.5 0.0
Alex Kirilloff 231 156 -0.4 6.6 -2.3 0.6
Bo Bichette 690 697 1.4 -0.3 -0.3 2.3
*Min 75 PA’s for both 2021 and 2022
**Plate discipline diff metrics calculated as 2022 metrics – 2021 metrics
***K% diff calculated as (2022 K% – 2021 K%) * -1

If you look at how I’ve calculated these year-to-year differences you’ll see that I’ve made it so the numbers make sense from a positive/negative standpoint. In this case, Luis Robert saw the ball in the zone less often (-4.2%) and made contact more often (1.7%), but swung in the zone less often (-1.7%) while lowering his K% (-1.4%). Scanning the rows will show you that nine out of 12 players “did what they were supposed to do” and lowered their K% in their 24-year-old season.

While we see a few established, elite players listed in the table above, there are certainly a few intriguing players from a sleeper standpoint as well. Taylor Trammell lowered his 2021 K% of 42.1% down to 28.2% in 2022. While 28.2% is still significantly over the 2022 MLB average of 22.4%, it’s an improvement. It’s nice to see the likes of Jazz Chisholm Jr. and Brandon Marsh on this list and it’s also important to remember that some of these players were ONLY 24 for most of the 2022 season! If we kick it into experimental mode and drop the PA threshold down to 20 in each season, we see a few more interesting players:

2022 Age 24 Players (Min. 20 PA’s)
Name 21 PA 22 PA Zone%_Diff Contact%_Diff Z-Swing%_Diff K%_Diff
Jake McCarthy 70 354 2.4 12.5 3.7 -11.4
Vidal Bruján 26 162 -5.5 -0.3 6.8 -8.0
Yonny Hernandez 166 28 7.8 1.8 1.4 -5.0
Mickey Moniak 37 112 -5.9 2.8 3.8 -3.9
Estevan Florial 25 35 7.7 -10.8 1.4 13.1
Jose Barrero 56 174 1.6 -3.1 2.7 13.3
*Min 20 PA’s for both 2021 and 2022
**Plate discipline diff metrics calculated as 2022 metrics – 2021 metrics
***K% diff calculated as (2022 K% – 2021 K%) * -1

I rostered Bruján in a few deep leagues and was tremendously disappointed, but he’s a young player who is still developing. Yes, he dropped his K% between 2021 and 2022, but like Trammell, he finished 2022 with a K% that still needs to come down (22.8%). Use caution when seeing those decreases in young players and be sure you don’t just assume they’ve figured it out. Hopefully, these two tables give you threads to pull on, rankings to adjust and perhaps, a little itch that can only be scratched with learning how to project player performance on your own. When the 2023 winter cold winds blow, download a copy of Podhorzer’s book and find yourself little gems like this to occupy your off-season hours.