Ottoneu: Lucas’ Keep or Cut Decisions at OF

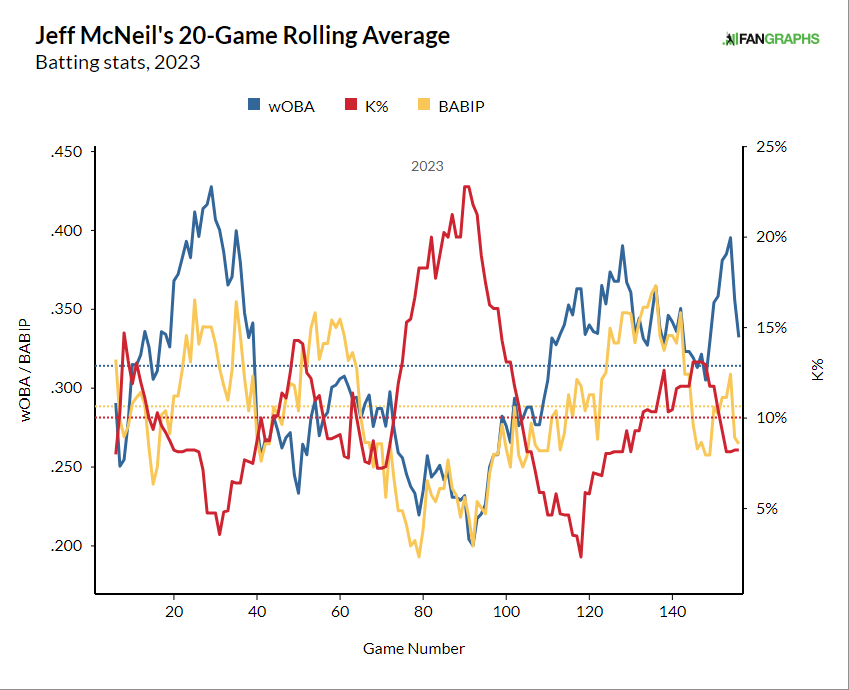
Right now, if I wanted to find a free-agent outfielder to add to my team in any of my Ottoneu FanGraphs points leagues, the best I could find is an injured 5.24 points per game (P/G) Andrew McCutchen. After that, playing time gets tricky. Yes, I placed a 30-game filter on my search query, but playing time is always hard to find, always. I see there’s a 4.38 P/G Richie Palacios and a 4.36 P/G DJ Stewart. There’s even a 4.35 P/G Jeff McNeil available. No matter how much tweaking and clicking and scrolling I may do, I still won’t be able to find a replacement better than right around 4.3 P/G. It’s the offseason, I can’t add anyone to my roster from free agency, but it’s a good exercise nonetheless. I previously went into further detail about my process for finding a points-per-game replacement level for each offensive position and in this post, I’ll use the 4.33 P/G replacement level I calculated to make keep or cut decisions on four outfielders.
–
Hunter Goodman, 1B/OF
Salary: $3
Average Salary: $4.74
2023 P/G: 2.76
Proj 2024 P/G: 4.83
In 2022, Goodman rose through three levels of the Rockies minor league system (A, A+, AA) and hit 36 total home runs. In 2023, he started at AA, hit 25 bombs, moved on to AAA, hit another nine, and finally made his major league debut on August 27th. In his debut, he recorded two hits and went 13 for 43 in his first 13 games. That prompted me to write about him in an August 30th, Ottoneu Hot Right Now after which I added him to one of my rosters for $3. The power is tantalizing.
While that .302 batting average to start his major league career grabbed people’s attention, he finished the season going 1 for 27 bringing his scouting report of having a questionable hit tool back to the forefront. All said and done, Goodman’s MLB slash line in 77 plate appearances did not impress:
2023: .200/.247/.386
2024: .254/.308/.483 (PROJ)
But, his projection makes me hopeful. Still, projections for players with only 77 plate appearances can be challenging to buy in on, but for $3, why not? He very well could hit 20 home runs and in a format like FanGraphs points leagues, having a player with a home run and slugging upside even when it is at the detriment of batting average can be ok. As of now, RosterResource has him penciled in as the player in right field batting eighth and that’s good enough for me at $3.
Keep or Cut?
Keep and hope the Rockies don’t Rockie his playing time.
–
Wilyer Abreu, OF
Average Salary: $4.29
Salary: $3.00
2023 P/G: 4.45
Proj 2024 P/G: 4.55
Anytime a player’s AAA slash line looks like Abreu’s did (.274/.391/.538) in a big chunk of plate appearances (363), I’m intrigued. 2023’s AAA BB% (16.3%) and K% (20.4%) looked better than his major league numbers (BB%: 10.6%, K%: 27.1%), but that’s to be expected for a young, 24-year-old, player. His 4.45 P/G mark looked good as a starting point, but his 6.18 P/GS looked even better, as was pointed out by Chad Young’s great article, Finding Ottoneu Bats using P/GS vs. P/G.
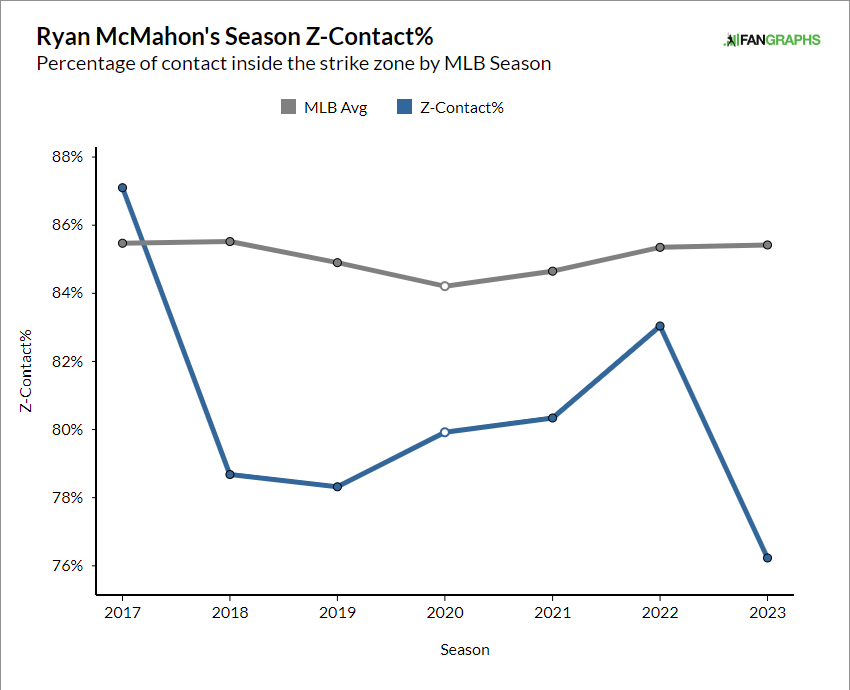
Abreu can hit the ball hard and with efficiency. He posted an above-average Barrel% and HardHit% (Statcast) in his small sample of major league games. While his .316 batting average is surely inflated by a .431 BABIP, and his 77.4% Z-Contact% rate was well below average (85.4%), he isn’t swinging out of the zone (O-Swing%) too much, as his 27.1% is better than the MLB average of 31.9%.
Will he be platooned? Maybe. Yes, according to RosterResource. The left-handed hitter batted .333 vs. righties and only .200 against lefties, but being the batter who platoons against right-handed pitching is better than the opposite. That brings his 452 projected plate appearances (Steamer) into question, but for $3, it’s worth the wait-and-see.
Keep or Cut?
Keep!
–
Jose Siri, OF
Average Salary: $4.30
Salary: $3.00
2023 P/G: 4.42
Proj 2024 P/G: 3.95
Jose Siri strikes out a lot. Like, a lot, a lot. His 35.7% was the highest among all players who amassed at least 350 plate appearances in 2023. However, he nearly slugged .500 (.494) and he hit 25 home runs. How much do you typically have to pay for that type of slugging and home run hitting? Here are some (hand-selected) comparable players and their 2023 stats/salaries, focusing only on plate appearances, slugging, and home runs:
Brandon Belt – PA: 404, SLG: .490, HR: 19, Avg. Salary: $3.63
Triston Casas – PA: 502, SLG: .490, HR: 24, Avg. Salary: $9.10
Christian Walker – PA: 661, SLG: .497, HR: 33, Avg. Salary: $9.15
Brandon Drury – PA: 523, SLG: .497, HR: 26, Avg. Salary: $7.15
Each of these players betters Siri’s 364 plate appearances, and they each are hitting above .250, unlike Siri, but consider the price difference and Siri seems like a great player to have on your roster. The biggest problem with this logic is Siri’s 2024 projection. Steamer has him for 463 plate appearances and slugging, a regressed, .411. He just doesn’t have a long enough track record to not regress his slugging percentage. His Steamer projection brings him into cut territory as he is projected to be below my P/G replacement mark. In an early July assessment of Siri’s sustainability, Leo Morgenstern wrote a great article with an even greater title, Back Off Alexa, Jose Siri Is on a Rampage, and after reading it I believe more in Steamer’s projection. Ok, ok, so what is his full projection?:
Steamer 2024: .221/.276/.411, 33.8% K%, 19 HR
Keep or Cut?
Keep. You may notice a pattern with me. I keep a lot. But $3 for 19 home runs seems like a good deal and I’ll stick with it to see what happens.
–
Colton Cowser, OF
Average Salary: $4.62
Salary: $7.00
2023 P/G: 7.51
Proj 2024 P/G: 4.35
Let’s start here. $7.00 is too much for a player with very little path to playing time. As of now, Cowser has been left off the projected RosterResource big league squad. If Cowser gets traded away from Baltimore, and makes it onto an opening day roster in 2024, is $7.00 still too much? Probably so. His latest update to his prospect TLDR is not promising:
Prospects TLDR: Cowser is not a great fit in CF and has shown more swing and miss at upper levels than is ideal for a corner outfielder. He looks more like a platoon option than a true everyday mainstay.
He didn’t necessarily showcase an affinity for hitting against one type of handedness, going .143 vs. lefties and .111 vs. righties in 77 total plate appearances. But, the truth is, 77 major league plate appearances just isn’t enough playing time. Cowser showcased serious power in AAA in 2023. He slashed:
.300/.417/.520
and hit 17 home runs. There is still serious potential for Cowser, but he’ll need playing time to work through his struggles against major-league pitching. He struggled against the fastball, recording negative run value (PitchInfo) on both four-seamers (wFA) and cutters (wFC) and his zone contact rate (Z-Contact%) was below average (Cowser: 83.9%, MLB Average: 85.4%). There is work to be done and the only way to do the work is to get MLB plate appearances. There is certainly something to be said for keeping a player who has outgrown AAA, but hasn’t yet found his groove in the big leagues, but the price would have to be at or below the average $4 for me to do so.
Keep or Cut?
Cut and try to re-draft for a lower price.