Archive for Hitters

Batted Ball Analysis: Goldy, Shaw, Moncada, & Santana

Earlier this week, I examined the batted data on four hitters and I’m diving into four more today. My goal is to see if their breakout or struggles stemmed from normal aging or swing or approach change. Sometimes the change is obvious and other times, it’s murky.

Currently, I’m using five StatCast data points per month:

  • Average Launch Angle
  • Average Exit Velocity
  • Max Exit Velocity
  • Hard Hit Launch Angle: The average launch angle for all batted balls hit over 98 mph.
  • Average Hard Hit Difference: The difference between the HHLA and the angle for the sub-98 mph hits. From yesterday’s research, hitters start to see a production decline at a 0 AHHD and it accelerates around -4.4 AHHD. Basically, the batter is trying to get too much loft and his batted balls are going for weak flyouts.

I’m plotting the best-fit curves using the LOWESS (LOcally WEighted Scatter-plot Smoother) method. The curves use the nearest data points to create a best-fit line. Additionally, I’ve weighted the curve by the monthly batted balls. These values are represented by the dot size in each graph.
Read the rest of this entry »

Batted Ball Analysis: Marte, Bell, Davis, & Ramirez

Yesterday, I introduced Hard Hit Launch Angle (HHLA) and Average Hard Hit Difference (AHHD) after reading a report from Driveline Baseball. After working my way through much of the boring but necessary background information, I’m now going to dive into some players to help explain some of their changes in production. In several cases, nothing was obvious with previous stats, but the two new measures helped a ton to explain some changes. Here is an examination of four hitters who broke out or busted last season.

For the analysis, I’m debuting new comparison graphs. They are monthly StatCast data is plotted against:

  • Average Launch Angle
  • Average Exit Velocity
  • Max Exit Velocity
  • Hard Hit Launch Angle: The average launch angle for all batted balls hit over 98 mph.
  • Average Hard Hit Difference: The difference between the HHLA and the angle for the sub-98 mph hits. From yesterday’s research, hitters start to see a production decline at a 0 AHHD and it accelerates around -4.4 AHHD. Basically, the batter is trying to get too much loft and his batted balls are going for weak flyouts.

I’m plotting the best-fit curves using the LOWESS (LOcally WEighted Scatter-plot Smoother) method. The curves use the nearest data points to create a best-fit line. Additionally, I’ve weighted the curve by the monthly batted balls. These values are represented by the dot size in each graph.

Read the rest of this entry »


A Batter’s Hard Hit Angle: Introduction

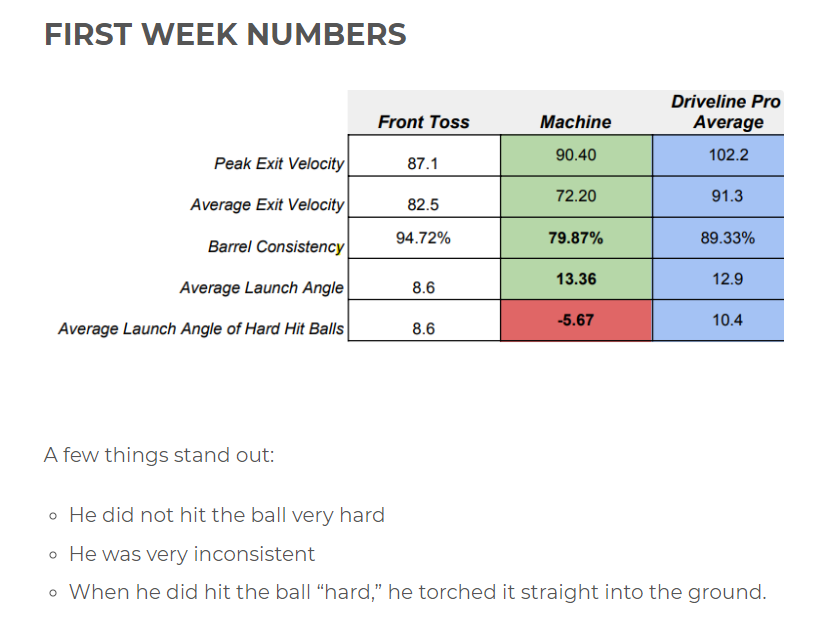
I had no idea who Dylan Moser was. In all respects to Dylan and his family, I still don’t. When I saw an article about him come through my feed, I was interested in how Tanner Stokey described Driveline Baseball’s evaluation of Moser. While Driveline has its own advocates and critics, it pushes the research bounds so I wanted to see what they considered important about Mr. Moser. Immediately, I saw this little nugget.

The “Average Hit Angle of Hard Hit Balls” caught my eye and I’ve been investigating its implications ever since.

Determining and finding the effectiveness of a hitter’s launch angle spread has been investigated several times in the past. Andrew Perpetua pointed out the importance of High Line Drives (a close cousin to Barrels) and how too much of an uppercut can hurt a player’s production. Alex Chamberlain and Brock Hammit both found a link between the standard deviation in launch angle and increased production.
Read the rest of this entry »


Potential National League DHs

With all the potential setups we’re seeing for 2020 baseball, it seems like most would benefit from having a designated hitter included for the National League. If that does come to fruition, a group of hitters will see value upticks just by virtue of getting extra playing time, but they will also benefit from not having to play defense. Let’s go west to east with our NL DH candidates for each team:

ARIZONA DIAMONDBACKS

Kevin Cron, Jake Lamb | Cron and Lamb are a righty-lefty combo that could straight up platoon as Arizona’s DH in this scenario. Cron didn’t do much in a tiny sample last year, but he did pop 6 HR and boast a .310 ISO in the 78 PA of work. Lamb is now three years removed from his 30 HR/105 RBI season, but I still think the 29-year old has big power when healthy (he just hasn’t been close to healthy since ’17). Seth Beer is the prototypical DH, but he’s not on the 40-man so I went with Cron & Lamb instead.

Read the rest of this entry »


Comparing Pitcher-Hitter Split For Various ADPs

After working my way through the first eight rounds of the website ADP draft,  some sites leaned heavy pitcher while others were drafting just hitters. Before continuing the draft, I wanted to determine the split difference for each website. The difference wasn’t as big as I thought considering the results seen to this point in the draft.

Just for reference, I used the ADP data collected at FantasyPros from ESPN, Yahoo, NFBC, CBS, FanTrax, and Real Time Sports (RTS). Next, I assumed people were drafting a 12-team league with 23 players (14 hitters, 9 pitchers) which works out to 276 players. Then, I gave each player an auction dollar amount based on their ADP. Finally, I divided them into two groups and added up their auction dollars. Here are the results
Read the rest of this entry »


Prospect Scouting & Stats — Hitter Spd – Present

As continue our look at scouting grades and stats, let’s now move along to hitter speed, represented by the Spd grade. Although there is also a Future grade, we’re not going to bother with it, as only four of 420 prospects earned a higher Future grade than Present. So all our analysis will be based on the Spd – Present (SP) grades. We’ll start by looking at correlations and grade distribution.

Read the rest of this entry »


Prospect Scouting & Stats — Hitter Hit Tool – Future

Yesterday, I listed and discussed the top 12 prospects in the Hit – Present (HP) grade. Today, let’s look toward the future, as we’ll take a gander at the top 14 in the Hit – Future (HF) grade. Since there are a whopping 42 prospects slapped with a 60 grade HF, I’m going to only include those with an FV of at least 55 in that HF tier. If the prospect also appeared on yesterday’s board, I won’t discuss him again.

Read the rest of this entry »


Prospect Scouting & Stats — Hitter Hit Tool – Present

Yesterday, I analyzed the hitter hit tool grades and their correlations with various hitter skill rates and results. Now let’s take a look at the leaders in the Hit – Present (HP) grade. Below are the top 12 in HP.

Read the rest of this entry »


Prospect Scouting & Stats — Hitter Hit Tool

For the last week and a half, I have looked at prospect scouting power grades and stats. Today, we move along to prospect scouting hit tool grades. While power grades are pretty clearly meant to forecast a prospect’s Major League ISO and/or HR/FB rates, it’s not entirely obvious to me what a Hit grade is meant to tell us.

Is it indicative of underlying skills relating to hitting ability, such as walk/strikeout rates, along with BABIP, or is it more of the ultimate result of those skills, such as batting average and/or on base percentage? From perusing through Kiley McDaniel’s old articles back in 2014 explaining the scouting grades, it seems like OBP is the intent, but I’m not 100% sure. Either way, let’s dive into the correlations between the present and future hit grades with the various underlying hitting talent skills and results.

Read the rest of this entry »


Prospect Scouting & Stats — Hitter Raw Power – Future

Today I finish our look at the hitter power grade leaderboards, ending with raw power in the future (RPF). Let’s identify and discuss the 26 hitters with an RPF grade of at least 70. As usual, I will only discuss those missing from previous leaderboards.

Read the rest of this entry »