Archive for Stolen Bases

The Sleeper and the Bust Episode: 1020 – Need for Speed ft. Jenny Butler

2/27/22

The latest episode of “The Sleeper and the Bust” is live. Support the show by subscribing to our Patreon!!

Follow us on Twitter

Watch the Replay!

Join a TGFBI Satellite League!

Read the rest of this entry »


Checking in on the Rabbits

If I were to look into the rear-view mirror while riding in the back seat of an Uber and ask the driver, “Could you tell me the expected time of arrival, minus the current time please?”, I would probably get some weird looks. But, if I were to ask you, fantasy baseball enthusiast, for your team’s current stolen base total, plus your rest of season (RoS) projected stolen base count, you would probably be delighted. It would give you a good sense of where your team is and where your team is heading.

Read the rest of this entry »


Where Speed Goes in Drafts

One of the biggest discussions around any draft gameplan is where to get your speed. Sure, you could try to ignore them, but I never want to go into a draft punting a category and leagues with an overall component like the NFBC’s Main Event and Online Championship make it so you can’t punt a category if you want a realistic shot at the overall grand prize.

To secure high end stolen bases, you really need to map out your draft and figure out exactly where they go. This piece aims to help with that by using The BAT X’s projection system along with the NFBC ADP. Teams needs around 120 SBs to be in the upper crust (I used the top 20% of Main Event leagues from 2019) and while the number is dropping yearly, it is a safe target to set for your drafts. It’s about 9 SBs per roster spots in the standard 14-player setup (2 C, 1B/3B/CI, 2B/SS/MI, 5 OF, UT) and there are only 87 players in The BAT X projected to reach that mark.

Of course when you draft someone with 20 SBs, they bring the average needed down, but it’s still alarming that not even 100 guys hit the average we need for every spot to reach our general target. Let’s see how everything breaks down:

THE KING

Wondering why Adalberto Mondesi is going so high? Here is your reason. His 52 projected SBs are 1.5x that of the next best guy (Turner, 35) which is why so many are willing to take on his AVG downside with a top 25 pick. He crept into the first round during at least one Main Event this past week, going 14th overall.

Read the rest of this entry »
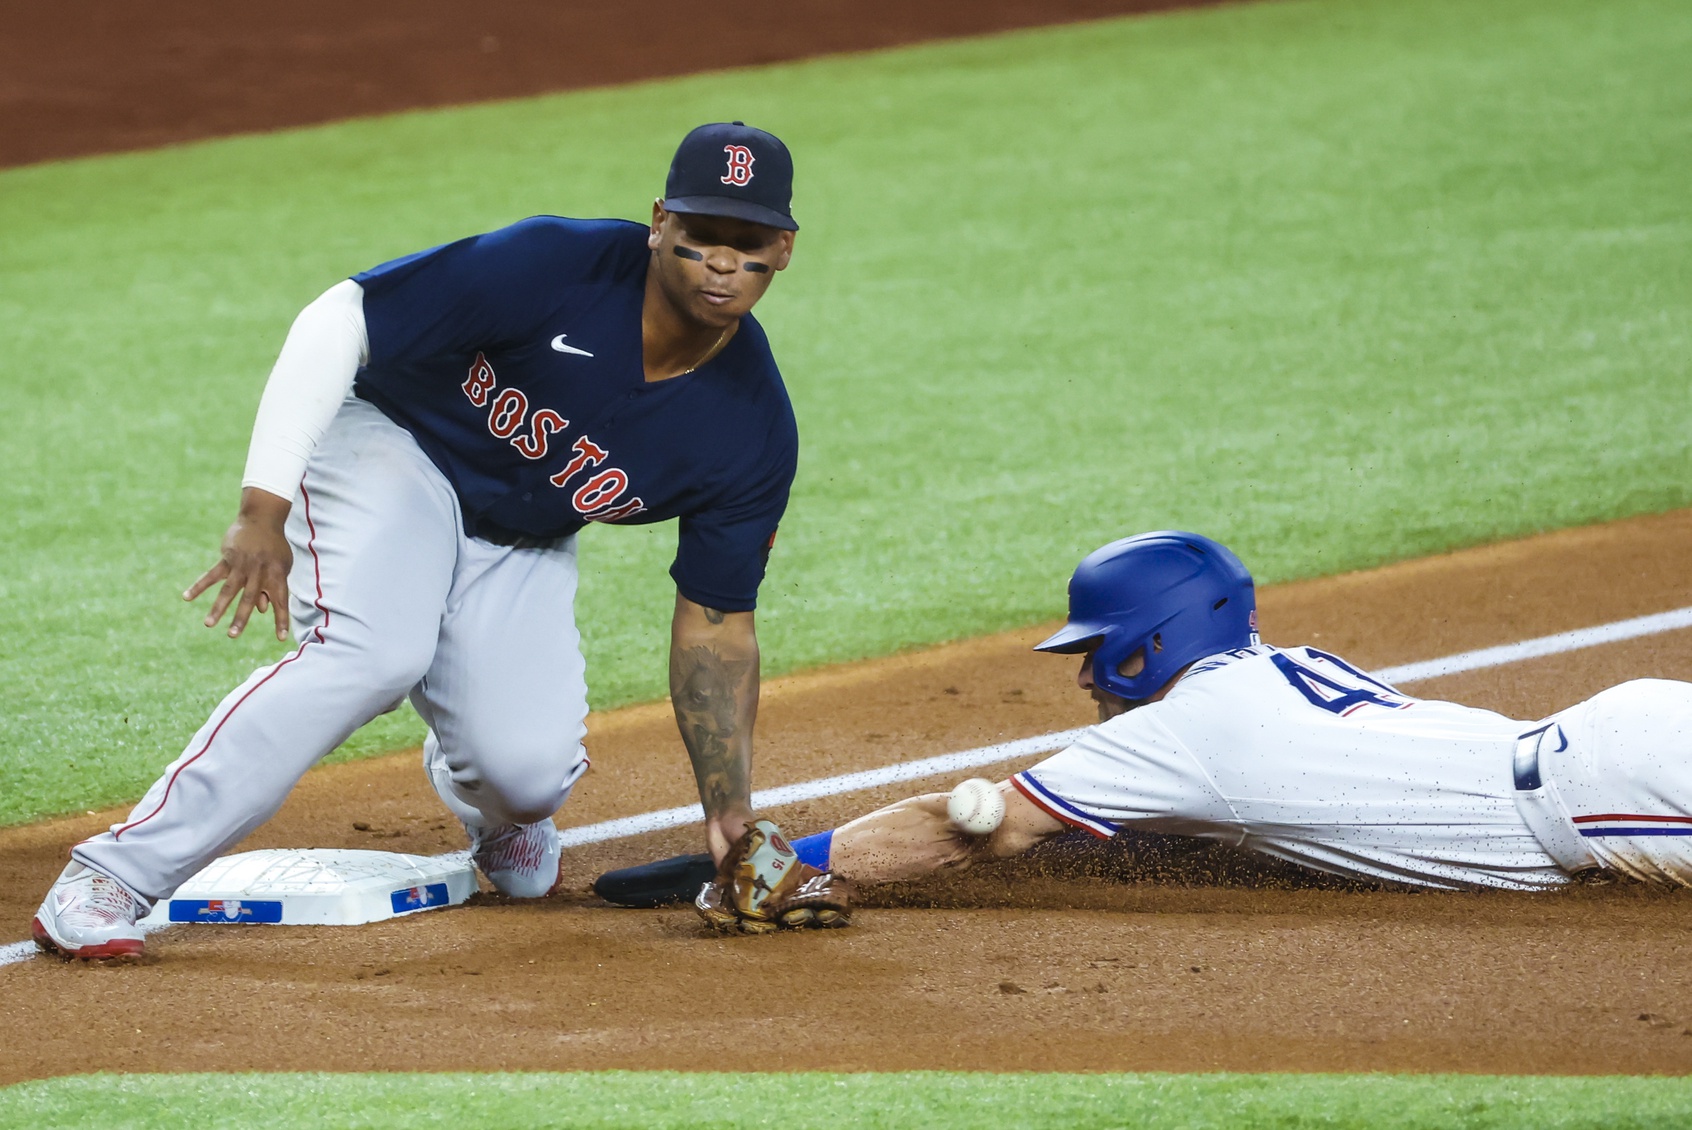

Tommy Edman’s Failed SB Attempts

Tommy Edman is fast.

Like, really fast.

He has been 97th and 95th percentile in Sprint Speed over his two MLB seasons. In that time, he has posted a healthy 77% SB success rate with 17 SBs in 22 attempts. But that rate took a big hit in 2020 as he was just 2-for-6 in the shortened season (15-for-16 in 2019). Before you hit the comments letting me know that Sprint Speed isn’t as well correlated to SBs as home-to-first time, I will point out that Edman did slip there from 4.12 to 4.20, but that’s still firmly a plus runner per Jeff’s chart in the linked article.

I found it so weird that such a speedy guy with sharp base running acumen (84% SB% in MiLB) had such a dreadful rate so I had to investigate the four times he was caught to see what happened. I do wonder how much of his 2020 numbers is holding down his SB projections for 2021 as virtually all systems have him with a teens total despite an obvious role and gobs of speed. So let’s see what happened.

Read the rest of this entry »


Bad Hitters With an Early ADP

In 2019, I participated in AL LABR and struggled to stay out of the cellar. Coming out of the auction, I thought I would accumulate too many stolen bases but could trade one of Mallex Smith or Dee Strange-Gordon. I ran into the simple problem, they played themselves out of their jobs. From that point forward, I told myself “I will no longer rely on sh##ty baseball players”. Talent declines during a draft, but I don’t want a core piece of any team demoted to the bench or the minors. I’m going to examine a few hitters drafted in the first 10 rounds and fall into this playing time trap.

Looking back at Smith and Gordon, I should have had an inkling that they’d disappoint. Going into the season, Steamer projected Smith for a .695 OPS and Gordon for a .664. For the 2020 edition of The Process (after the fact research), I researched the production level needed to keep a hitter in a lineup. Depending on the player’s defensive ability and position, the average production level that gets a hitter demoted is between .600 OPS and .650 OPS with the average being around .635 OPS. The following chart shows the chances a player’s in-season OPS may drop to knowing their projected OPS.
Read the rest of this entry »


Does Tony La Russa Hate Stolen Bases?

Hate is a strong term, but I already broke the ice last season with “Does Mike Matheny Hate Stolen Bases?”. I’m here to put some facts behind any narratives about Tony La Russa’s stolen base philosophy now that he’s the White Sox manager. The Sox have three (Luis Robert, Nick Madrigal, and Tim Anderson) of the 28 players projected for 17 or more steals this season, so La Russa’s philosophy could have a major impact. With stolen bases becoming scarcer, the following is a stab to determine the White Sox’s baserunning plan.

First, I needed to find an ideal time frame since La Russa started managing in 1979. The game has changed over those years, so I used the last ten seasons (2002 to 2011) of him managing the Cardinals. I would have liked to use a smaller date range, but the resulting player sample was too small.
Read the rest of this entry »


2020 LABR Mixed Auction Recap Part II

The following is the second part of my 2020 LABR Mixed Auction recap. You can read Part I of my recap here. This was the inaugural season of the new LABR Mixed Auction league, and my very first expert auction league.

In my Tout Wars recap series, I talked about how to adjust projections for a particular league format, the proper hitter/pitcher splits to use, and how to create a market pricing curve. I also discussed at length about how to scout your opponents, and to use it to your advantage.

In Part I of my LABR recap, I talked about how to create an initial plan, and how to set an auction budget.

Today’s article will focus on a topic that is barely discussed in the fantasy community. However, I believe it to be a large key in managing your auctions, and crucial in the quest to accumulate the most fantasy value at the draft table. I am referring to player nominations.

Tactics is to know what to do when there is something to do and strategy is to know what to do when there is nothing to do”. – Gary Kasparov

If fantasy baseball drafts are akin to a game of checkers, auctions are in many ways a multi-player game of chess.

Read the rest of this entry »


Are Early Round Steals Safe?

I got a simple request for a study, are good players (i.e early draft picks) more reliable for steals than worse hitters (picked later in drafts). Through my work with The Process, I’ve found around a .650 OPS to be the production level where players start heading to the bench/minors/waiver wire. The person remained persistent and asked for an expanded look so here it is.

One of the first items to understand is that any comparison of recent projected versus the actual stolen bases will be negative. From 2010 to 2019 (extent of my historic projections), stolen bases are down from 2959 to 2280 or a drop of 23%. And for this analysis, we are concentrating just on high stolen base guys. Here are the players projected for 20+ steals and those that reached that number in the past ten seasons.

Number of Hitters Projected For and Reached 20 Stolen Bases
Season Projected Actual
2010 46 35
2011 35 50
2012 38 48
2013 18 40
2014 28 39
2015 22 30
2016 19 28
2017 20 29
2018 19 28
2019 19 21

The number of hitters projected for 20+ steals has been cut in half over the time frame. In a fifteen team league, a team is going to get one, maybe two hitters projected for and actually reaching 20 steals. So when aiming for steals, which players should be targeted?
Read the rest of this entry »


Managers on the Run: Baker, Girardi, Maddon, & Kapler

Early this offseason, I determined that Mike Matheny doesn’t hate stolen bases, but could be a boost to the Royals stolen bases. At the time, I noted to check on Joe Maddon’s tendencies but never got to it. Then, my podcast mate, Rob Silver, basically begged me to run the same analysis for Dusty Baker. After that, one of my other team owners brought up Joe Girardi and Gabe Kapler. I was done talking to people before every manager needs to be analyzed on their stolen base tendencies. The following are the numbers on the four and the results were a little surprising.

To examine the managers’ tendencies, I compared how the baserunner’s tendencies changed with or without the manager in question. There were three groups of hitters to examine

  1. The hitters who were on the manager’s team and then on a different one that same season.
  2. Hitters who were on a different team the season before or after a season on the manager’s team.
  3. The hitters who were on the manager’s team the season before or after his tenure started and ended.

Also, I combined all the values for an overall rate.

Read the rest of this entry »


Should I Care About Sprint Speed?

Sprint Speed values have been publicly available for a few seasons. While I see it mentioned for this or that, I don’t know how predictive it is or if should I care about it at all. After analyzing the data, Sprint Speed might need to be ignored in favor of Time-to-First. The stopwatch still rules.

The key, in my opinion, is if the ability to run fast can be predictive in any way. No one that I know of is playing in a Sprint Score league, so the speed with have a secondary effect. If a player is running slower, do their stolen bases drop? How about how many infield hits they can leg out? Generally, how will the players change in speed affect their stolen bases and batting average.

One factor to keep in mind is that the aging curve for stolen bases is just a drop with all humans reaching their peak sprinting speed in their early 20’s.  There are going to be a lot of negative speed values coming up but that’s just aging pulling players down.

A second factor to remember is that teams are not allowing hitters to run as much. In 2015, there were over 2500 stolen bases league-wide. Last season, the value was under 2300 for a 9% decline. Again, more negative numbers.

Sprint Speed was first introduced in 2015 at Baseball Savant (links to Time-to-First values) and it is widely cited. Sprint Speed is not the only measured speed metric available. For one fewer season, Baseball Savant has each hitter’s run times to first base which have been the traditional measure of a player’s speed and it’s still used in scouting players. With the two metrics, it’s table time to what conclusions can be drawn.

Read the rest of this entry »