
Are Early Round Steals Safe?
I got a simple request for a study, are good players (i.e early draft picks) more reliable for steals than worse hitters (picked later in drafts). Through my work with The Process, I’ve found around a .650 OPS to be the production level where players start heading to the bench/minors/waiver wire. The person remained persistent and asked for an expanded look so here it is.
One of the first items to understand is that any comparison of recent projected versus the actual stolen bases will be negative. From 2010 to 2019 (extent of my historic projections), stolen bases are down from 2959 to 2280 or a drop of 23%. And for this analysis, we are concentrating just on high stolen base guys. Here are the players projected for 20+ steals and those that reached that number in the past ten seasons.
| Season | Projected | Actual |
|---|---|---|
| 2010 | 46 | 35 |
| 2011 | 35 | 50 |
| 2012 | 38 | 48 |
| 2013 | 18 | 40 |
| 2014 | 28 | 39 |
| 2015 | 22 | 30 |
| 2016 | 19 | 28 |
| 2017 | 20 | 29 |
| 2018 | 19 | 28 |
| 2019 | 19 | 21 |
The number of hitters projected for 20+ steals has been cut in half over the time frame. In a fifteen team league, a team is going to get one, maybe two hitters projected for and actually reaching 20 steals. So when aiming for steals, which players should be targeted?
To find out, I took all hitters projected for 400 or more plate appearances and 10 or steals (i.e. regulars who are projected to run). Then, I grouped the data by projected stolen bases and OPS. Then I compared the projected and actual stolen bases for each group. Here are the results.
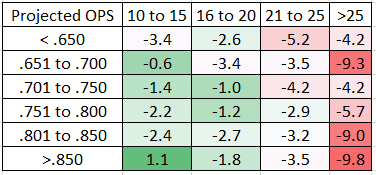
Two negative clumps stick out. The first is the hitters projected for an OPS under .700. This should not be surprising in that bad hitters don’t reach their plate appearance goals and therefore their stolen base numbers.
The other is that those projected for 20 or more steals as seen in the first table. It seems like the drop in stolen base totals are coming from these top runners. Several reasons could exist for this change. With home runs up, there is no reason for baserunners to potentially get thrown out. Also, teams are more aware that they need a high success rate to make running worthwhile. Finally, teams may not want their superstars injured on the bases. It’s likely a combination of the three along with some other factors.
When these two groups are combined, they miss their projections by an average of 4.4 bases. The good hitters with a muted projected total only missed by 1.4 bases. With the overall stolen base trend down, a drop will occur but it’s just a larger drop for the two subsets (maybe – check bonus content).
The downward trend in stolen bases could turn upward at any time. I’m just not betting on it right now. With MLB bring back at least some juiced balls (possible mid-season change), balls will still be flying out of the parks keeping run-scoring up. Until the offensive environment changes, I don’t expect stolen bases to jump back up.
One smaller trend I could see happen is that teams are caring less-and-less about stopping stolen bases since no one is running. There could be specific teams (e.g. the Mets) who teams might try to exploit by running more.
So who falls in each group for this upcoming season? First, the hitters who may not come close to their stolen base totals using the above criteria.
| Name | PA | OPS | SB |
|---|---|---|---|
| Mallex Smith | 588 | .678 | 39 |
| JaCoby Jones | 581 | .694 | 12 |
| Scott Kingery | 630 | .699 | 16 |
| Oscar Mercado | 602 | .715 | 22 |
| Adalberto Mondesi | 644 | .723 | 48 |
| Elvis Andrus | 658 | .723 | 22 |
| Jonathan Villar | 651 | .734 | 32 |
| Amed Rosario | 658 | .741 | 21 |
| Victor Robles | 658 | .748 | 29 |
| Whit Merrifield | 672 | .763 | 23 |
| Byron Buxton | 602 | .778 | 26 |
| Bo Bichette | 637 | .792 | 23 |
| Starling Marte | 644 | .815 | 26 |
| Fernando Tatis Jr. | 644 | .816 | 23 |
| Trea Turner | 665 | .825 | 38 |
| Jose Ramirez | 658 | .884 | 24 |
| Francisco Lindor | 665 | .885 | 21 |
| Ronald Acuna Jr. | 658 | .890 | 28 |
| Christian Yelich | 665 | .968 | 22 |
Mallex Smith gets the double-whammy of a low OPS and high stolen base projection. And how about those hitters who should not see much of a drop?
| Name | PA | OPS | SB |
|---|---|---|---|
| Mike Trout | 686 | 1.050 | 14 |
| Cody Bellinger | 658 | .969 | 12 |
| Bryce Harper | 665 | .924 | 11 |
| Trevor Story | 665 | .887 | 20 |
| Mookie Betts | 665 | .886 | 17 |
| Shohei Ohtani | 560 | .876 | 13 |
| Jose Altuve | 658 | .847 | 12 |
| Ozzie Albies | 665 | .834 | 14 |
| Tommy Pham | 630 | .832 | 18 |
| Austin Meadows | 602 | .830 | 14 |
| Keston Hiura | 630 | .826 | 13 |
| Javier Baez | 665 | .820 | 15 |
| Yoan Moncada | 651 | .816 | 12 |
| Yasiel Puig | 511 | .814 | 13 |
| Marcus Semien | 672 | .812 | 12 |
| Andrew Benintendi | 658 | .804 | 13 |
| Adam Eaton | 630 | .799 | 12 |
| Kyle Tucker | 427 | .785 | 14 |
| Ramon Laureano | 637 | .784 | 15 |
| Jean Segura | 651 | .767 | 13 |
| Gavin Lux | 560 | .766 | 10 |
| Lorenzo Cain | 630 | .763 | 19 |
| Trent Grisham | 532 | .761 | 10 |
| Cavan Biggio | 588 | .758 | 12 |
| Rougned Odor | 588 | .758 | 14 |
| Kolten Wong | 616 | .756 | 17 |
| Nick Senzel | 500 | .754 | 14 |
| Jackie Bradley Jr. | 637 | .751 | 12 |
| Tim Anderson | 658 | .748 | 18 |
| Brett Gardner | 511 | .748 | 10 |
| Tommy Edman | 498 | .741 | 15 |
| Dansby Swanson | 630 | .741 | 11 |
| Kevin Pillar | 476 | .732 | 10 |
| Andrelton Simmons | 630 | .731 | 11 |
| Kevin Newman | 546 | .729 | 17 |
| Wil Myers | 444 | .726 | 12 |
| Danny Santana | 553 | .723 | 18 |
| Shed Long | 567 | .717 | 10 |
| Niko Goodrum | 637 | .716 | 13 |
| Kevin Kiermaier | 483 | .712 | 15 |
| Mauricio Dubon | 504 | .708 | 12 |
| Victor Reyes | 525 | .707 | 15 |
| Nicky Lopez | 560 | .703 | 10 |
Several bats are close to the .700 threshold, so this group doesn’t feel entirely safe, but they’re more likely to reach their stolen base projections if history continues.
Returning to the original question, “Are early-round stolen bases safer than ones taken later in the draft?”. The answer is, it depends. Most of the hitters going in the early rounds have a combination of 20+ steals and a well-rounded skill set. These are the hitters who have seen the biggest stolen base drop. Those without limited stolen base projections are more likely to reach their projections.
I’d try to aim for as many of the 10 to 20 stolen base guys so that too many of my drafted projected steals aren’t in one or two players. These rabbits, who could be good hitters, may not reach their projections by up to 10 bases as seen in the second table. In the NFBC Main Event this past season, 129 stolen bases would have been good for third place in a league, or about 10 stolen bases per hitter or 12 when catchers are excluded. By adding steals and, most teams will be competitive as long as they didn’t take too many zeros. Just don’t be surprised if those with large projections miss.
Bonus Material
I’ve just started working with R and know enough programming to be dangerous and/or look like a fool. For that reason, take the following with a grain of salt. I ran the LOESS function (scatter.smooth) on the projected OPS and the difference between the projected and the actual stolen bases. The process is supposed to take what looks to be random data and finds any trends. Here are the results of the test (for larger image, right-click on it and open in new tab).
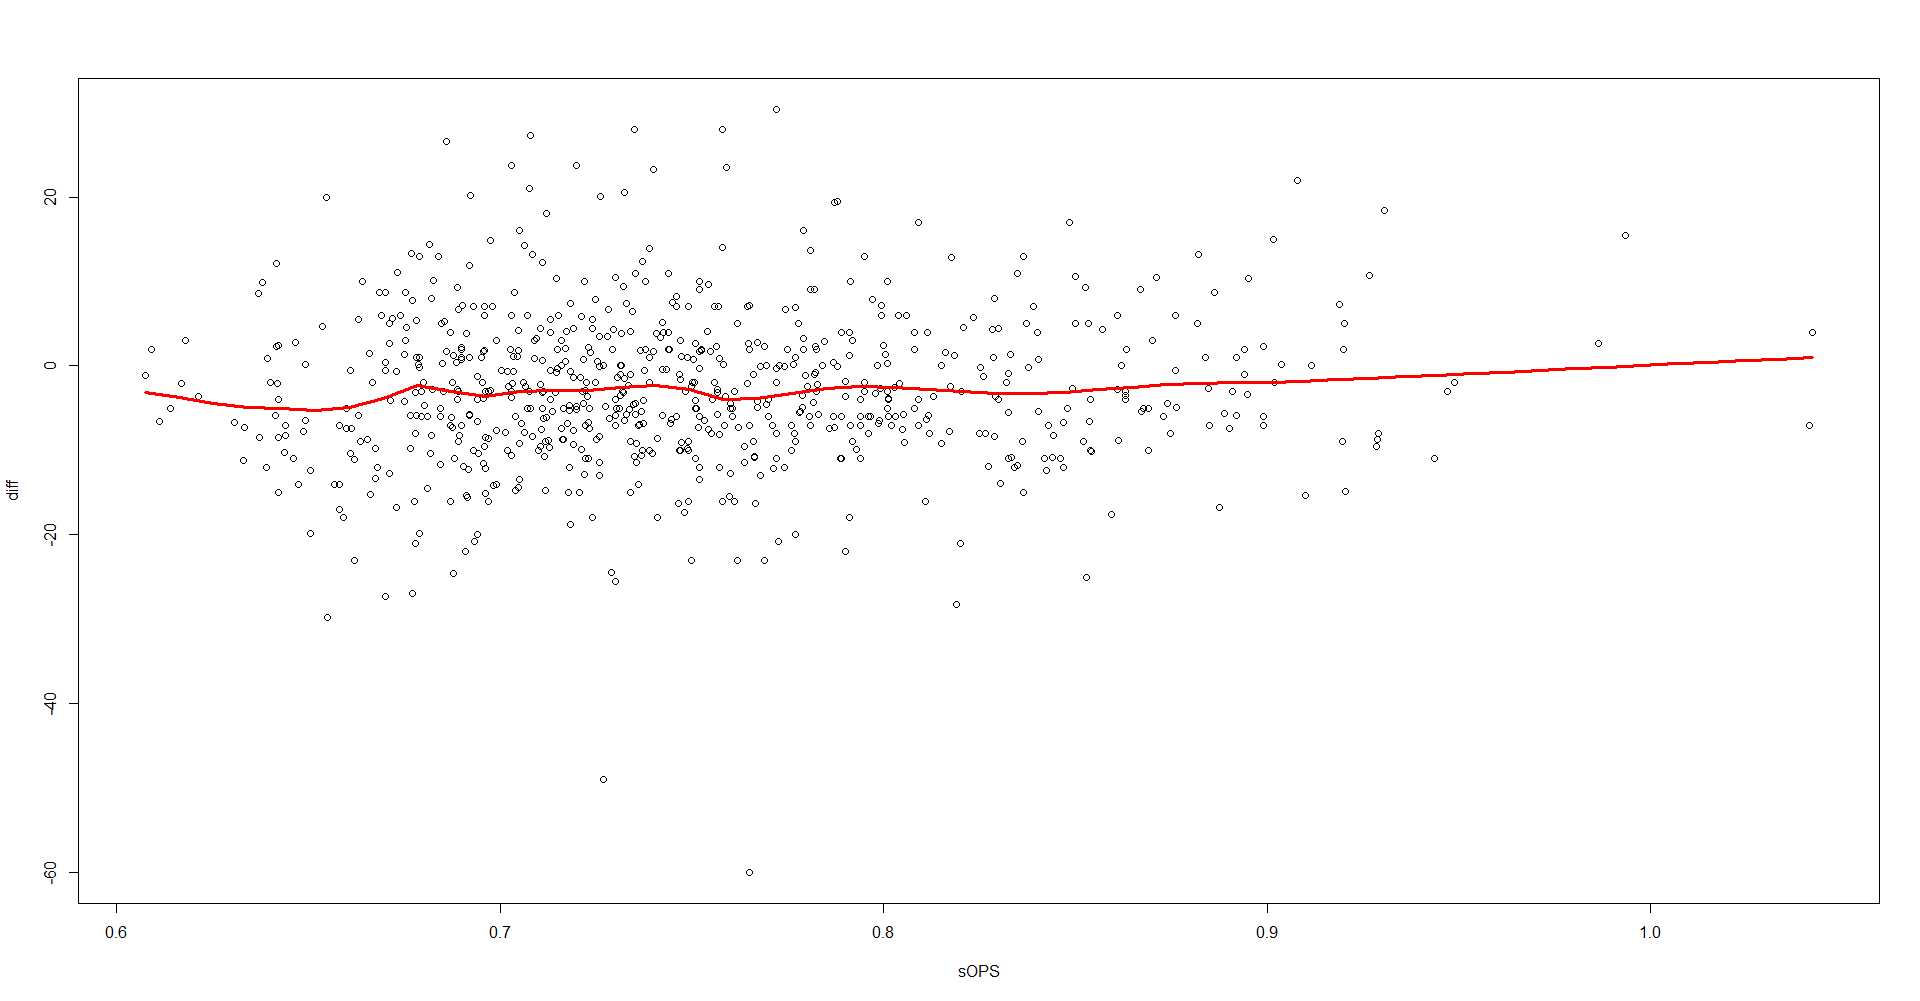
There are no major OPS breaking points from the data where the projections are better or worse. There is a small downward trend but not too much. If I felt secure about the output, I’d recommend, there is no difference in hitters reaching their stolen base totals but the initial analysis says something different. Maybe the answer is somewhere in-between. Maybe.
The beat Jeff Zimmerman Online Championship league has been set for February 23rd at 8 pm ET, feel free to go to the NFBC and sign up for their Draft or Online Championships. Also, for those with deeper pocketbooks, the NFBC Main Events are quickly filling up.
Jeff, one of the authors of the fantasy baseball guide,The Process, writes for RotoGraphs, The Hardball Times, Rotowire, Baseball America, and BaseballHQ. He has been nominated for two SABR Analytics Research Award for Contemporary Analysis and won it in 2013 in tandem with Bill Petti. He has won four FSWA Awards including on for his Mining the News series. He's won Tout Wars three times, LABR twice, and got his first NFBC Main Event win in 2021. Follow him on Twitter @jeffwzimmerman.
“ The Steamer projections I have are from 2010 to current. Over that time, stolen bases are down from 2959 to 2959 or a drop of 23%.”
Typo?
Can you provide confirmation they’re bringing back some of the juiced balls? They didn’t carry over from 17 to 18
Manfred said they aren’t changing anything. Nothing is wrong.
But in the postseason, there were no juiced balls. Manfred never said they were changing anything then, either, and yet it happened.
I know you want plate appearances to impact the analysis for the low end OPS guys who likely lose their jobs, but I’d be curious to see how much of the decline at the high end vs average is due to injuries. It might be helpful to look at them on a SB/PA basis.
Steamer charges for their old projections so I don’t have them but just off the top of my head I imagine Mondesi, Turner, S. Marte all missed their projections last year since they all missed at least 30 games.
Though if you wanted to go really next level you could probably figure out that guys who steal more frequently are more likely to get banged up.
Done: https://www.baseballhq.com/content/research-do-stolen-base-attempts-lead-injuries
Curious if you looked at outperformance of high total sb players. Could it simply be higher volatility of that group?
You can see who hit and missed in the bonus graph. It looks like more extreme values in the .700 to .800 range.
Robles and Turner are expected to fall? Blasphemy! No actually, your probably right, but I hope your wrong! I will point out that both have very good ZIPS projections and we will need them to excel to reach the playoffs in the very strong NL East.
Good stuff, Jeff. I’ve long followed the discussion on SB, including an article on this site several years ago suggesting SB were the category least likely to influence other categories. I play head to head leagues with lot of categories. In 5×5 leagues, the impact of SB is obvious, but I suspect that the impact decreases with the number of categories in head to head leagues. I would love to see an analysis along those lines.