Does Mike Matheny Hate Stolen Bases?
I’m already tired of hearing everyone’s hot take on how Matheny is going to halt the Royals from stealing bases. I’m not sure they are wrong but the analysis, if there is any, is suspect. Most talking heads point to his Cardinals being second to last in stolen bases during his tenure (2012 to all of 2018). The Cardinals weren’t exactly full of speedsters during that time. Here are their top-10 hitters ranked by plate appearances.
| Name | PA | SB | CS |
|---|---|---|---|
| Matt Carpenter | 4807 | 25 | 17 |
| Yadier Molina | 4676 | 45 | 21 |
| Matt Holliday | 3176 | 18 | 8 |
| Kolten Wong | 2836 | 83 | 23 |
| Jon Jay | 2346 | 41 | 24 |
| Allen Craig | 1694 | 10 | 2 |
| Jhonny Peralta | 1639 | 4 | 6 |
| Matt Adams | 1599 | 4 | 4 |
| Paul DeJong | 1597 | 11 | 6 |
| David Freese | 1451 | 5 | 5 |
Talk about “Wheelz”. Of these 10, Yadier Molina was second in steals. A catcher is second. This group would have problems stealing candy for a blind lady.
It’s time to dig a little deeper.
First, Matheny’s teams need to be compared to the league numbers. Sure the cardinals steals slowly declined but so did the overall league’s total (1261 in 2012 to 832 in 2018). I created a couple of stolen base rates of stolen bases (and attempts) per plate appearance and the total of walks, hit-by-pitches, and singles. Here is how the Cardinals compared to the league while Matheny was was manager including 2011 and 2019 to so the change from him arriving and leaving.
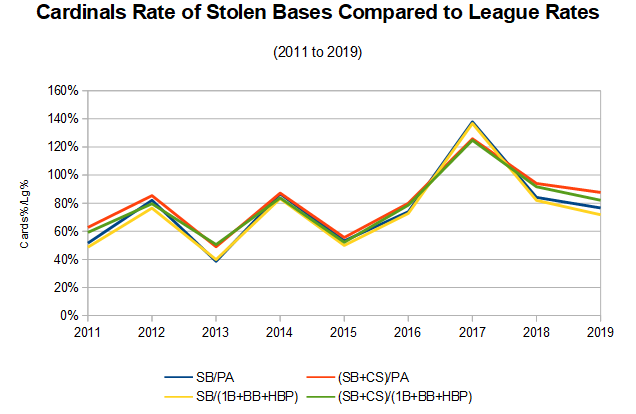
Matheny’s Cardinals were more likely to attempt a stolen base more from 2011 to 2012. And the rate dropped from 2018 to 2019. From just this graph, the Royals may steal more bases, not fewer. But I can dig a little deeper.
Team composition can change over time so it’s not exactly apples-to-apples comparing back-to-back seasons. Instead, I compared how any hitter did in the four stats from a season without Matheny to one with him and vice versa. These hitters include the bookend managerial seasons and anyone not on the Cardinals before or after a season he managed but on it in an adjacent season. In all, it was 75 player-matched season and here are the results weighted by the harmonic mean of their plate appearances (i.e. those who played more get more weighting).
Note: To group Matheny’s overall effect “2018 to 2019” and “Matheny to Others” with the other two groups, I had their signs reversed from the actual results. For example, the stolen base numbers for the Cardinals from 2018 to 2019 dropped, so Matheny’s effect is positive.
| Group | SB/PA | (SB+CS)/PA | SB/(1B+BB+HBP) | (SB+CS)/(1B+BB+HBP) |
|---|---|---|---|---|
| 2011 to 2012 | 0.7% | 0.8% | 2.5% | 2.5% |
| 2018 to 2019 | 1.0% | 0.9% | 3.8% | 3.7% |
| Matheny to Others | 0.4% | 0.6% | 1.4% | 2.1% |
| Others to Matheny | 0.2% | 0.1% | 5.2% | 4.9% |
| Overall Matheny Effect | 0.5% | 0.6% | 0.5% | 2.2% |
Again, nothing points to Matheny hating stolen bases but I’d love to the narrative to continue. If anything, he may give Adalberto Mondesi a stronger green light. Making the assumption that the above increase in stolen bases happens to Mondesi and he gets 500 PA, he’ll see about a 2 SB increase (47.2 SB to 49.8 SB) in his stolen bases per PA. It’s not a ton, but it’s not the huge drop everyone is predicting.
For the love of my fantasy teams, please let the “Mike Matheny Hates Stolen Bases” narrative continue. I can always use some cheap buys.
Jeff, one of the authors of the fantasy baseball guide,The Process, writes for RotoGraphs, The Hardball Times, Rotowire, Baseball America, and BaseballHQ. He has been nominated for two SABR Analytics Research Award for Contemporary Analysis and won it in 2013 in tandem with Bill Petti. He has won four FSWA Awards including on for his Mining the News series. He's won Tout Wars three times, LABR twice, and got his first NFBC Main Event win in 2021. Follow him on Twitter @jeffwzimmerman.
If a manager as old school as he is hated SB, that would really surprise me
You must not be listening to any talking heads. Congrats.
Mike Matheny does not have a coherent strategy in any facet of the game and struggles to articulate his decision-making process at any level.
I expect the Royals will steal bases because they have fast players with stolen base skills. Matheny has no ideology or belief in the matter.
The Cardinals were the worst baserunning in the NL during Matheny’s tenure. I think that has to do with Matheny’s inability to direct his team towards any sort of strategy.
Anyway, overall Mike Matheny is possibly the worst manager who ever lived but the royals will still put up a decent amount of stolen bases.
I agree that it was a terrible hire for the Royals. He just doesn’t fit with the direction/rebuild of this team. He was probably the only candidate that wouldn’t admit to having watched porn in his lifetime. We know how much GMDM despises porn. If none of these minor league pitchers pan out, Moore and his entire developmental regime need to be fired.
I’d say that since the overall success rate for that entire table is 68%, perhaps Matheny was wise not to have those fellows stealing much. Allen Craig was the best (83%) and of the rest only Wong (78%) topped 70% !
I assume this is a typo and should be from not for: “This group would have problems stealing candy for a blind lady.”. Otherwise, why are they stealing candy for a blind lady? Also, why a lady? Are blind ladies easier to steal candy from than blind men?