Yesterday, I began a new series, pitting THE BAT/THE BAT X against Steamer in a series of projection comparisons. I started off by identifying eight hitters who THE BAT X was projecting for a greater home run total over a 600 AB pace. Let’s now find out which hitters Steamer is forecasting for a greater home run total than THE BAT X.
The most interesting player projections are those that vary wildly from system to system. I love when the forecasting systems disagree about a certain player as it really spotlights the different methodologies of the underlying projection processes driving the calculations. Sometimes it’s obvious what’s driving the gap, as one system might regress more heavily toward the league average, while another might weight the individual’s performance more heavily. So let’s begin a new projection showdown series, pitting THE BAT/THE BAT X against Steamer in the various fantasy categories. I’m curious which system likes which players better in the various categories and it will help to try to understand why the systems are more bullish or bearish.
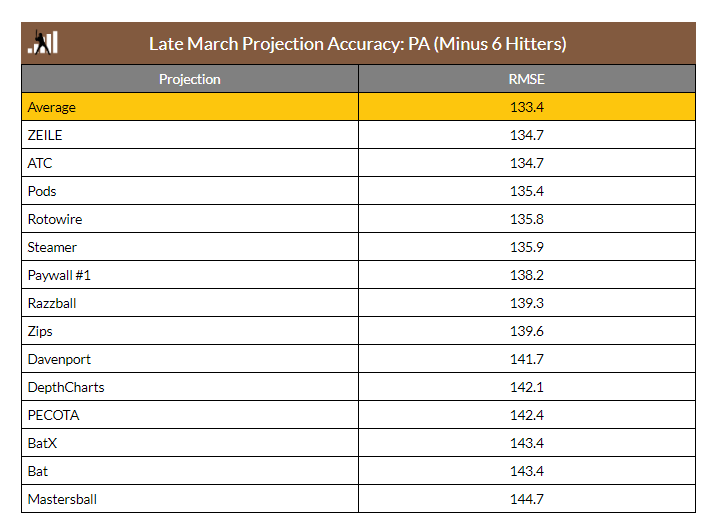
What started as a checkup on how projections turned into a fairly important find when using projections. On the projection front, aggregators, especially when done smartly, continue to crush the competition. The big illumination is ZiPS being near the top since it uses zero human input.
First off, here are last season’s results with my conclusion.
Hitter Playing Time
For playing time, three of the aggregators, Average, ZEILE, and ATC shoved in this category (Depth Charts takes a hit because it only uses one playing time input). It’s an easy win for the Wisdom of the Crowds.
To find this year’s player set to test, I used all the hitters drafted in at least 42 of the 47 NFBC Main Events. From this list, I excluded Seiya Suzuki because several systems didn’t include him. Also, I excluded Nelson Cruz, Luis Garcia, Manuel Margot, Jake Fraley, Seth Brown, Garrett Cooper, and Darin Ruf 러프. One or multiple systems didn’t have a projection for them. In all, I would have removed four projections, but decided it was better to have more projections and a few players missing. In all, this process was run on 223 hitters.
To determine accuracy, I calculated the Root Mean Square Error (RMSE) for four different sets of values. RMSE is a “measure of how far from the regression line data points are” and the smaller the value, the better.
I collected the projections on April 6th from a mix of 23 different sets. Some were free while others were behind a paywall. Those behind a paywall will be labeled as Paywall with a number (e.g. Paywall #1). Additionally, some of the projections were aggregates of other projections. All but one of the aggregators were publicly available. The one that wasn’t is called Aggregator #1. ATC, Depth Charts, and ZEILE are the projections that aggregate their competitors. Also, Steamer, ZiPS DC, and Depthcharts use the same playing time projections. THE BAT and THE BAT X use the playing time from ATC.
Finally, I looked into several ways to aggregate the projections to see if there was a preferred method and they were:
Average of all
Median of all
Preseason smart average: For this one, I had Rob Silver look at last season’s results, pick three sources to average, and they were used. He chose THE BAT X, Razzball, and Paywall #6.
Post-season best average: This started with an average of nine of the projections that I know get regular updates during the preseason. Next, I removed the worst remaining system using this year’s results. The value needed to get under 130.9, the top value for a standalone system.
Here are the results.
RMSE Value as Worse Systems Are Removed
Systems
RMSE
9
134.0
8
133.4
7
132.9
6
131.8
5
130.7
4
129.4
3
128.8
2
131.9
1
130.9
The three systems that had the best results are publicly available, Razzball, ZiPS, and Davenport.
With all that out of the way, here are the rankings using the full 223 hitters.
RMSE Values: All Players
System
RMSE
Post-Season Best
128.8
Aggregator #1
130.8
Davenport
130.9
ZiPS
132.4
BatX
133.5
Bat
133.6
ATC
134.3
Preseason Guess
135.1
Mr.Cheatsheet
135.3
Median
136.0
Razzball
136.2
CBS
137.8
ZEILE
137.8
Paywall #2
138.6
Average
139.3
Paywall #5
140.0
DraftBuddy
140.1
FreezeStats
142.6
Paywall #3
142.7
Steamer
142.8
Paywall #4
143.1
DepthCharts
143.9
Paywall #6
143.9
Paywall #1
144.8
ZiPS DC
145.1
Rotoholic
169.4
Mays Copeland
173.4
Before drawing any conclusions, here are the results without the hurt players.
RMSE Values: Hurt Players Removed
System
RMSE
Post-Season Best
112.1
Davenport
113.6
Aggregator #1
115.2
THE BAT X
115.5
THE BAT
115.6
ATC
116.1
Mr. Cheatsheet
116.9
ZiPS
117.4
Median
117.5
Preseason Guess
117.6
Average
118.5
CBS
119.3
ZEILE
119.3
Razzball
119.8
Draft Buddy
120.9
Paywall #5
121.9
Paywall #3
123.1
Paywall #2
123.6
FreezeStats
124.1
Steamer
124.3
DepthCharts
124.8
Paywall #4
125.4
ZiPS DC
126.0
Paywall #1
126.3
Paywall #6
127.2
Rotoholic
150.3
Mays Copeland
157.8
Like last season, the aggregated systems (e.g. ATC, THE BATs, Median, ZEILE) are near the top. The two projections that stand-alone are Davenport and ZiPS. Last season, they didn’t perform horribly but not good enough to stand out . Here are those rankings.
Note: I might be talking about Mr. Cheatsheet next year as a projection to target.
Both of them had a bad finish but they both were near the top at other times. For standalone playing time projections, they should be given consideration along with the aggregators and Razzball.
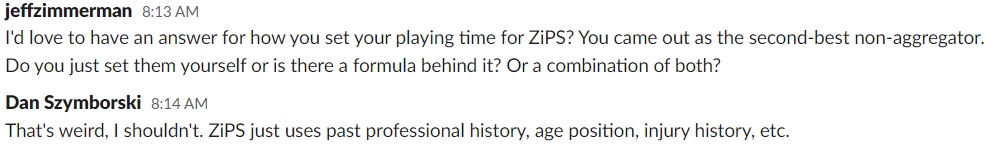
Since the playing time from ZiPS is separate from the other playing time projections here at FanGraphs, I asked Dan Szymborski, how he sets the playing for ZiPS.
So setting playing time by just knowing player traits is at least average and outperforms most projection systems.
I was not surprised to find that some of the factors helped predict playing time. While the short 2020 season has caused some hiccups, I found playing time projections could be improved by knowing a hitter’s previous playing (injuries), player talent (good players play more than crappy players), and age. My formula was just a 10% improvement, but still helpful.
What ZiPS is doing is pointing out factors analysts might be missing. For example, why does ZiPS have Gunnar Henderson at 557 AB and Steamer down at 531 AB? A system must be even lower on Henderson’s playing time and is dragging ATC down to 510 AB.
One issue with ZiPS is that it doesn’t robotically zero out playing time. There will be more plate appearances than available in a season. It’s not close to a perfect projection system, but it is definitely catching some factors other projections aren’t.
Here are a couple of issues I could see chopping into ZiPS’s high rank going forward.
It could just be a recent blip where analysts are still having problems evaluating playing time so near to the shortened 2020 season and the 2021 late start. Once baseball gets back to normal, analysts might perform better.
The other projection creators could start spotting their biases and make adjustments to correct them. I’m not sure about this change happening. I discussed ZiPS’s performance with two people behind the better projections and they blew off the ZiPS results.
It’s always I ton of work to set up these projection comparisons. As expected, the aggregators dominated again with a couple of single systems (ZiPS and Davenport) taking a step up this past season. It’s interesting that ZiPS performed as well as it did considering it has no human input.
Yesterday, I listed and discussed seven hitters whose Statcast Barrel% surged the most versus 2021. Now let’s flip over to the hitters whose Barrel% marks declined most versus 2021. Were their HR/FB rates dragged down along with it? Will either marks rebound in 2023? Let’s dive in.
Since Barrel% has been recorded beginning in 2015, there’s a 0.82 correlation between the Statcast metric and HR/FB rate. That’s pretty big! While Barrel% theoretically includes all batted balls, the vast majority occur on fly balls, as 76% of barrels hit in 2022 were of this batted ball type. The rest came from line drives. So a quick shortcut to determine a hitter’s HR/FB rate potential is to simply look at his Barrel%. The higher the mark, the better. Let’s take a look at which hitters increased their Barrel% marks most versus 2021 and whether their HR/FB rates also increased.
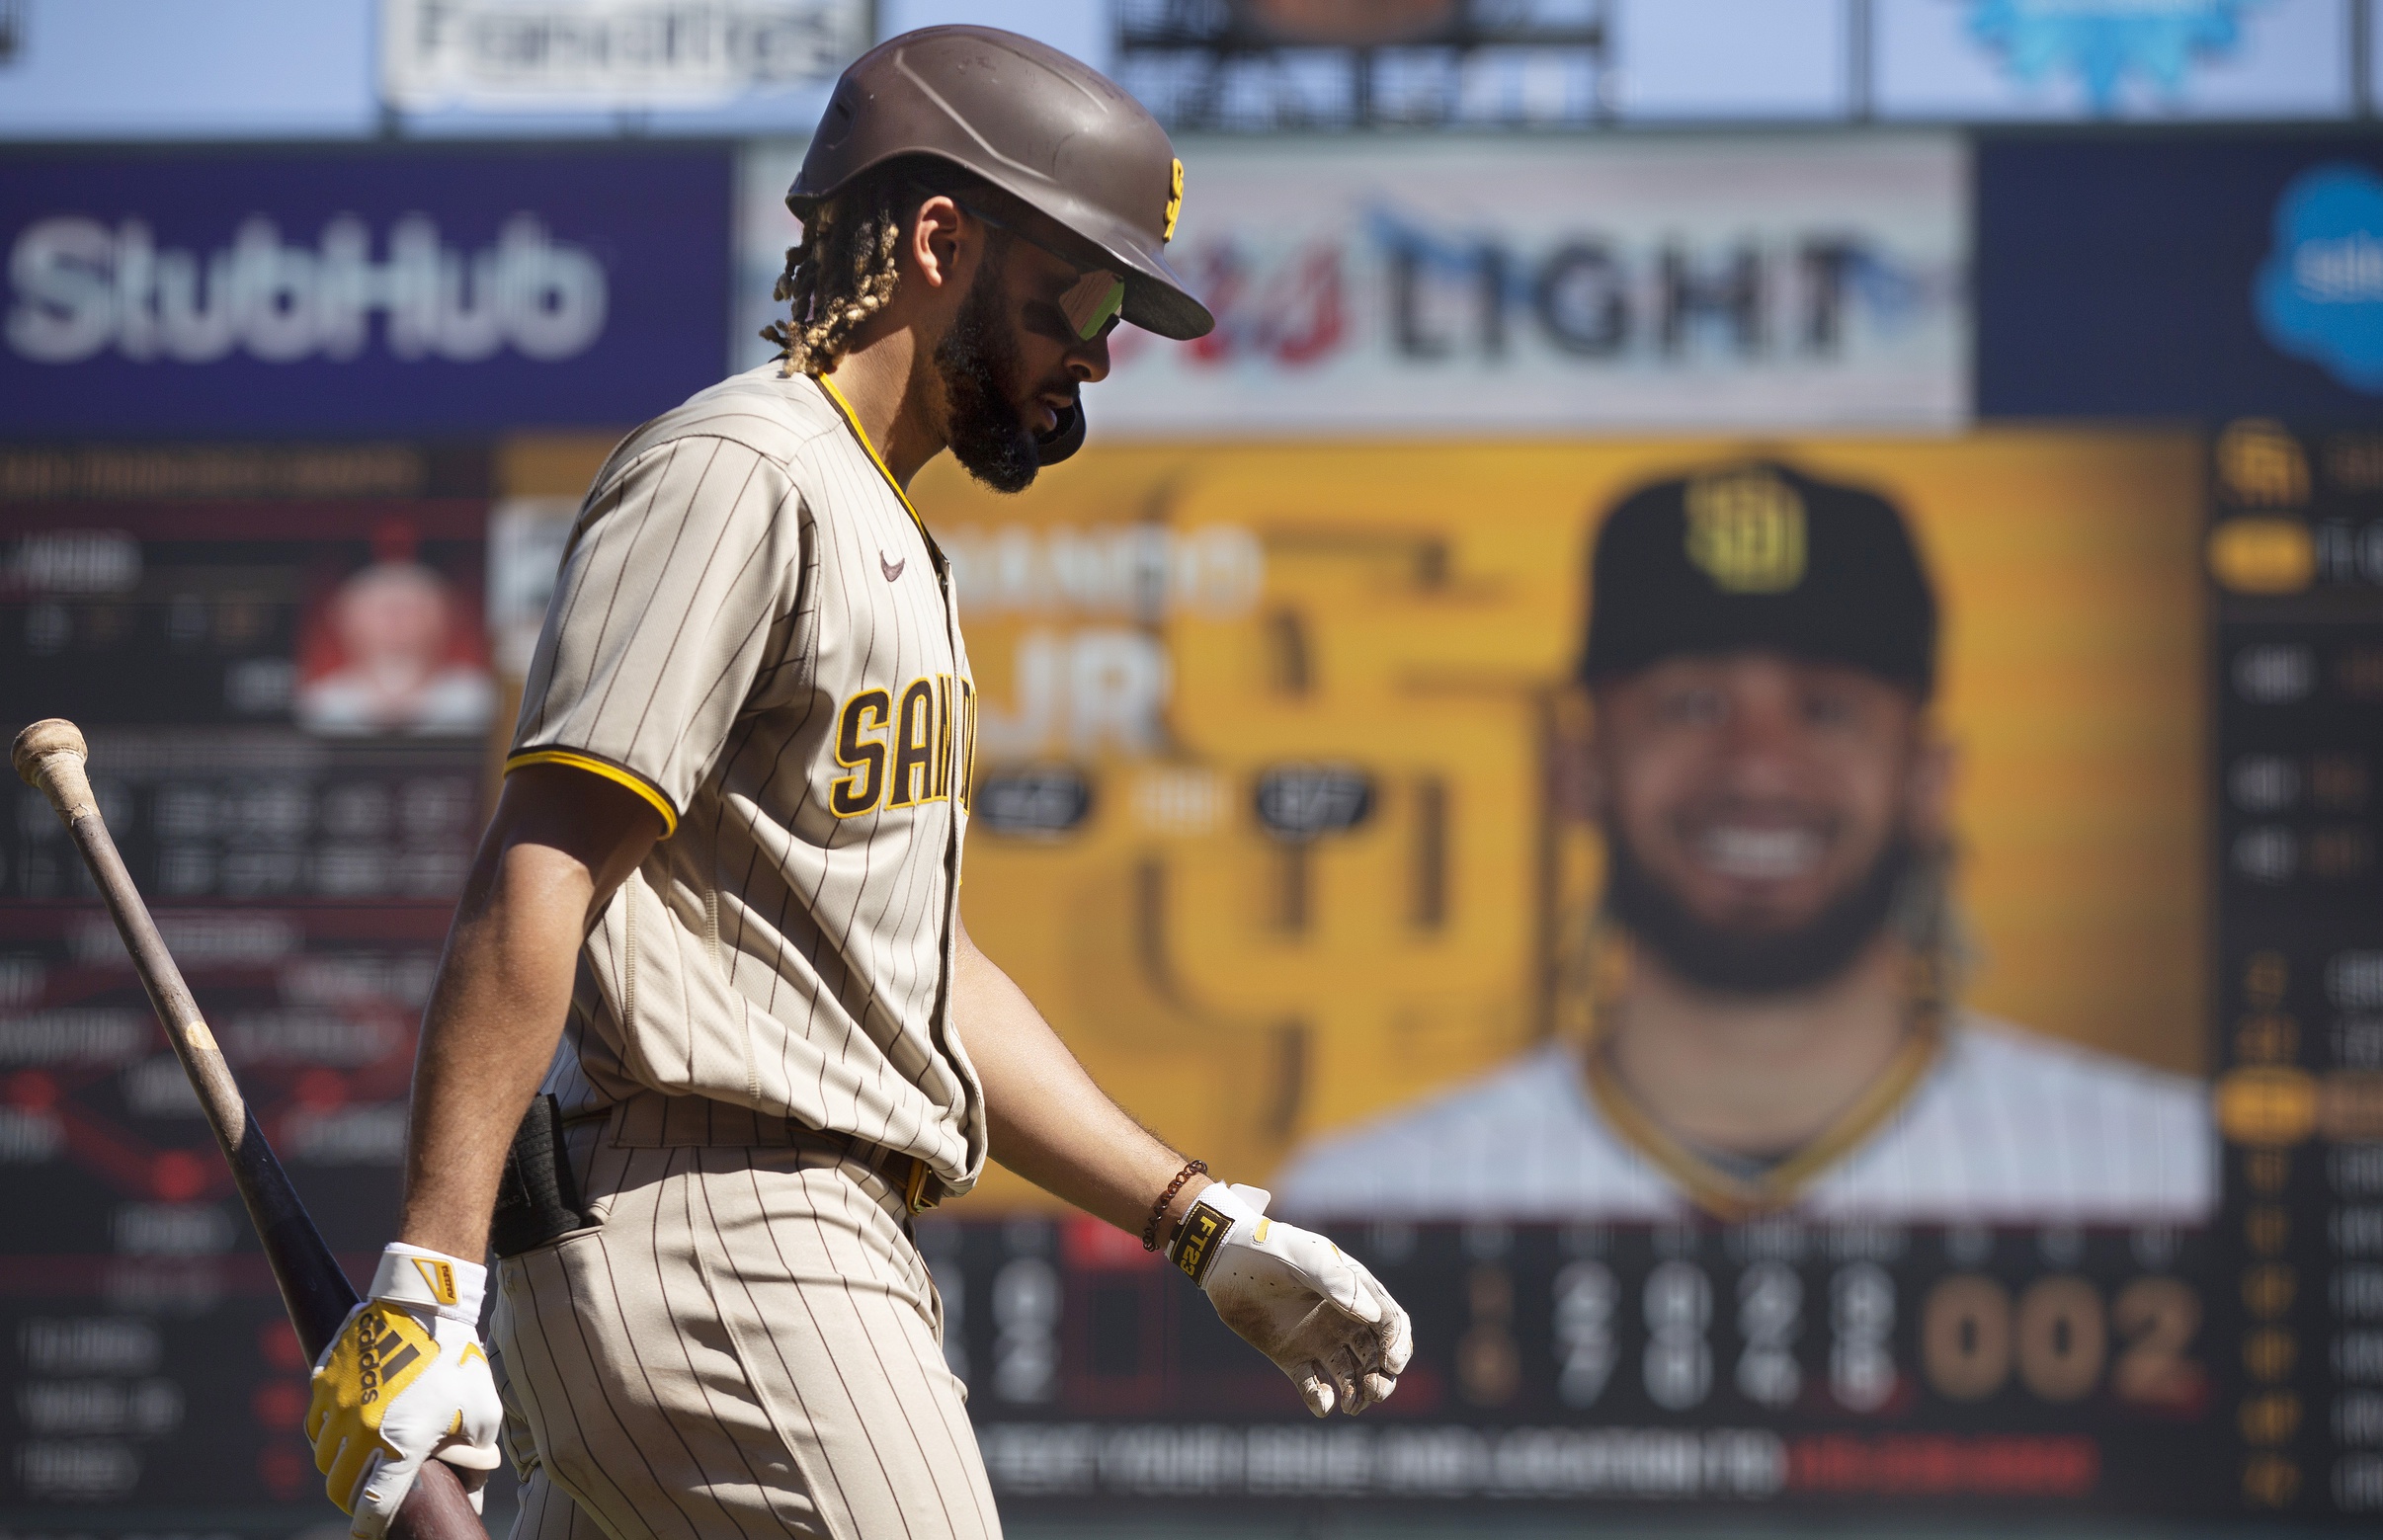
I tweeted out wanting to know who had shoulder surgeries similar to Fernando Tatis Jr. and it garnered many examples and opinions on the subject.
Hitters with a torn labrum in their shoulder (Tatis).
Jake Meyers ('21) – not back yet Greg Bird ('16) – might have ended his career Devin Mesoraco ('16) Daric Barton ('11) Posada ('08) – partial tear, back decent and then faded Jesus Flores ('09) – career ender
All I wanted was the names of those who had the same or similar operations but got a lot more. With those comps, I hoped to get a range of potential outcomes. Well, I got them and whole lot more.
I know most people will already be anchored to an opinion that is probably based on already drafting or passing on Tatis in drafts or rostering him or not in a keeper league. For those with an open mind, here is what I think is the best information people gave me. Read the rest of this entry »
If you’ve followed my Tout Wars auctions and LABR in recent years, you would know that I can’t seem to quit Adalberto Mondesi. His tantalizing combination of speed and power make him a potential top 10 fantasy player. Unfortunately, health issues has ensured that has never happened. After being limited to just 54 plate appearances last year due to an ACL tear that required surgery, I thought this was finally the perfect opportunity to move on. Sadly for my auction budget and early round pick, Mondesi was traded to the Red Sox on Monday. Having not yet looked at the park factors, my knee-jerk reaction is that this is great for his fantasy value. Rather than speculate without the data, let’s actually compare the park factors of his old and new homes and find out if this move actually is a positive.
Yesterday, I identified and discussed the qualified hitters who most underperformed their Statcast xwOBA marks. Today, let’s review the overperformers.
Let’s start reviewing various 2022 metrics. Today, I’ll start by comparing a hitter’s wOBA to his Statcast xwOBA. If a projection system is directly weighing previous season surface results, rather than incorporating batted ball data, the forecast could be more pessimistic or optimistic than it should. This list of xwOBA underperformers could potentially beat their projections if only their 2022 surface results, and not the underlying data, are considered.
In the final game of the 2021 regular season, Max Muncyinjured his left elbow after a collision with Jace Peterson as Muncy tried to catch a throw while Peterson ran through first base. It cost Muncy all of the 2021 postseason and in November of 2021, we learned that Muncy’s injury was indeed the torn UCL that many feared it was when it happened. In January of 2022, we learned he wouldn’t need surgery, but there were concerns about how it might impact at least the start of his 2022 season.
While he made it through spring and was ready for Opening Day, it was clear early on that the elbow was still bothering him. He hit a brutal .136/.313/.273 in 83 April plate appearances and while it was reasonable to believe the .149 BABIP would regress back toward his career .256 mark, there was still trouble brewing. It wouldn’t get much better in the following months with a .595 OPS in May, .675 in June, and .597 in July, all with sub-.200 AVGs and just 9 HR in his 339 PA. With just a .150/.327/.263 line through May 25th, Muncy hit the IL. He didn’t want to blame his struggles on the elbow, but I mean… c’mon, it was the elbow. He did eventually acknowledge that he rushed back from the injury and should’ve taken some time.