
2022 Projection Accuracy: Hitter Playing Time
What started as a checkup on how projections turned into a fairly important find when using projections. On the projection front, aggregators, especially when done smartly, continue to crush the competition. The big illumination is ZiPS being near the top since it uses zero human input.
First off, here are last season’s results with my conclusion.
Hitter Playing Time
For playing time, three of the aggregators, Average, ZEILE, and ATC shoved in this category (Depth Charts takes a hit because it only uses one playing time input). It’s an easy win for the Wisdom of the Crowds.
To find this year’s player set to test, I used all the hitters drafted in at least 42 of the 47 NFBC Main Events. From this list, I excluded Seiya Suzuki because several systems didn’t include him. Also, I excluded Nelson Cruz, Luis Garcia, Manuel Margot, Jake Fraley, Seth Brown, Garrett Cooper, and Darin Ruf 러프. One or multiple systems didn’t have a projection for them. In all, I would have removed four projections, but decided it was better to have more projections and a few players missing. In all, this process was run on 223 hitters.
With the same dataset, I removed the hitters who missed a significant part of the season due to injury. The players left out were Adalberto Mondesi, Miguel Sano, Alex Kirilloff, Kris Bryant, Austin Meadows, Anthony Rendon, Ozzie Albies, Jazz Chisholm Jr., and David Fletcher.
To determine accuracy, I calculated the Root Mean Square Error (RMSE) for four different sets of values. RMSE is a “measure of how far from the regression line data points are” and the smaller the value, the better.
I collected the projections on April 6th from a mix of 23 different sets. Some were free while others were behind a paywall. Those behind a paywall will be labeled as Paywall with a number (e.g. Paywall #1). Additionally, some of the projections were aggregates of other projections. All but one of the aggregators were publicly available. The one that wasn’t is called Aggregator #1. ATC, Depth Charts, and ZEILE are the projections that aggregate their competitors. Also, Steamer, ZiPS DC, and Depthcharts use the same playing time projections. THE BAT and THE BAT X use the playing time from ATC.
Finally, I looked into several ways to aggregate the projections to see if there was a preferred method and they were:
- Average of all
- Median of all
- Preseason smart average: For this one, I had Rob Silver look at last season’s results, pick three sources to average, and they were used. He chose THE BAT X, Razzball, and Paywall #6.
- Post-season best average: This started with an average of nine of the projections that I know get regular updates during the preseason. Next, I removed the worst remaining system using this year’s results. The value needed to get under 130.9, the top value for a standalone system.
Here are the results.
| Systems | RMSE |
|---|---|
| 9 | 134.0 |
| 8 | 133.4 |
| 7 | 132.9 |
| 6 | 131.8 |
| 5 | 130.7 |
| 4 | 129.4 |
| 3 | 128.8 |
| 2 | 131.9 |
| 1 | 130.9 |
The three systems that had the best results are publicly available, Razzball, ZiPS, and Davenport.
With all that out of the way, here are the rankings using the full 223 hitters.
| System | RMSE |
|---|---|
| Post-Season Best | 128.8 |
| Aggregator #1 | 130.8 |
| Davenport | 130.9 |
| ZiPS | 132.4 |
| BatX | 133.5 |
| Bat | 133.6 |
| ATC | 134.3 |
| Preseason Guess | 135.1 |
| Mr.Cheatsheet | 135.3 |
| Median | 136.0 |
| Razzball | 136.2 |
| CBS | 137.8 |
| ZEILE | 137.8 |
| Paywall #2 | 138.6 |
| Average | 139.3 |
| Paywall #5 | 140.0 |
| DraftBuddy | 140.1 |
| FreezeStats | 142.6 |
| Paywall #3 | 142.7 |
| Steamer | 142.8 |
| Paywall #4 | 143.1 |
| DepthCharts | 143.9 |
| Paywall #6 | 143.9 |
| Paywall #1 | 144.8 |
| ZiPS DC | 145.1 |
| Rotoholic | 169.4 |
| Mays Copeland | 173.4 |
Before drawing any conclusions, here are the results without the hurt players.
| System | RMSE |
|---|---|
| Post-Season Best | 112.1 |
| Davenport | 113.6 |
| Aggregator #1 | 115.2 |
| THE BAT X | 115.5 |
| THE BAT | 115.6 |
| ATC | 116.1 |
| Mr. Cheatsheet | 116.9 |
| ZiPS | 117.4 |
| Median | 117.5 |
| Preseason Guess | 117.6 |
| Average | 118.5 |
| CBS | 119.3 |
| ZEILE | 119.3 |
| Razzball | 119.8 |
| Draft Buddy | 120.9 |
| Paywall #5 | 121.9 |
| Paywall #3 | 123.1 |
| Paywall #2 | 123.6 |
| FreezeStats | 124.1 |
| Steamer | 124.3 |
| DepthCharts | 124.8 |
| Paywall #4 | 125.4 |
| ZiPS DC | 126.0 |
| Paywall #1 | 126.3 |
| Paywall #6 | 127.2 |
| Rotoholic | 150.3 |
| Mays Copeland | 157.8 |
Like last season, the aggregated systems (e.g. ATC, THE BATs, Median, ZEILE) are near the top. The two projections that stand-alone are Davenport and ZiPS. Last season, they didn’t perform horribly but not good enough to stand out . Here are those rankings.
Note: I might be talking about Mr. Cheatsheet next year as a projection to target.


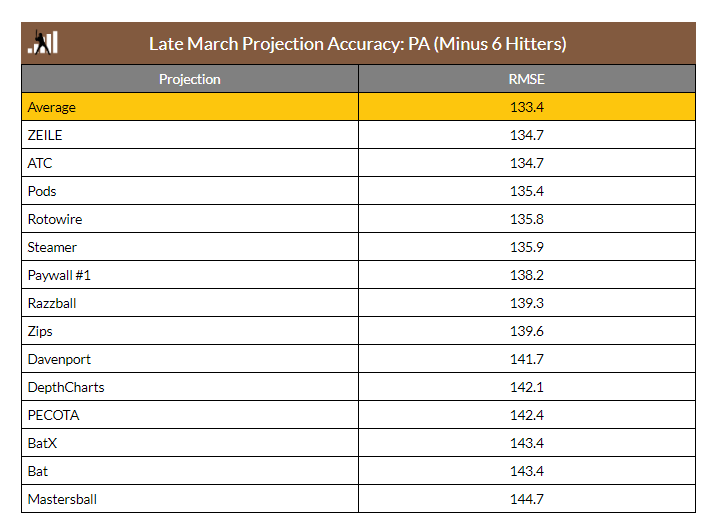
Both of them had a bad finish but they both were near the top at other times. For standalone playing time projections, they should be given consideration along with the aggregators and Razzball.
Since the playing time from ZiPS is separate from the other playing time projections here at FanGraphs, I asked Dan Szymborski, how he sets the playing for ZiPS.

So setting playing time by just knowing player traits is at least average and outperforms most projection systems.
I was not surprised to find that some of the factors helped predict playing time. While the short 2020 season has caused some hiccups, I found playing time projections could be improved by knowing a hitter’s previous playing (injuries), player talent (good players play more than crappy players), and age. My formula was just a 10% improvement, but still helpful.
What ZiPS is doing is pointing out factors analysts might be missing. For example, why does ZiPS have Gunnar Henderson at 557 AB and Steamer down at 531 AB? A system must be even lower on Henderson’s playing time and is dragging ATC down to 510 AB.
One issue with ZiPS is that it doesn’t robotically zero out playing time. There will be more plate appearances than available in a season. It’s not close to a perfect projection system, but it is definitely catching some factors other projections aren’t.
Here are a couple of issues I could see chopping into ZiPS’s high rank going forward.
- It could just be a recent blip where analysts are still having problems evaluating playing time so near to the shortened 2020 season and the 2021 late start. Once baseball gets back to normal, analysts might perform better.
- The other projection creators could start spotting their biases and make adjustments to correct them. I’m not sure about this change happening. I discussed ZiPS’s performance with two people behind the better projections and they blew off the ZiPS results.
It’s always I ton of work to set up these projection comparisons. As expected, the aggregators dominated again with a couple of single systems (ZiPS and Davenport) taking a step up this past season. It’s interesting that ZiPS performed as well as it did considering it has no human input.
Jeff, one of the authors of the fantasy baseball guide,The Process, writes for RotoGraphs, The Hardball Times, Rotowire, Baseball America, and BaseballHQ. He has been nominated for two SABR Analytics Research Award for Contemporary Analysis and won it in 2013 in tandem with Bill Petti. He has won four FSWA Awards including on for his Mining the News series. He's won Tout Wars three times, LABR twice, and got his first NFBC Main Event win in 2021. Follow him on Twitter @jeffwzimmerman.
Really great stuff, Dr. Z. I always thought projection systems need to be analyzed by parsing PT and rate stats (not by combining them). This is one side of the coin – would love to see the rate side with this level of detail.
One of my big takeaways from the “RSME – Hurt Players Removed” chart is not to pay for any projection system. Only one of the six paywall systems beat the average (barely).
Also, I think you can just call ZiPS DC as Depth Charts since you’re not using any ZiPS rate stats there?
Thanks for doing this, Jeff.
My own projections are the Open Projections–a simple, open source projection that should be just a step above Marcel. There’s no manual input into playing time.
I suggested including them in the analysis as a baseline projection, and they certainly succeeded at that.
If you want to take ZiPS at face value, seems like it also should get dinged for all the erroneous PT projections it makes for hitters who weren’t among the chosen 223. For example, just looking at the Cardinals list for 2022 (first one that happened to pop up in a search) you get the likes of Paul DeJong, projected 505 PA (actual 237); Nolan Gorman, 548 (313); Edmundo Sosa, 432 (190); Matt Koperniak, 428 (0); Alec Burleson, 528 (53), etc. etc. Like Dan always says in his writeups, “ZiPS is agnostic about future playing time by design,” which probably is why he sounded so surprised in his Twitter response.
Came here to say this. There’s a huge selection bias in favor of ZiPs when you’re only looking at the sunset of players that mostly played the whole season
I use projections heavily but I only use the rate stats for exactly this reason. The system that doesn’t try very hard to project playing time outperforms those that try very hard to do so; it’s an indictment of half the equation. Since we’ve established that playing time is a wild-ass guess, maybe projections (and consumers like me) should focus on the rates only. We, the unwashed masses, can multiply by our own wild guesses re: playing time.
ETA – One sees this type of error in the corporate world all the time. Let’s make a very well-honed estimate based on tons of data, and at the end of the process let’s introduce massive amounts of error when we multiply it by a complete guess. People are so bad at math but even worse at admitting it.
I find it most useful to put projected counting stats on a 600-PA scale (a la Steamer600) and compare potential.
I’m kind of interested in our Depth Chart projections which end up being fundamentally different than straight fantasy projections. Unlike other systems which may hedge on certain players by boosting playing time for all of them, the depth charts are a zero sum game.
I wonder if there’s a way we can better utilize them for fantasy.
It’s curious though that Steamer which is based more or less on our Depth Charts does a bit better, mostly by taking batting order more into account I believe, so maybe that’s half the answer.
Anyway nice work as usual.
A word on zero sum:
From a fantasy perspective, and from a “best guess” perspective – doing a zero sum approach is typically not the best answer.
Consider going into an apartment building that has 2 elevators at the base floor. Call them A & B. They are spread out 10 feet apart from each other. You and your friend press the button to call an elevator to go up. The question is where do you stand? Where is the best place to stand to minimize variance/error/you name it?
The answer inuitively is to both stand in the middle between the two elevators – 5 feet from one, and 5 feet from the other. Of course, standing between the two as opposed to each of you standing in front of one – isn’t an actual possibility. The zero sum game would be to say that it is 50% A and 50% B … so one of you each stand by one. But you will have much better success in the long run if you both stand exactly in between the two. The zero sum approach isn’t the best answer.
I often get asked the question – why do ATC projections only show 3-4 players projected to hit above .300, when in reality there are a dozen or so. Same answer here – the best guess … what you should bet to be right in the long run, isn’t going to resemble the actual distribution of players. Best guesses don’t have to be zero sum, and are typically not zero sum.
Also … great work once again Jeff!
Now that you have done this two years in a row – Do you have a two-year analysis? Any one system can pop up as excellent in a given year, but a multi-year sample is arguable more predictive, especially since you are using RMSE.