Let’s begin with a nice oppo example from this past Sunday’s game in Philadelphia, where the Phillies took on Max Scherzer and the Mets:
A young Bryson Stott stays through the ball and knocks in an RBI by going oppo. In last week’s post, I built a model that combined data from our batted ball, statcast, and plate discipline leaderboards for a single point in time in the 2021 season, and used those metrics to target whether or not (a 0/1 binary target variable) a batter recorded a hit the following day. While I pointed out that there was just too little data training the model I was using, I did think it interesting that Oppo% was the most important variable when predicting a hit. Was I on to something? Is predicting a hit as simple as looking at who goes oppo the most?
You and I both know there’s nothing simple about getting a hit, but Oppo% seems like an important statistic when we’re talking about singles. In one of my favorite offbeat fantasy baseball games, Beat The Streak, players must choose one player each day to get a hit and do that successfully for 56 days in order to win a Scrooge McDuck fortune ($5.6 mill). So, this week’s post is all about Oppo%; what it means, what it tells us about a player’s ability to record a hit, and if we can really use it to build out our own swimming pool of gold coins. So let’s take a good look at Oppo% and what it might mean for predicting a hit. Here are your current oppo leaders (qualified hitters) along with their batting average, BABIP, and slugging so far this season:
2022 Oppo% Leaders
Among qualified hitters as of 5/10/22.
Each one of these hitters, besides Tsutsugo and Lopez, is hitting above league average according to batting average and BABIP. Remove the two hitters already mentioned, remove Hicks and Straw, and everyone left is slugging above average. This is a good group of hitters. But, I don’t know that beyond Freeman and J.D. Martinez I would be trusting anyone from this group with all my gold coins. In other words, I wouldn’t feel confident in making my daily hit prediction by sorting descending on Oppo%…yet.
As always, people will shout, it’s not enough data! They’re right, but they don’t need to shout. This issue was present in my model from last week’s post. Just a snapshot of one day in baseball doesn’t do the full game justice. I went back and added more data to the model I built previously (still not enough, but we’ll call it “improved”) and Oppo% decreased in importance, but stayed in the mix as an important variable to consider when predicting a hit.
With a larger dataset, the higher feature importances were taken over by things like HardHit%, Barrel%, maxEV, and LD%, which we should expect. In fact, for those who read last week’s post, here is an updated feature importance chart for the same model with more data to train on:
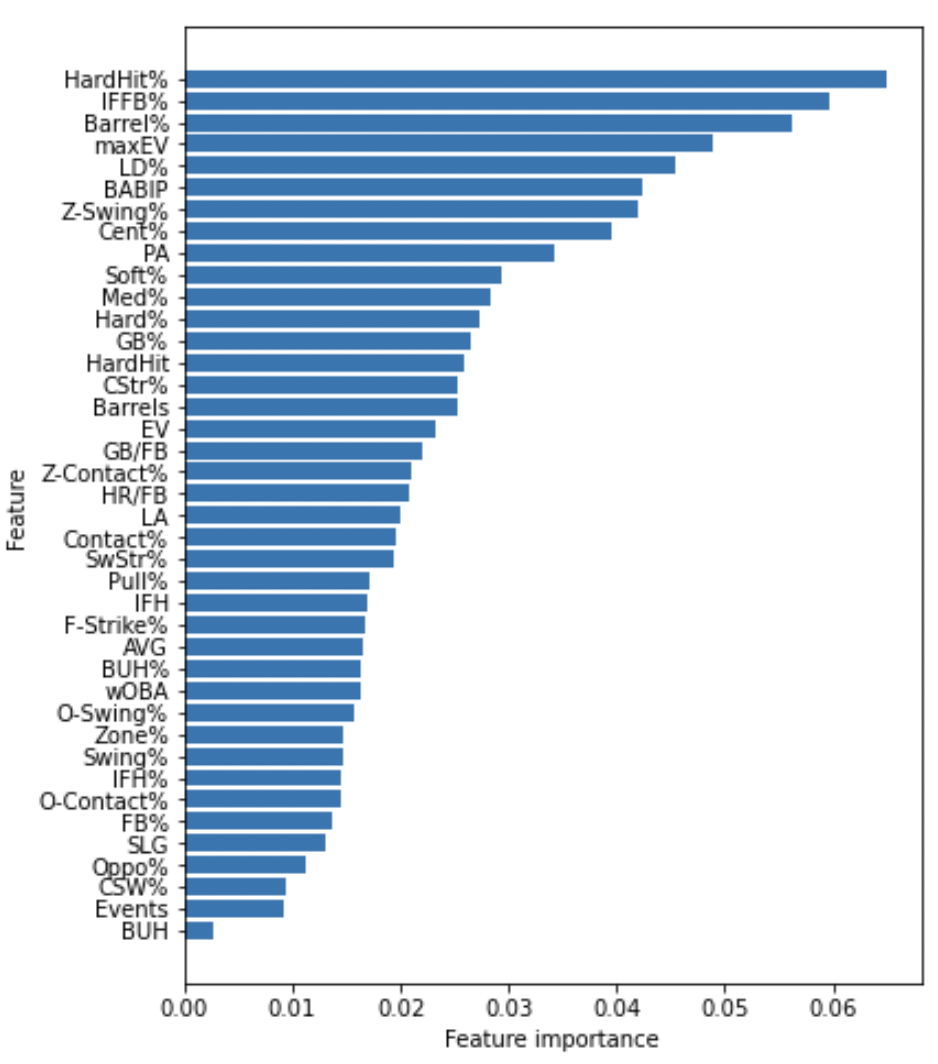
This isn’t as interpretable as a regression model. A random forest creates lots of little decision trees that act as voters to make predictions. Therefore, the model can be difficult to interpret, because you would have to go look at all the little trees being built to get a full picture of how the predictions are being made. In this example, you can see that HardHit% is the first most important feature and IFFB% is the second most. But good hitters should look to hit the ball harder and pop up in the infield less, yet their importances are measured almost equally? That’s because hitting in-field fly balls is just as bad for your hit-ability as hitting the ball hard is good for your hit ability. The 0.06 feature importance isn’t all that interpretable without that background knowledge. We know it’s important, but what does important mean? Furthermore, if we’re trying to figure out how important Oppo% is to a batter getting a hit, more data tells us that it is less important. What the heck does that mean?! Whoaaa! Relax. Take a breath. Watch this video:
While going oppo is no longer as important in a model with a larger dataset, I still see its importance, don’t you? Instead of worrying about fancy models and sample sizes, let’s just take a moment to look at Oppo% in the context of the 2021 season. Here’s a breakdown of batted ball data from the 2021 full season with a 170 PA threshold and how hard, medium, or soft the balls were hit:
Batted Ball Break Downs 2021
|
Soft |
Med |
Hard |
BABIP |
| Oppo |
24.4 |
52.8 |
22.8 |
0.300 |
| Pull |
12.6 |
50.3 |
37.1 |
0.282 |
| Cent |
15.2 |
51.7 |
33.1 |
0.296 |
Among hitters with at least 170 PAs
Opposite hit balls in play were hit softly more often, hit hard less often, but had a higher BABIP than both pulled and centered balls in play. Wild! Want more? How about adding in a little contact type data:
Batted Ball Break Downs with Contact Type 2021
|
LD |
GB |
FB |
| Oppo |
21.6 |
21.5 |
56.9 |
| Pull |
20.5 |
57.7 |
21.8 |
| Cent |
20.2 |
41 |
38.8 |
Among hitters with at least 170 PAs
Now, opposite-field batted balls had higher fly ball rates than pulled balls? That’s interesting. My guess is that those are the jam shots that result in fly ball, easy outs. Take a look at an example from the 2021 leader in opposite hit fly balls,
Ozzie Albies:
…but sometimes, this happens:
What is most highly correlated with Oppo%? BABIP for the win! A correlation of 0.4 doesn’t make you want to run to pick Yoshi Tsutsugo every day, but it is interesting nonetheless. A small negative correlation with SLG seems strange, but perhaps that’s because unless you drill the ball down the line, chances are your opposite-field hit won’t get you a ton of extra bases.
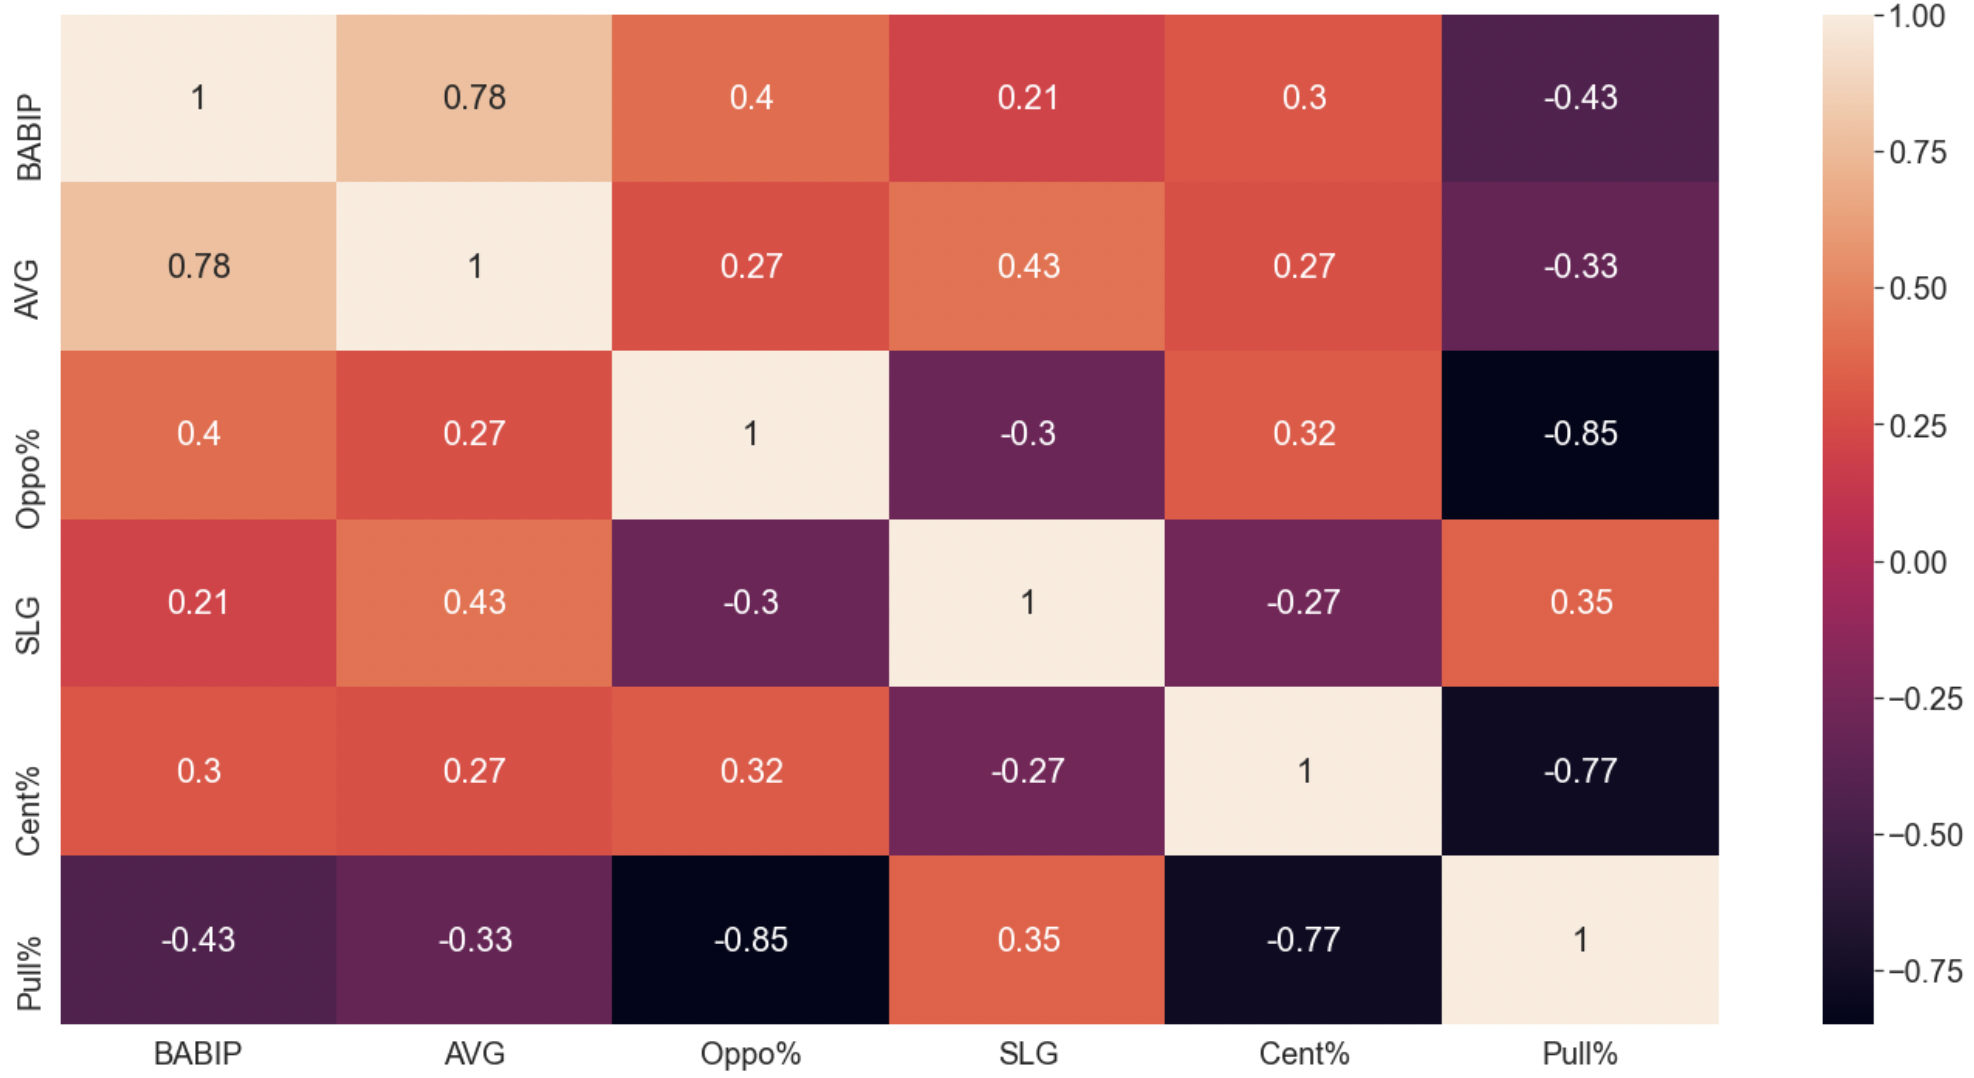
Don’t stare at the correlation chart for too long or you may never get up from your desk chair. Let me instead steer your focus to another table, showing production by contact type:
2022 Production by Batted Ball Direction
|
SLG |
ISO |
wRC+ |
| Cent |
0.423 |
0.125 |
107 |
| Oppo |
0.452 |
0.135 |
120 |
| Pull |
0.588 |
0.267 |
163 |
Among hitters with at least 70 PAs
Contradictory to what the correlation chart makes us believe when looking at the negative correlation between Oppo% and SLG, it looks like so far this season Oppo% are better for slugging than center struck balls in play. My hypothesis about balls knocked down the line driving those extra-base hits stands. Here’s an example:
As opposed to this ball hit right up the middle into a strategic defensive alignment:
Somehow, we’ve made it this far without talking about the shift, but I won’t dive into that today. Clearly, it must have an impact. If a pull shift is on and a hitter goes oppo, that’s great. But it’s not necessarily the norm. Wander Franco leads the league in hits when going oppo against a traditional shift with 12. He has 38 hits in total.
So does anything that I’ve laid out here today help us understand if going oppo more often brings in more hits? Not really. One of the biggest reasons for that, I believe, is that the league adjusts. If you beat the shift too many times, you stop getting shifted on and it’s harder to get a soft, oppo hit. To drive this point home, I used the same data that built out my feature importances on a more standard logistic regression model. I controlled for multicollinearity (which I know FanGraphs readers love) and passed in the resultant variables, again, targeting a binary hit or not hit variable and Oppo% was found to have a p-value of 0.485 making it above a 0.05 threshold and therefore an insignificant predictor. The variables that were found to be significant? Zone% and EV.
So, today (or maybe tomorrow), when you go to make your Beat The Streak picks, don’t bank on hitters who go oppo. Just try to enjoy the visual that comes from a hitter going oppo. Instead, look for players who barrel and hit the snot out of the ball, and who get pitches in the zone. But, then again, doing something like this will play:



