Hit Model Experimentation
Choose one batter to get a hit in tomorrow’s games. You can choose any batter you’d like. This game is simple. This game is called Beat the Streak. This game is hard. The trick is that you need to do it 56 times in a row. As of this writing, there have been 743 games played and 27,440 at-bats recorded in 2022. You can only choose one per day, however, and currently, the leader of the Beat the Streak challenge has chosen 29 consecutive hitters to hit. They are just over halfway there. I enjoy playing this game, but it can be really demoralizing, and I’m just doing it from my couch, relying on other people to get a hit. I can’t imagine what it’s like to have a stadium full of people yelling at you and then actually trying to get a real hit. I’ve written a few times about a model I’m using to aid in the choosing of my daily picks, but I’m starting to wonder if there’s a better way. It would be nice to just look at one or two metrics that help decide, rather than running a daily model, merging matchups, and splicing in park factors. In this post, I’ll walk through an experimental process that simply asks the question, what 2022 season statistics from the leaderboards here at FanGraphs can help us choose likely hitters.
The model I currently use focuses on starting pitcher/hitter matchups. It focuses highly on a hitter’s average launch angle, and average exit velocity and how well those metrics align with a specific pitch (release points and VAA) on a per-day matchup. The thinking is that the model will pick up on a hitter’s bat path and how well it matches up with individual pitcher approaches. I’ve outlined the complications in this process before, namely creating synthetic data that simulates the likely outcomes of these matchups, but it’s also clear that a more generalized approach may be better. For example, I do all this work to simulate starting pitcher vs. hitter matchups and then the starting pitcher exits the game after three innings. For the rest of the game, you’re basically back to random chance. In addition, because of this bat path/pitcher path matchup, the model spits out some, let’s just say, interesting picks. Ben Gamel appears often as a high hit probability guy. It’s not too crazy, though, Gamel is hitting above the MLB average (currently .232) with his .275 batting average. And speaking of average, you’ll notice that it is the main metric used by Beat the Streak’s suggestion interface when making your daily pick. Here’s an example of today’s (5/5/2022) top suggestion from mlb.com/play.

When in doubt, pick Juan Soto. His .258 batting average on the season hitting in Colorado seems like a decent pick to me. If you were thinking of this from a completely probabilistic standpoint, you would probably use batting average. But that “78% chance to hit” makes it seem as if the people at mlb.com/play have internal models they’re using. My guess would be that they have one less-than-perfect model they display to the public and one model they don’t display that provides slightly more lift, but I’ve been guilty of pessimism before.
Now let’s get into the experimentation of building a more generalized model portion of the post. Rather than looking for hitter/pitcher matchups, this time around, I grabbed leaderboard data (batted ball, plate discipline, and statcast with a 0 PA threshold) for the 2022 season through April 25th. I then merged in hit data from the very next day, April 26th. Any player who did not record an at-bat on that day was dropped from the dataset. Then I used a machine-learning algorithm to train on that dataset and learn what season stats correlated with the most hits on that day. For modeling purposes, I ignored hitters who recorded multiple-hit games and just marked them as getting a hit on that day since I needed a binary target. Next, I fed all that data (which is simply not enough, and a random forest model is total overkill) into the model and looked at the variable importance:
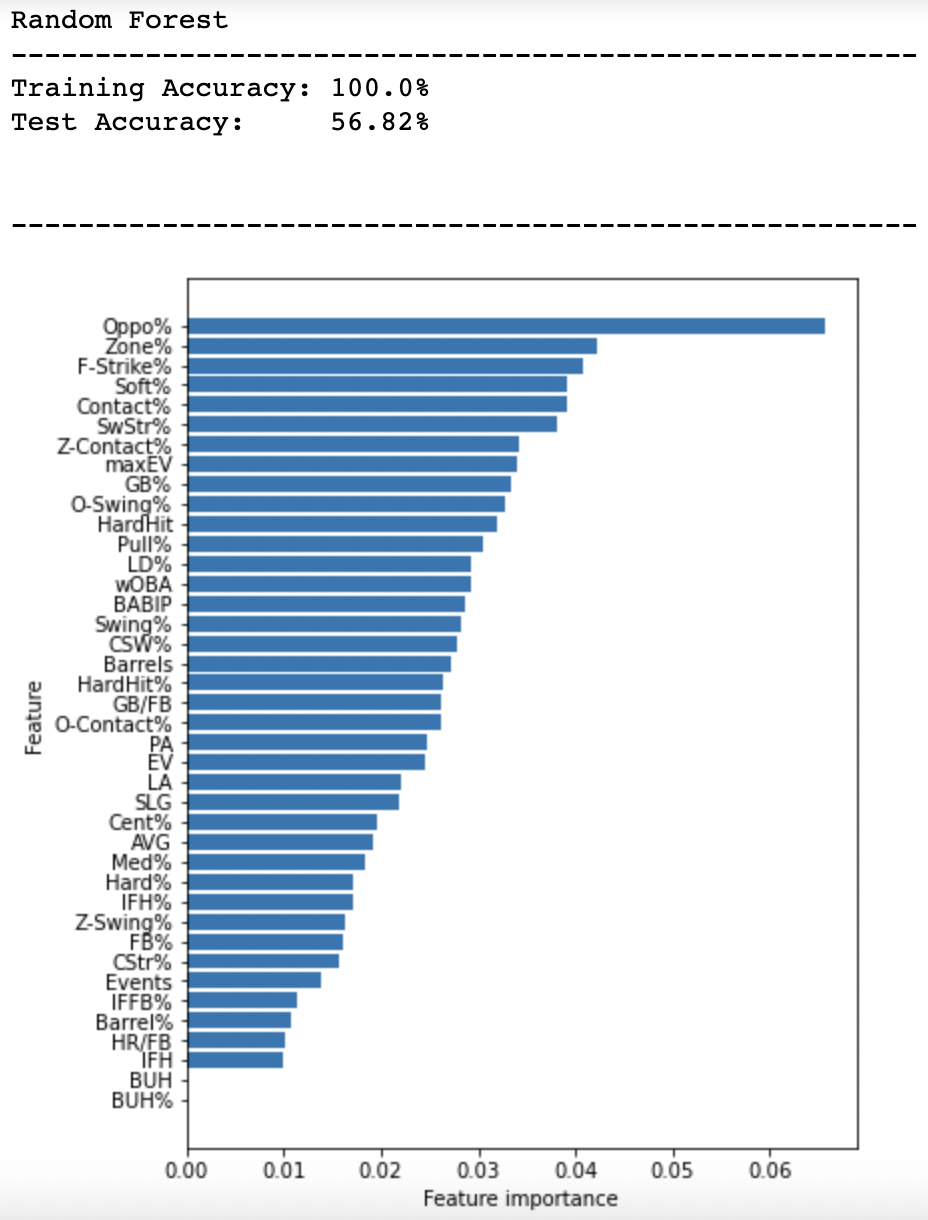
With more data, we should expect these variable importances to change, but I believe some of what I see in this small sample. The model says that one of the most important factors in predicting a hit is a player’s Oppo% and I kind of believe that. Hitters who have the ability to go oppo in the modern game are able to plug the gaps and possibly beat the shift. The batters that got a hit in my training data had an average Oppo% of 25%, which is ever so slightly above the league average of 24.6%. However, the maximum Oppo% in the training set, the set that the model learned from, was 40.9%. Let’s look at more determining features to see if they make sense. Here are the top five features, how those who recorded hits and those who did not average out and league average for comparison:
| Training Data – Non-Hitters | Training Data – Hitters | League Average | |
|---|---|---|---|
| Oppo% | 20% | 25% | 25% |
| Zone% | 42% | 42% | 42% |
| F-Strike% | 60% | 59% | 61% |
| Soft% | 14% | 17% | 18% |
| Contact% | 75% | 77% | 76% |
So, does this mean that oppo hitters with higher contact rates who see fewer first strikes are more likely to get hits? Let’s query for hitters who are above league average in all three (Oppo%, F-Strike%, and Contact%, with an added 80 PA threshold) to see who comes out:
| Name | PA | Oppo% | Contact% | F-Strike% | AVG |
|---|---|---|---|---|---|
| Manny Machado | 110 | 29.9 | 78.5 | 56.4 | 0.365 |
| Andrew Benintendi | 91 | 28.8 | 81.2 | 53.8 | 0.354 |
| Josh Bell | 103 | 25.7 | 79.3 | 50.5 | 0.349 |
| Ty France | 113 | 26.4 | 83.9 | 54.0 | 0.333 |
| Mike Trout | 94 | 28.6 | 76.3 | 52.1 | 0.316 |
| Ke’Bryan Hayes | 94 | 31.7 | 84.3 | 58.5 | 0.304 |
| Wander Franco | 101 | 25.6 | 85.0 | 58.4 | 0.302 |
| Luis Arraez | 82 | 28.4 | 91.4 | 45.1 | 0.301 |
| Yandy Diaz | 87 | 35.9 | 88.5 | 50.6 | 0.300 |
| Pete Alonso | 116 | 27.5 | 77.3 | 56.9 | 0.260 |
| Seiya Suzuki | 96 | 37.0 | 81.5 | 58.3 | 0.250 |
| Mookie Betts | 100 | 28.6 | 85.2 | 59.0 | 0.247 |
| Kyle Tucker | 99 | 25.7 | 78.5 | 54.5 | 0.247 |
| Tony Kemp | 92 | 25.7 | 84.0 | 54.3 | 0.235 |
| Harrison Bader | 87 | 27.4 | 80.0 | 52.9 | 0.234 |
| Raimel Tapia | 85 | 29.9 | 77.6 | 54.1 | 0.225 |
| Nicky Lopez | 83 | 40.0 | 79.7 | 54.2 | 0.225 |
| Kyle Farmer | 93 | 30.6 | 83.0 | 60.2 | 0.221 |
| Yuli Gurriel | 85 | 30.4 | 90.6 | 60.0 | 0.220 |
| Austin Nola | 80 | 31.7 | 86.6 | 57.5 | 0.217 |
| Jake Cronenworth | 111 | 33.8 | 88.0 | 60.4 | 0.207 |
| Jesse Winker | 105 | 28.8 | 80.9 | 55.2 | 0.186 |
| Elvis Andrus | 87 | 28.6 | 80.1 | 60.9 | 0.182 |
| Marcus Semien | 107 | 25.6 | 77.4 | 59.8 | 0.179 |
| Spencer Torkelson | 81 | 25.6 | 76.5 | 55.6 | 0.174 |
| Yasmani Grandal | 83 | 28.8 | 79.4 | 57.8 | 0.169 |
| Whit Merrifield | 101 | 26.8 | 78.1 | 54.5 | 0.151 |
This is a long list and has a few hitters whose batting average is not looking too hot. But, the point of this exercise — wait, there is a point? Oh, yea — the point of this exercise was to figure out which season-so-far statistics might be predictive of a player getting a hit the following day. Whether we believe this model or not is another thing. I was expecting wOBA, Barrel%, and HardHit% to be the top features, not Oppo%. Plus, the model’s accuracy was only at 52% when it was shown brand new data, but that’s still an edge! Many model thinking would tell us that the best approach would be to use a few different models layered on top of each other like a Smith Island Cake.
Finally, when I took this season’s stats up until today and used the model to predict hitters, Juan Soto stands a 64% hit probability based on his season so far. Not bad, but well below Beat The Streak’s house model probability of 78% for player suggestions. My guess is that mark layers in the fact that he’s playing at Coors Field. The most likely hitter to keep the streak alive today? Andrew McCutchen, whose current 27.0% Oppo% is at a career-high and Contact% of 78.6% is above league average. According to this new, more generalized model, he has an 82% chance of getting a hit today. Just don’t tell him that.
I’ve got a question: Oppo% having a feature importance like that is obviously interesting, and I’m wondering: does that mean that if you have a high Oppo%, you’re likelier to get a hit than someone with an average Oppo%, and if you have an average Oppo%, you’re likelier to get a hit than someone with a low Oppo%? Or does it mean that if you have a high or low Oppo%, you’re likelier to get than someone with an average Oppo%? Great piece, really enjoyed it.
It’s a good question. Unfortunately, this shows how untrustworthy my model is, mostly because it was trained on one particular day of baseball. It’s hard to generalize and that’s why I mentioned the issue with such a small amount of data. When I went back and re-trained using a larger dataset, Oppo% decreased in importance but was still important.
As far as the Oppo% relating to the likeliness of a hit, it’s hard to say given the random forest model’s interpretability. If I used logistic regression, then I could look at the coefficients and be more specific. Maybe I’ll give it a try in my next post…