Who Plays in Doubleheaders?
This past weekend, I was trying to decide how much to lean into Oakland’s nine-game week. I didn’t know if just the regulars would start in all the games or should I focus on some of the lesser bats (there are many of them on Oakland). I figured this question would come up several times during the season, so I decided to get an overall view of who sits and plays.
I’ll apologize upfront for most of the article being a big data dump. If anyone is not interested in the numbers, just jump to “Conclusions” for my take on the information.
Data Dump
For the following data, I examined only 2022 doubleheaders (num = 28). I divided the dataset up in as many possible ways that as my Twitter followers and myself could think of.
I’ll start out with an obvious one, position.
| Position | Started 1 Game | Started Both Games |
|---|---|---|
| C | 50 | 3 |
| 1B | 18 | 19 |
| 2B | 18 | 21 |
| SS | 12 | 20 |
| 3B | 13 | 23 |
| RF | 20 | 17 |
| CF | 21 | 19 |
| LF | 18 | 18 |
| DH | 10 | 22 |
No position sticks out besides catcher. Only three times has the same catcher started both games.
Age is up next with the thought that older players may need more of a break.
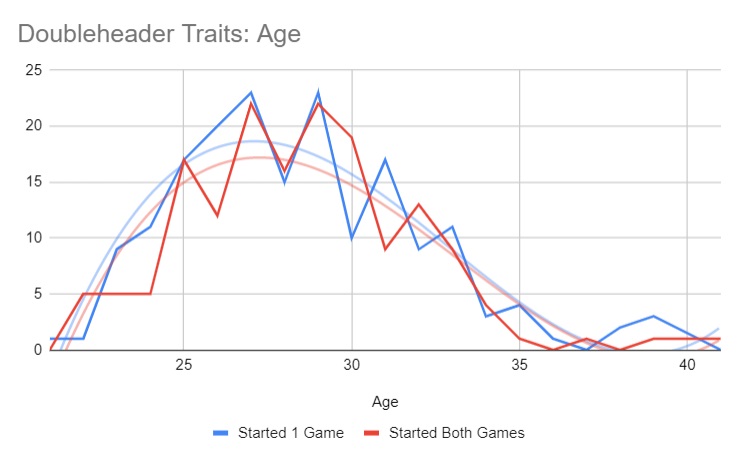
While I expected age to be a factor, it wasn’t. The average age of those with one game is 28.4 years and for those with two games is 28.7 years. A non-factor.
Next up is the lineup position. I needed to pull a couple of little magic tricks for players who had two different spots. First, I averaged both values. Then if the value had a half value, I averaged up. For example, if a hitter hits third and fourth, his lineup position would be four (3.5 rounded up to 4).
| Lineup Position | Started 1 Game | Started Both Games |
|---|---|---|
| 1 | 10 | 19 |
| 2 | 10 | 21 |
| 3 | 8 | 24 |
| 4 | 6 | 25 |
| 5 | 26 | 23 |
| 6 | 16 | 17 |
| 7 | 23 | 15 |
| 8 | 37 | 12 |
| 9 | 44 | 6 |
Now we are cooking with propane. The top four spots (i.e. good hitters) get multiple starts. Those who doubled up had an average lineup spot of 4.2 and those with one start were at 6.4. I’d focus on hitters in any of the top four (or five) are available.
On the same theme, here are the average projected Steamer) and actual in-season OPS for the two groups. I included the standard deviation.
| Hitting Talent | Started 1 Game | Started Both Games |
|---|---|---|
| Avg Projected OPS (Steamer) | .720 | .779 |
| Std Dev Projected OPS | .060 | .067 |
| Avg Actual OPS | .616 | .700 |
| Std Dev Actual OPS | .179 | .148 |
As expected with the lineup positions, the better players play more. It’s science.
One interesting note is the standard deviation on the Steamer projected values. A 60-point variation on deviation isn’t that much. Not one single hitter with a projected OPS under .650 started both games (n=162). Only 13 (8%) had a projection under a .700 OPS. Switching to those with single starts, only 55 of the 180 players (31%) had an OPS over .750. At a projected OPS of .800 or better, the rate drops to 13%.
Simply, get the best baseball hitter (the stats might now match up with the league settings).
Finally, I looked into the player’s health. For this, found the average number of MLB IL days from the previous season. There is a small difference between those only with one game at 17.6 IL days and those with both averaging 14.8 days. A tiebreaker if everything else is consistent.
Conclusions
- Besides catchers, roster good hitters (projected OPS over .750) who are hitting at the top of the lineup.
- If two hitters are similar, use injury history as a tiebreaker.
Now, that’s it for doubleheaders. I think next on the list will be a look at how to find hitters to stream for steals unless something else comes up.
Jeff, one of the authors of the fantasy baseball guide,The Process, writes for RotoGraphs, The Hardball Times, Rotowire, Baseball America, and BaseballHQ. He has been nominated for two SABR Analytics Research Award for Contemporary Analysis and won it in 2013 in tandem with Bill Petti. He has won four FSWA Awards including on for his Mining the News series. He's won Tout Wars three times, LABR twice, and got his first NFBC Main Event win in 2021. Follow him on Twitter @jeffwzimmerman.
Good stuff, dude. I have believed or suspected that for years, but without a serious stat background, I have never been Sure. Thank you.
I wonder how many of the singly starting catchers <i>also</i> hit lower in the order? That might be affecting your conclusions in that particular data set.
There’s also the matter of handedness when the two starting pitchers are different
I expect that you’ll run into lots of SS problems here, and might want to use older seasons as well.
I wonder if team record plays a role. The better teams may use the DH to rest their better players, while the weaker teams may have no one else to run out there, especially at the top of the lineup.