Justin Mason’s Baseball Chat – June 16, 2025
Here is today’s chat transcript: Read the rest of this entry »
Here is today’s chat transcript: Read the rest of this entry »
Daily SP Chart archive
The chart includes their performance for 2025, their opponent’s wOBA rank versus the pitcher’s handedness from this year so far, my general start/sit recommendation for 10-team, 12-team, and 15-team (or more) leagues, and then a note about them. Obviously, there are league sizes beyond those three so it’s essentially a shallow, medium, deep. If a pitcher only has an “x” in 15-team, it doesn’t mean there’s no potential use in 10s and 12s, but it’s a much riskier stream for those spots.
These are general recommendations, and your league situation will carry more weight whether you are protecting ratios or chasing counting numbers. This is for standard 5×5 roto leagues. The thresholds for H2H starts are generally lower, especially in points leagues so I thought there would be more valuable focusing on roto.
—
| 7:31 |
: Welcome.
|
| 7:32 |
: Here are the winning bids for the two 15-team Tout Wars teams.
|
| 7:32 |
:

|
| 7:33 |
: Projections show very similar numbers for Josh Smith and Matt Shaw for the rest of this year, with an edge to Shaw on the bases. Meanwhile results 10 weeks in show Smith the better option in all categories except SB. Is Smith a clear upgrade for the rest of this year (except SB)? Who do you like more long term in a standard 5×5 deep league keeper format?
|
| 7:34 |
: I checked my valuations and I have Smith way ahead of Shaw
|
| 7:34 |
: who benefits the most in the BOS lineup w/no Devers?
|
In the article, I cover the players using CBS’s (about 40% or less initial roster rate) and Yahoo’s ADD/DROP rates. Both hosting sites have the option for daily and weekly waiver wire adds. CBS uses a weekly change while Yahoo looks at the last 24 hours. Yahoo is a great snapshot of right now, while CBS ensures hot targets from early in the week aren’t missed. The players are ordered for redraft leagues by my rest-of-season preference, grouped by starters, relievers, and hitters. Read the rest of this entry »

Angels
• The second base circle jerk could be over with the promotion of Christian Moore. I’m guessing third base will continue to be a revolving cast of characters. Read the rest of this entry »

Below are the latest playing time changes for pitchers in the past week, with a couple of brutal pieces of news — Tommy John surgery for both Corbin Burnes and Jackson Jobe — the unfortunate headliners this week.
| Name | Team | Old % of Remaining GS | New % of Remaining GS | PT Change | Reason |
|---|---|---|---|---|---|
| Chad Patrick | MIL | 7% | 14% | 7% | Sticking in rotation with Civale move to bullpen |
| Mike Vasil | CHW | 1% | 7% | 6% | Appears to be getting stretched out |
| Tony Gonsolin | LAD | 15% | 10% | -5% | Elbow discomfort (no UCL damage) |
| Bryse Wilson | CHW | 5% | 0% | -5% | DFA’d |
| Cole Ragans | KCR | 18% | 13% | -5% | Strained rotator cuff (getting second opinion, would guess this keeps going down) |
| Bryce Miller | SEA | 17% | 11% | -6% | Elbow inflammation |
| Ryan Weathers | MIA | 16% | 8% | -8% | Lat strain |
| Jackson Jobe | DET | 10% | 0% | -10% | Tommy John surgery |
| Aaron Civale | MIL | 16% | 5% | -11% | Moved to bullpen |
| Corbin Burnes | ARI | 12% | 0% | -12% | Tommy John surgery |
| Name | Team | % Chg. In Proj. RP IP | Reason |
|---|---|---|---|
| Aaron Civale | MIL | 450% | Moved to bullpen |
| José Ruiz | ATL | 260% | Claimed from Phillies |
| Tayler Scott | ARI | 180% | Brought up to help beleagured bullpen |
| Tyler Alexander | CHW | 178% | Signed after Brewers DFA, should eat innings |
| Nestor Cortes | MIL | 130% | Will there be a rotation spot for him when healthy? |
| Bryce Jarvis | ARI | 118% | See Scott, Taylor |
| Andre Granillo | STL | 54% | Earned first MLB callup after dominating Triple-A |
| Ryan Burr | TOR | -31% | Has stalled out a bit in progression from shoulder injury |
| Fraser Ellard | CHW | -32% | Transferred to 60-day IL |
| Beau Brieske | DET | -35% | Optioned to Triple-A after being blitzed by Orioles |
| Justin Martinez | ARI | -39% | UCL sprain, seeking second opinion 🙁 |
| Jake Cousins | NYY | -48% | UCL injury of some kind |
| Michael Soroka | WSN | -49% | Pitching well enough to stick in rotation |
| Ryne Nelson | ARI | -50% | Should stay in rotation a while with Burnes hurt |
| Jacob Misiorowski | MIL | -52% | Certainly looking like a starter! |
| Mike Vasil | CHW | -64% | Being stretched out |
| Bryse Wilson | CHW | -65% | DFA’d |
| Matt Bowman | BAL | -69% | DFA’d |
| Carlos Hernández | PHI | -70% | DFA’d |
While the NFBC Main Event garners most of the attention, there are a handful of leagues with even larger entry fees ($2.5K to $15K). They are named “High Stakes Leagues,” and there are eleven of them. With so much money on the line, these fantasy managers try to gain any advantage. Most of the time, these managers will be a week or two ahead of everyone else on their adds. Here are the players and some information on the ones added in five or more leagues.
Ronny Mauricio (11): In eight games since being recalled from AAA, he has started in seven games while batting .208/.296/.375 with 1 HR and 2 SB. The lack of production stems from a 50% GB and 30% K%. He’s been struggling against slower secondaries.
Pitch: SwStr%
Changeup: 27%
Splitter: 20%
Curveball: 19%
While there is some swing-and-miss in his game, his power stands out with a 13% Barrel%, 44% HardHit%, and 90.5 mph avgEV. Batters with similar overall skill sets to Mauricio are Johan Rojas and Noelvi Marte. Add and hope he makes contact eventually.
David Fry (9): Fry slots into the short side of the DH platoon. Seven of the nine games since he came off the IL were against lefty starters (22 PA vs LHP, 3 vs RHP). They have eaten him up. So far, he’s batting .143/.280/.286 (44% K%) with 1 HR and 1 SB.
His arm isn’t healed enough to catch and hasn’t hit lefties yet, so he feels like dead weight. He has three lefties on the schedule for next week, so maybe give him one more chance before moving on.
Tyler Freeman (9): Started in nine straight games, mainly batting ninth. So far, he’s been fine while batting .303/.372/.455 with 1 HR but 7 SB. In roto leagues, those stolen bases are gold. Hopefully at some point the Rockies management pulls their heads out of their asses and moves Freeman up the lineup, but I would count on either happening.
Ryan Ritter (7): Ritter seemed like a solid add. In AAA, he hit .305/.413/.635 with 16 HR and 3 SB in 245 PA (two triples so far). While he only had a 20% K% in AAA, it has ballooned to 38% in the majors with pitchers feeding him secondaries (41% fastballs). Here are his AAA per-pitch swing-and-miss numbers.
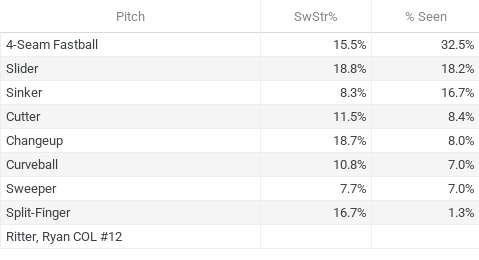
He’s seen more sliders than any other pitch with a 32% SwStr%.
Besides his struggles at the plate, Ezequiel Tovar will return from the IL, thereby forcing Ritter to move to a new position or back to AAA.
Kyle Teel (6): Since the 23-year-old was promoted, he started all five games while batting .250/.471/.250 (3 H, 5 BB) in 17 PA. His managers hoped for a continuation of his AAA stats (8 HR, 7 SB, .295 AVG in 213 PA).
He’s only seen fastballs 34% of the time with a swinging-strike rate of 20% or higher against sliders, curves, and changes. His 29% K% (16% SwStr%) is not debilitating, but it will hold him back.
Rosterable in all two-catcher formats based on the playing time prospect status.
Parker Meadows (6): Since coming off the IL, Meadows is hitting .161/.278/.258 (.217 BABIP) with 0 HR but 2 SB. Besides the low BABIP, all of his previous metrics line up. I was hoping he’d lower his launch angle, but he’s still trying to air every ball out (46% FB%).
The team doesn’t trust him against lefties even though he’s hit lefties (108 wRC+) better than righties (101 wRC+) over his career. He sat the first time the team faced one. The other time, he hit ninth.
Hopefully, he can stay healthy and provide 20/20 production over the rest of the season.
Nick Gonzales (6): Started in eight of nine games since coming off the IL while batting .242/.278/.455 with 1 HR. Solid middle-infield bench bat.
Jac Caglianone (5): In most instances, managers rostered Jeffrey Allen weeks ago. He’s not been great but also not a complete zero (.242/.242/.303).
Jacob Melton (5): The top prospect is starting (eight of nine games) but struggling to hit (.185/.241/.185) with the culprit being a 41% K%. Seems outmatched with limited upside.
Jerar Encarnacion (5): No stat line will positively stand out with a .077 BABIP. Besides having no batted ball luck, in seven games since coming off the IL, he’s only started in four of them. A pass for now.
Sawyer Gipson-Long (11): The 27-year-old righty debuted last week and is now in the middle of a two-start week. Over three levels during his rehab, he posted a 2.20 ERA (3.01 xFIP), 0.98 WHIP, and 8.8 K/9. The results have continued with a 4.32 ERA (3.09 xFIP), 1.08 WHIP, and 8.6 K/9.
Besides focusing on the least predictive stat (ERA), everything so far points to him being an above-average pitcher. The STUPH models love him with a 64 botOverall (2.78 batERA) and 105 Pitching+ (3.78 Pitch+ERA). His 15.7% SwStr% would rank third among qualified starters behind Tarik Skubal and Dylan Cease. His 26% Ball% points to a 1.0 BB/9.
I’m guessing I’ll have Gipson-Long as the top add in this week’s waiver wire report.
Note. The formula I use to convert Pitching+ to an ERA equivalent is: Pitch+ERA = -0.067 * Pitching+ + 10.815
Brandon Walter (8): In two starts, the 28-year-old lefty has been solid with a 1.64 ERA (2.45 xFIP), 0.91 WHIP, 58% GB%, and 8.2 K/9. He posted similar stats in AAA with a 2.08 ERA (3.63 xFIP), 0.76 WHIP, 60% GB%, and 9.3 K/9.
In the small sample, only the core stats are important, and they look good. His STUPHs are a 57 botOverall (3.46 ERA) and 104 Pitching+ (3.85 ERA). His 31% Ball% points to a 1.9 BB/9. While his fastball clocks in at only 92 mph, he has decent secondaries, a slider (15% SwStr%) and change (14% SwStr%), to get lefties and righties out. While his sinker hasn’t missed many bats (4% SwStr%), it does have a 75% GB%.
Walter needs to be added in all formats to see if the results continue.
Hunter Dobbins (6): Dobbins is a tough pitcher to value with him leaving the rotation and then rejoining it. In the last three starts, he has a 3.5 K/9 and 2.8 BB/9. Before that, it was a 7.9 K/9 and 1.5 BB/9.
He’s experiencing some issues with his release point as seen from his game plot.
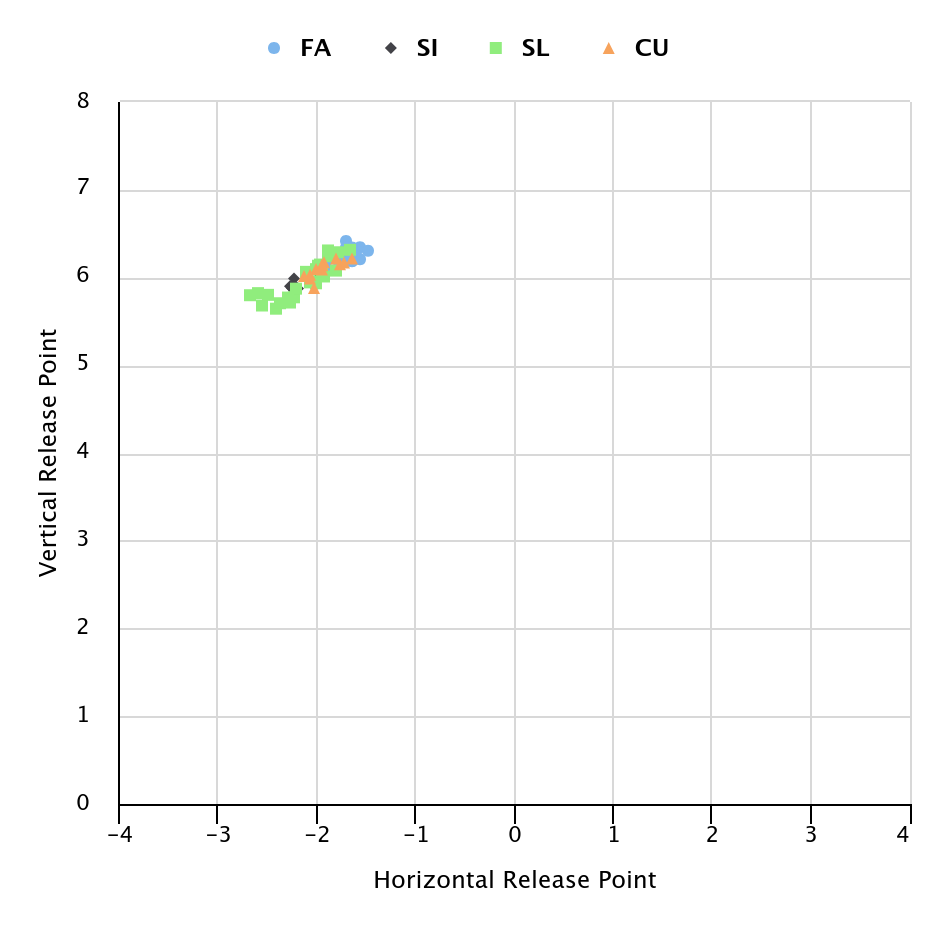
His slider is released about a foot over compared to his fastball.
There was something there, and there still could be, but we can’t know for sure. None of the managers who added Dobbins started him against the Yankees, so they are going with a wait-and-see approach.
Mitch Spence (5): He was scheduled to face the Angels and did his best with 4 K, 0 BB, and 0 ER in 5 IP. Under the hood, things look great with a cutter (9% SwStr%, 48% thrown), slider (21% SwStr%), and curve (20% SwStr%). There are some questions about him staying in the rotation.
Justin Wrobleski (5): He was promoted to start on Wednesday but didn’t get the start or an appearance in the game. I have no idea what his role is going forward.
Casparius is more than an opener. Dave Roberts envisions him being able to go around 3 innings.
Justin Wrobleski is available to pitch, but not a guarantee he gets into the game.
— Dodger Blue (@DodgerBlue1958) June 11, 2025
I’ve go no idea on how to value him right now.
Trevor Williams (5): I was part of these adds. With little pitching available, his next two starts were against Miami and Colorado in Washington. While Williams has a 5.91 ERA (.327 BABIP, 60% LOB%), his ERA estimators are at 4.00.
Mitchell Parker (5): Parker gets the same two opponents as Williams, but Parker’s is worse. His 6.0 K/9 is the 9th worst among 79 qualified starters, and his 3.6 BB/9 is too high for someone with so few strikeouts. His ERA and estimators hover around 4.50.
Bryce Elder (5): These adds were because of Elder’s home start against Colorado. On the season, Elder has shown high-3.00 ERA talent, so a reasonable dart throw against the Rockies.
Randy Rodríguez (7): In 29 IP, he’s been elite with a 0.61 ERA (1.69 xFIP), 0.61 WHIP, and 13.2 K/9. So far, he has 3 Wins and 1 Save.
| Name | Leagues | High Winning Bid | Low Winning Bid. |
|---|---|---|---|
| Ronny Mauricio | 11 | 183 | 51 |
| Sawyer Gipson-Long | 11 | 63 | 14 |
| David Fry | 9 | 48 | 3 |
| Tyler Freeman | 9 | 26 | 1 |
| Brandon Walter | 8 | 27 | 1 |
| Ryan Ritter | 7 | 11 | 5 |
| Randy Rodriguez | 7 | 8 | 4 |
| Kyle Teel | 6 | 166 | 1 |
| Parker Meadows | 6 | 150 | 56 |
| Nick Gonzales | 6 | 19 | 1 |
| Hunter Dobbins | 6 | 17 | 1 |
| Jac Caglianone | 5 | 523 | 173 |
| Bryce Elder | 5 | 67 | 7 |
| Jacob Melton | 5 | 53 | 7 |
| Mitch Spence | 5 | 23 | 1 |
| Mitchell Parker | 5 | 19 | 3 |
| Justin Wrobleski | 5 | 17 | 6 |
| Jerar Encarnacion | 5 | 17 | 4 |
| Trevor Williams | 5 | 13 | 1 |
| Michael McGreevy | 4 | 37 | 32 |
| Wenceel Perez | 4 | 35 | 8 |
| Dylan Lee | 4 | 33 | 1 |
| Ramon Laureano | 4 | 28 | 11 |
| Chris Martin | 4 | 27 | 3 |
| Jurickson Profar | 4 | 24 | 6 |
| Colin Rea | 4 | 20 | 3 |
| Luke Raley | 4 | 19 | 8 |
| Mike Burrows | 4 | 18 | 1 |
| Otto Kemp | 4 | 17 | 1 |
| Quinn Priester | 4 | 17 | 1 |
| Ben Casparius | 4 | 16 | 7 |
| Shelby Miller | 4 | 16 | 3 |
| Bailey Falter | 4 | 8 | 1 |
| Henry Davis | 4 | 8 | 1 |
Daily SP Chart archive
The chart includes their performance for 2025, their opponent’s wOBA rank versus the pitcher’s handedness from this year so far, my general start/sit recommendation for 10-team, 12-team, and 15-team (or more) leagues, and then a note about them. Obviously, there are league sizes beyond those three so it’s essentially a shallow, medium, deep. If a pitcher only has an “x” in 15-team, it doesn’t mean there’s no potential use in 10s and 12s, but it’s a much riskier stream for those spots.
These are general recommendations, and your league situation will carry more weight whether you are protecting ratios or chasing counting numbers. This is for standard 5×5 roto leagues. The thresholds for H2H starts are generally lower, especially in points leagues so I thought there would be more valuable focusing on roto.
—
Mariners
• Dominic Canzone will be part of the right field rotation.
Prior to the game, manager Dan Wilson noted that Canzone would be “in the mix” for at-bats as part of a right field rotation moving forward.