Archive for Featured

Bullpen Report: May 27, 2023

The 2023 version of the Bullpen Report includes five different sections, as well as the closer chart, which can be found at the bottom of the page.

We will always include a link to the full Closer Depth Chart at the bottom of the Bullpen Report each day. It’s also accessible from the RosterResource drop-down menu and from any RosterResource page. Please let us know what you think.

  1. Notable Workloads: Primary closers or valuable members of a closer committee who have been deemed unavailable or likely unavailable for the current day due to recent workload.
  2. Injury News
  3. Outlier Saves: Explanation for a non-closer earning a save during the previous day.
  4. Committee Clarity: Notes on a closer committee that clarify a pitcher’s standing in the group.
  5. Losing A Grip: Struggling closers who could be on the hot seat.

The “RosterResource” link will take you to the corresponding team’s RosterResource depth chart, which will give you a better picture of the full bullpen and results of the previous six days (pitch count, save, hold, win, loss, blown save).

Click HERE to view the full Closer Depth Chart.

Read the rest of this entry »


Choose Your Starters Wisely: Updating Head Canons

We’re nearly a third of the way through the season and the fantasy landscape is littered with piles of pitching calamities. With waiver wires already increasingly dry with decent talent, those looking for relief from a stream might more and more have to rely on playing the man, more so the cards when trying to find viable matchups, Adjusting our slider on quality of pitchers in order to pounce on the worst teams, whether overall or against a particular hand. Read the rest of this entry »


The Sleeper and the Bust Episode: 1180 – Week 10 2-Start Pitchers

5/26/23

The latest episode of “The Sleeper and the Bust” is live. Support the show by subscribing to our Patreon!!

Follow us on Twitter

PATREON

INJURIES/TRANSACTION NEWS

WEEK 9 2-STARTS

Read the rest of this entry »


Lineup Analysis (5/26/23)

American League

Angels

Taylor Ward and Mickey Moniak are splitting time in left field.

Luis Rengifo, Gio Urshela, Brandon Drury, and Jared Walsh are sharing three infield spots. Read the rest of this entry »


Waiver Wire & FAAB Report (Week 10)

Updated on Sunday morning. Added a few players and moved a few players around.

Note: Starting today (Friday), my Memorial Day weekend is planned out for me and I’m just along for the ride. Here are my weekly waiver wire ranks and I’ll update them when I have time. I’ll post the updates here at the top and in the excerpt to let people know if/when there have been any changes. I’m going to be very bare-bones with no blurbs, but I’ll add more info as I find time.

In the article, I cover the players using CBS’s (about 40% or less initial roster rate) and Yahoo’s ADD/DROP rates. Both hosting sites have the option for daily and weekly waiver wire adds. CBS uses a weekly change while Yahoo looks at the last 24 hours. Yahoo is a great snapshot of right now while CBS ensures hot targets from early in the week aren’t missed. The players are ordered for redraft leagues by my rest-of-season preference grouped by starters, relievers, and hitters. Read the rest of this entry »


Roto Riteup: May 26, 2023

Smooth like silk:

Read the rest of this entry »


Starting Pitcher Chart – May 26th

Kirby Lee-USA TODAY Sports

Daily SP Chart archive

The chart includes their season performance, their opponent’s wOBA versus the pitcher’s handedness over the last 30 days, my general start/sit recommendation for 10-team, 12-team, and 15-team (or more) leagues, and then a note about them. Obviously, there are league sizes beyond those three so it’s essentially a shallow, medium, deep. If a pitcher only has an “x” in 15-team, it doesn’t mean there’s no potential use in 10s and 12s, but it’s basically a risky stream for those spots.

These are general recommendations, and your league situation will carry more weight whether you are protecting ratios or chasing counting numbers. This is for standard 5×5 roto leagues. The thresholds for H2H starts are generally lower, especially in points leagues so I thought there would be more value focusing on roto. Read the rest of this entry »


What is Too Many Four-Seamers?

The question came up when I examined David Peterson. I wondered if he was getting hit around because he was throwing a ton of subpar fastballs. Today, I’m back-testing the theory.

I had no idea what I was going to find but the results, positive or negative, will help to shape future studies. I examined starters from 2021 and 2022 who threw at least 20 innings (n=201). I limited the time frame to include the STUFFF metrics that have only been around that long. Also, I limited this study to guys who threw their four-seamer more than their sinker. I started with just four-seamers and stayed away from sinkers. The STUFFF metrics are separated based on pitch type so I wanted to stay in one lane.

The narrative behind four-seamers (or any fastball) would be that batters would familiarize themselves with these fastballs. I know that bad fastballs won’t generate as many strikeouts but do they get hit around more, especially if that’s all batters see.

Additionally, I included my pERA values which is only based on if the pitch misses (SwStr%) and the direction it is hit (GB%). These values might seem high but I don’t scale the value based on pitch type and fastballs generate fewer swings-and-misses than non-fastballs. It’s time to start the journey.

First, I grouped the pitchers by how far their ERA estimator was from their actual ERA. Here are the results.

Four-Seamer Fastball Metrics Depending on ERA-FIP
ERA-FIP > 1 Between -1 and 1 < -1
BABIP .322 .286 .241
HR/9 1.5 1.2 1.3
K% 18.7% 21.6% 22.6%
FF% 42.5% 37.8% 34.4%
FF%/(FF%+SI%) 79.1% 78.4% 71.1%
FFv 93.1 93.1 92.9
wFF/C -1.26 -0.21 0.12
Stuff+ 86.4 91.9 94.9
Bot+ 47.6 52.4 50.0
pERA 4.82 4.67 4.68


Four-Seamer Fastball Metrics Depending on ERA-xFIP
ERA-xFIP > 1 Between -1 and 1 < -1
BABIP .310 .287 .254
HR/9 1.8 1.2 1.0
K% 18.9% 21.7% 22.9%
FF% 39.4% 38.2% 35.1%
FF%/(FF%+SI%) 77.9% 78.2% 76.9%
FFv 93.0 93.2 92.9
wFF/C -1.57 -0.19 0.76
Stuff+ 87.2 91.3 99.1
Bot+ 48.8 52.2 53.5
pERA 4.88 4.68 4.50


Four-Seamer Fastball Metrics Depending on ERA-SIERA
ERA-SIERA > 1 Between -1 and 1 < -1
BABIP .307 .287 .264
HR/9 1.9 1.2 0.9
K% 18.9% 21.8% 21.6%
FF% 39.7% 38.0% 36.6%
FF%/(FF%+SI%) 79.6% 77.5% 79.2%
FFv 92.8 93.2 92.7
wFF/C -1.51 -0.21 0.58
Stuff+ 87.4 92.0 93.4
Bot+ 49.2 52.4 51.7
pERA 4.87 4.67 4.58


Four-Seamer Fastball Metrics Depending on ERA-xERA
ERA-xERA > 1 Between -1 and 1 < -1
BABIP .309 .286 .276
HR/9 1.8 1.2 1.3
K% 18.9% 21.9% 19.8%
FF% 41.0% 38.0% 35.7%
FF%/(FF%+SI%) 80.1% 78.8% 70.8%
FFv 92.5 93.2 92.9
wFF/C -1.61 -0.13 -0.39
Stuff+ 85.2 92.6 88.6
Bot+ 47.1 52.7 49.2
pERA 4.83 4.65 4.86

There is a lot to unpack, but the biggest takeaways for me are

  • The pitchers with higher than expected ERA threw more fastballs on average.
  • The pitchers with higher-than-expected ERA generally had worse STUFFF.
  • The pitchers with lower-than-expected ERA mixed in more sinkers.
  • Fastball velocity didn’t matter. It still remains linked to strikeouts.

Here are two more groupings by HR/9 and BABIP.

Average Four-Seamer Fastball Metrics Depending on HR/9
HR/9 > 1.7 Between 0.7 and 1.7 < .0.7
BABIP .294 .285 .293
HR/9 2.2 1.2 .6
K% 18.1% 21.8% 23.8%
FF% 39.7% 37.7% 38.8%
FF%/(FF%+SI%) 79.3% 78.2% 73.8%
FFv 92.466 93.156 93.943
wFF/C -1.72 -.09 .40
Stuff+ 85.7 92.5 92.3
Bot+ 49.3 52.1 53.8
pERA 4.99 4.65 4.49


Average Four-Seamer Fastball Metrics Depending on BABIP
BABIP > .317 Between .253 and .317 < .253
BABIP .334 .284 .237
HR/9 1.3 1.3 1.2
K% 20.1% 21.4% 22.9%
FF% 40.5% 37.8% 36.0%
FF%/(FF%+SI%) 75.5% 78.9% 76.9%
pfxvFA 93.212 93.112 92.941
pfxwFA/C -.76 -.32 .50
Stuff+ 85.6 92.1 96.8
Bot+ 51.1 52.1 51.5
pERA 4.75 4.69 4.59

The results are a little messier but the conclusions are close to being the same.

  • The batters who got hit around threw a few more fastballs on average.
  • The pitchers who got hit around had worse STUFFF.
  • Fastball velocity or sinker/four-seam mix didn’t matter to over-or-under-perform batted ball metric.

The two major factors seem to be the usage rate and the STUFFF metrics.

After eyeballing the above tables, it seems like a usage under 40% along with a Stuff+ value under 90 and a Bot Stuff under 50. To see if these benchmarks work, I took the 2023 starters and grouped them.


2023 ERA-ERA Estimators for Starters Throwing Lots of Bad Four Seamers
Four-seam traits FIP xFIP SIERA
Usage >40%, BotStuff <50 -0.10 -0.19 -0.03
Everyone else 0.06 0.07 0.04
Usage >40%, Stuff+ <90 -0.12 0.19 0.17
Everyone else 0.06 0.06 0.04

The pitchers I expected to perform worse actually performed better. That’s suboptimal. I did find out what possibly didn’t work but it would be nice if the values were predictive. I ran one last comparison for future reference, here are the pitchers’ stats for if their ERA is above or below their ERA estimators so far this season.


2023 Stats for Grouped by ERA-ERA Estimator Above or Below Zero
ERA minus estimator FF% wFA/C BABIP HR/9 botStf FF Stf+ FF
ERA-FIP >0 40.2% -0.53 .320 1.4 47.9 93.6
ERA-FIP <0 42.6% 0.17 .268 1.3 49.7 96.6
ERA-FIP >0 41.2% -0.80 .318 1.6 48.0 92.7
ERA-FIP <0 41.5% 0.47 .270 1.0 49.5 97.6
ERA-SIERA <0 40.7% -0.86 .318 1.6 47.3 92.2
ERA-SIERA >0 42.1% 0.53 .270 1.0 50.3 98.2

The usage doesn’t matter this season but the STUFFF values show some signs worth continued investigation.

That’s enough failure for one article. Here is what I see needs to be done next.

  • Sinkers will be included by weighting the results by usage. David Peterson mixes in some (bad) sinkers so maybe the combination brings more clarity.
  • I’m going to attempt a fastball grade that takes into account the predictive values (STUFFF), pitch results (pERA), and batted ball results (pVAL). From some past work, I wasn’t a huge fan of pVALs but I think they might help show the possible disconnects between shape and results (e.g. ability to hide the ball).

While I didn’t come to any groundbreaking information, I found what not to believe and hopefully, I can improve the future results.


Jolt’s Hit Picks for May 25th, 2023

JOLT is model that I have developed to aid in the selection of players who are most likely to get a hit in order to build a hit streak while playing MLB Play’s “Beat the Streak”. The process is complicated and has gone through too many iterations to count, but it is now the closest it has ever been to an automated daily process. The model has very little to do with current player performance, though I bring that in after the model makes predictions to thin out the audience, and more to do with bat path and pitch plane. SwingGraphs supplies some great data that I’ve incorporated into my model and I’m using vertical approach angle in relation to swing and batted ball metrics to determine which hitter/pitcher matchups are best suited for the hitter and their particular swing.

Let’s make a few things clear. First, these predictions are experimental. I plan on sharing predictions once every other week here, though I may start pushing daily predictions to twitter, and I’ll keep track of how my predictions have actually played out. Second, MLB Play already has really good hit predictions, so I’ll include that model’s hit probability too, though I’m sure the models are very different. They also have an incredible dashboard that you could spend hours viewing. Third, if you play “Beat the Streak” and you get to a point where you are one pick away from winning $5.6 Million dollars, don’t rely solely on JOLT. Finally, these predictions can easily be applied to your fantasy baseball roster when considering sit/start decisions. Now, let’s take a look at five hitters JOLT predicts as most likely to get a hit:

JOLT Picks: 5/25/203
Batter JOLT Hit Probability AVG PA BABIP xwOBA Hard%+ Pitcher Hits Per Game Park Factors
Ozzie Albies 73.85% 0.254 204 0.257 0.342 112 Aaron Nola 5.4 102
Sean Murphy 73.74% 0.275 171 0.305 0.439 135 Aaron Nola 5.4 102
Matt Olson 73.68% 0.234 221 0.290 0.362 124 Aaron Nola 5.4 102
Riley Greene 73.65% 0.291 199 0.400 0.332 108 Lucas Giolito 5.5 99
Spencer Torkelson 73.64% 0.234 195 0.276 0.337 113 Lucas Giolito 5.5 99

Qualified starters have given up 5.2 hits per game so far this season and Nola and Giolito are currently above that mark. In addition, one of JOLT’s most important predictors is how hard the ball is hit. JOLT is unique in that it is trained on batted ball data, but then deployed on averages. This explains why, even though Aaron Nola is a great pitcher, JOLT is predicting a few hard-hitting Braves to get a hit. Add in Truist Park’s park factors, and JOLT likes the Braves today. Let’s take a look at each prediction:

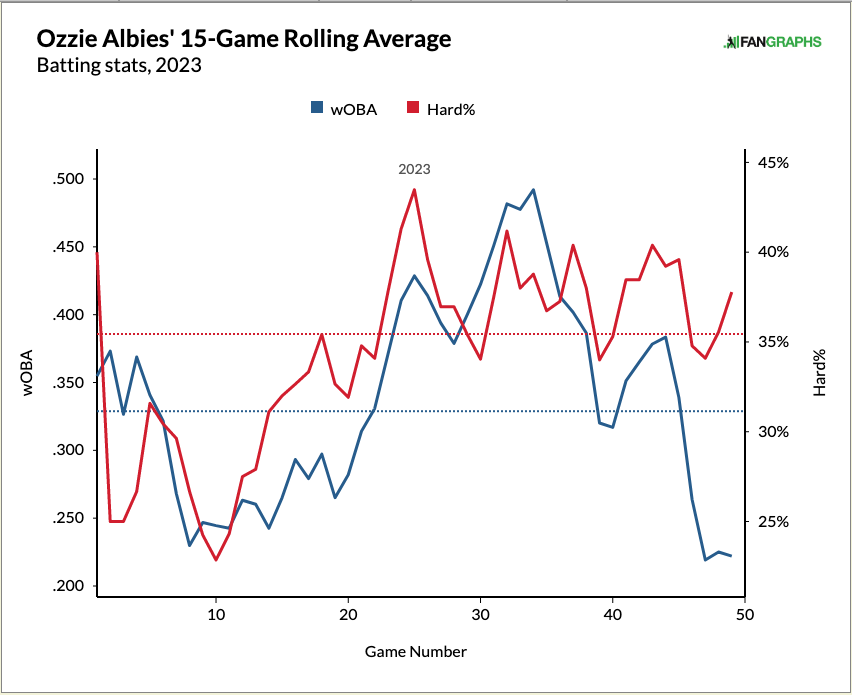
Ozzie Albies (S) vs. Aaron Nola (R) Preds – JOLT: 74% BTS: 61%

You can do a serious deep dive in the community section of the site while reading about optimal swing paths by D.K. Willardson, but vertical bat angle (VBA) is the SwingGraphs data point I’m using in JOLT. The model likes Albies average April VBA against Aaron Nola’s cutter with an average vertical approach angle of -6.39. While that is the main point of JOLT as compared to other models, finding optimal VBA vs. VAA, we could also just look at Albies’ rolling hard-hit rate to see that he’s on the up and up:

Ozzie Albies Roling wOBA and HH%

He’s a switch hitter and the angle match ups seem to be good, but if you’re suspicious of this pick, I don’t blame you. Nola’s cutter has a 2023 batting average of .267 compared to pitcher’s league average of .301. But, is there something about Ozzie’s swing that matches the cutter just right?

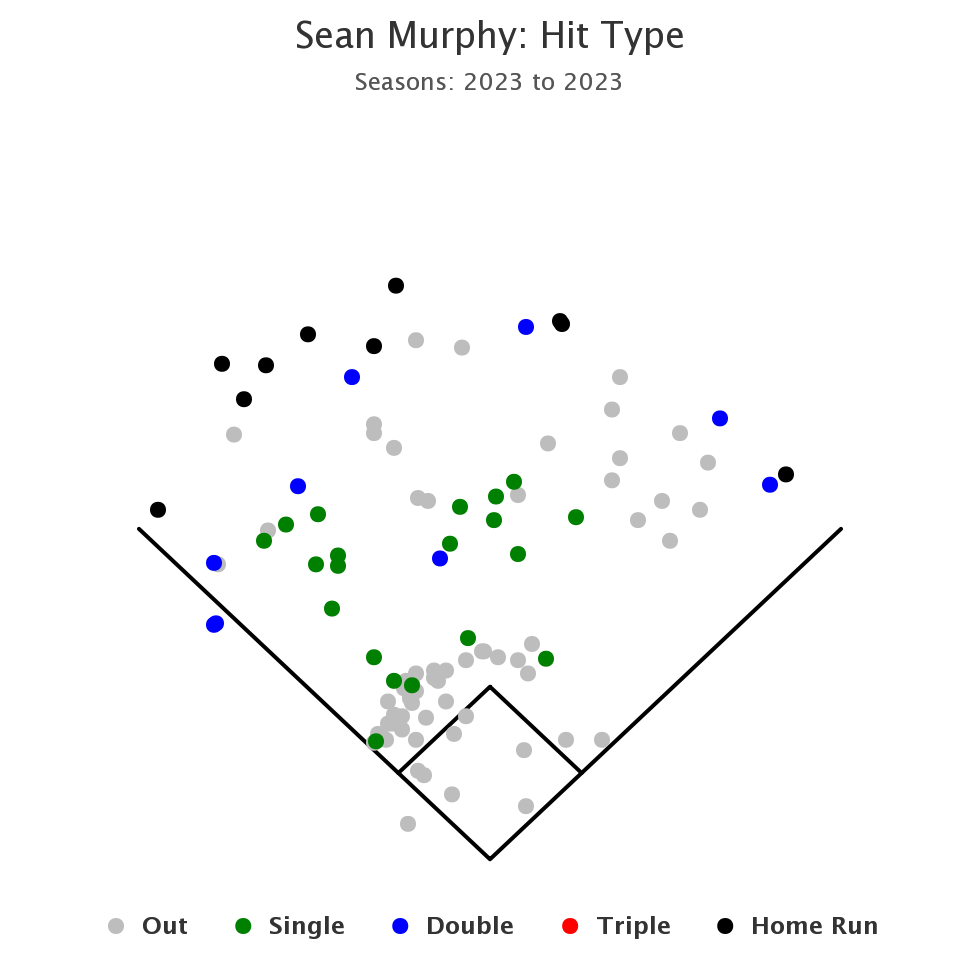
Sean Murphy (R) vs. Aaron Nola (R) Preds – JOLT: 74% BTS: 63%

Murphy ranks 10th among qualified hitters in hard hit rate. He’s batting .275 and while he’s pulling the ball (47.6%) more than average (40.7%), he’s also smoking the ball consistently with a statcast maxEV of 113.8. Here’s a look at Murphy’s 2023 spray chart:

Sean Murphy Spray Chart 2023

Let’s see what happens if Nola throws up a sinker. JOLT likes Murphy’s chances.

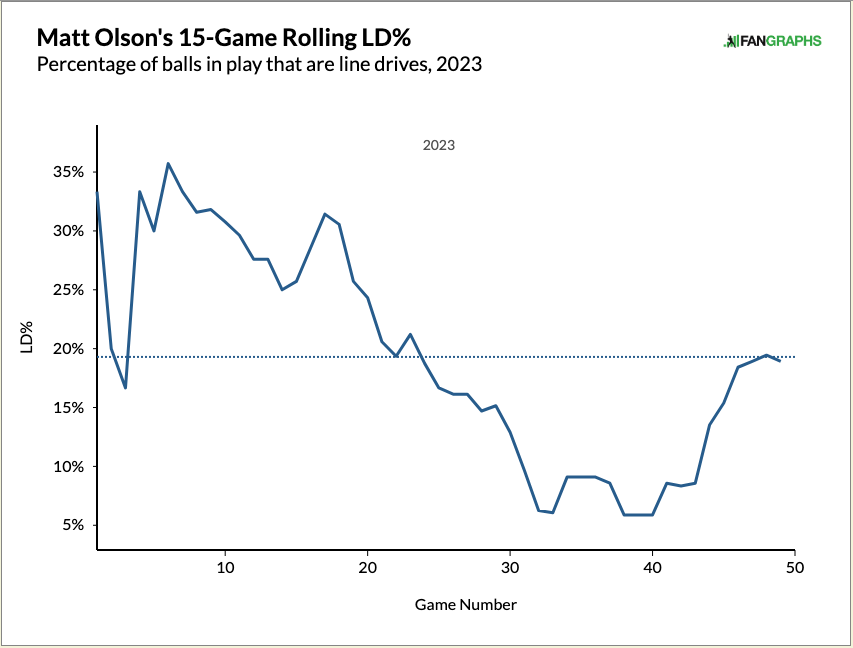
Matt Olson (L) vs. Aaron Nola (R) Preds – JOLT: 74% BTS: 62%

JOLT likes Olson against Nola’s four-seamer. Here’s what happened last season when Nola put one down in the zone:

It’s happened before and it could happen again. Plus, Olson has been increasing his LD% as of late:

Matt Olson Rolling LD% 2023

Riley Greene (L) vs. Lucas Giolito (R) Preds – JOLT: 74% BTS: 63%

Greene has 16 hits in his last 10 games. Giolito has been giving up .3 more hits than league average (among qualified starting pitchers), and luck has been on Greene’s side (400 BABIP). While that last one is silly to bank on, it’s mostly a reflection of the fact that Greene has been putting the ball in play and doing it with hard hit balls. Plus, the White Sox bullpen has given up the 10th most hits this season, just in case the model goes out the window and it’s left up to the unpredictable.

Spencer Torkelson (L) vs. Lucas Giolito (R) Preds – JOLT: 74% BTS: 60%

Tork has one of the lowest batting averages among players on this list and he’s only hit six in his last 25 at-bats. There’s something here in Torkelson’s swing that JOLT likes against Gioltio. He’s never had a hit against the White Sox pitcher with an amazing name, but today could be the day.


Starting Pitcher Chart – May 25th

David Banks-USA TODAY Sports

Daily SP Chart archive

The chart includes their season performance, their opponent’s wOBA versus the pitcher’s handedness over the last 30 days, my general start/sit recommendation for 10-team, 12-team, and 15-team (or more) leagues, and then a note about them. Obviously, there are league sizes beyond those three so it’s essentially a shallow, medium, deep. If a pitcher only has an “x” in 15-team, it doesn’t mean there’s no potential use in 10s and 12s, but it’s basically a risky stream for those spots.

These are general recommendations, and your league situation will carry more weight whether you are protecting ratios or chasing counting numbers. This is for standard 5×5 roto leagues. The thresholds for H2H starts are generally lower, especially in points leagues so I thought there would be more value focusing on roto.

Read the rest of this entry »