A ridgeline distribution plot allows you to easily compare distributions across multiple categories. For this post, I’ve created one plot for each classic 5×5 roto category and position. I used ATC projections to graph the distribution and I’ll point out a few interesting trends that we can gather from each visual. Let’s have some fun with visualizations!
–
Stolen Bases
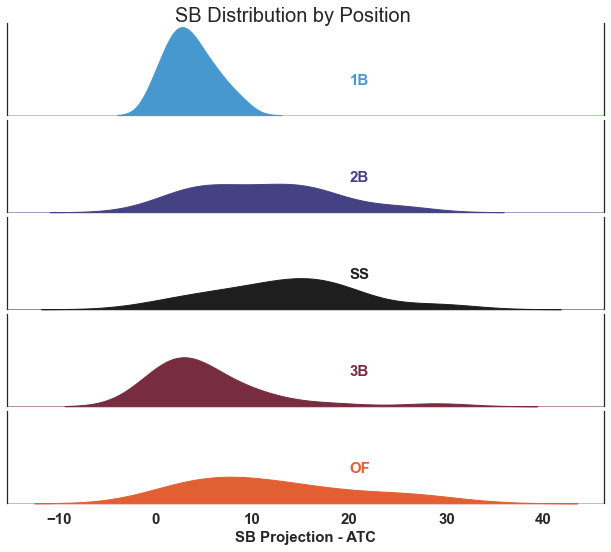
First, you may notice the left tail of this visual goes below zero. Since the ridgeline creates a smooth curve over where the bars of a histogram would be, it smooths out into an area that may not be represented by data. However, if you take your cursor and move up the zero line, you can see that there are a lot of 1B and 3B players projected for one stolen base. The same happens on the right side of each plot. ATC projects only two outfielders for 30+ stolen bases, Ronald Acuña Jr. and Jake McCarthy.
The ridgeline essentially stops at 32 (Acuña’s projection) and tails off from there. So, it’s best not to focus too much on the tails of these graphs but instead on the peaks and to the left and right of the peaks. If you do that, you may notice that there’s a wide range of base-stealers in the SS, 2B, and OF positions, but you already knew that. Instead, look at the 1B peaks and notice that you can target players projected to accumulate six or more stolen bases. Here they are:
1B with 6+ Stolen Bases
*ATC Projections
This mostly goes to show why players like Freeman, Goldschmidt, and Guerrero Jr. are all elite picks. However, you can pick up a few SBs in Rizzo and Myers without spending too much. That could be valuable on the bench. Miguel Vargas is penciled in as the second base nine-hole hitter on the Dodgers’ Roster Resource, but if he has 1B eligibility in your league, he may be a nice late-round flier.
–
Batting Average
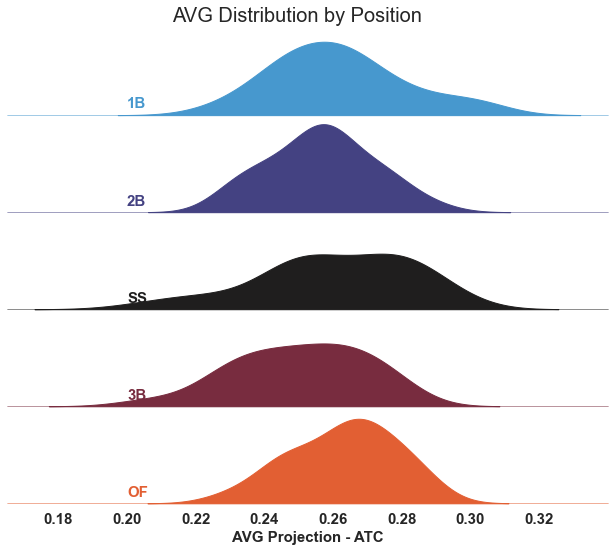
Different from stolen bases, we see that there are players all over the field who can provide high averages. However, take your cursor and move it from top to bottom along the .300 line. You’ll notice that the 1B and SS lines keep going whereas the OF, 2B, and 3B lines stop. There are a few 1B and SS players skewing the distribution to the right. Who are they?
Top 1B by Projected AVG
| Name |
Team |
G |
PA |
AB |
HR |
R |
RBI |
AVG |
| Luis Arraez |
MIA |
136 |
573 |
515 |
6 |
75 |
54 |
0.302 |
| Freddie Freeman |
LAD |
155 |
675 |
582 |
25 |
106 |
93 |
0.301 |
| Vladimir Guerrero Jr. |
TOR |
152 |
657 |
583 |
35 |
96 |
102 |
0.289 |
| Harold Castro |
COL |
40 |
154 |
145 |
2 |
16 |
17 |
0.285 |
| Paul Goldschmidt |
STL |
152 |
650 |
567 |
30 |
95 |
97 |
0.281 |
| Vinnie Pasquantino |
KCR |
139 |
581 |
509 |
22 |
68 |
77 |
0.279 |
| Harold Ramírez |
TBR |
110 |
442 |
411 |
8 |
46 |
52 |
0.278 |
| Donovan Solano |
|
73 |
287 |
262 |
5 |
29 |
30 |
0.274 |
| DJ LeMahieu |
NYY |
110 |
473 |
417 |
9 |
59 |
44 |
0.273 |
| Nathaniel Lowe |
TEX |
146 |
613 |
546 |
22 |
75 |
75 |
0.273 |
| José Abreu |
HOU |
147 |
626 |
555 |
21 |
78 |
83 |
0.272 |
*ATC Projections
If you don’t think Freeman, Goldschmidt, and Guerrero Jr. are worth the spend (roto or salary) then what will it take? These three show up as top targets in both stolen bases and batting averages among first basemen. I wonder if they hit home runs too? But, if you want to zip when everyone else zags, look no further than Pasquantino, Lowe, and Abreu. Yes, you’re faced with a big drop-off in runs, but you still have a power/average combo at a more modest price. How about the shortstops?
Top SS by Projected AVG
*ATC Projections
While it’s a smaller list, there’s a lot to like. We can deduce shortstops are more likely to provide an average/speed combination and that first basemen are likely to provide a power/average combination when targeted appropriately.
–
Home Runs

This time, take your cursor and drag it from the top of the visual to the bottom at the 35 mark. What I find interesting here is the power drop off at 3B. Many fantasy analysts have been writing and talking about the major drop off at the 3B position, and this visual reinforces it. First base shows up yet again as such a critical spot and OF positional players hold a lot of power beyond that 35 mark. Here are the OF and 1B players projected to hit 30 or more homeruns by ATC:
OF and 1B 30+ HR Projections
*ATC Projections
–
Runs

–
RBI
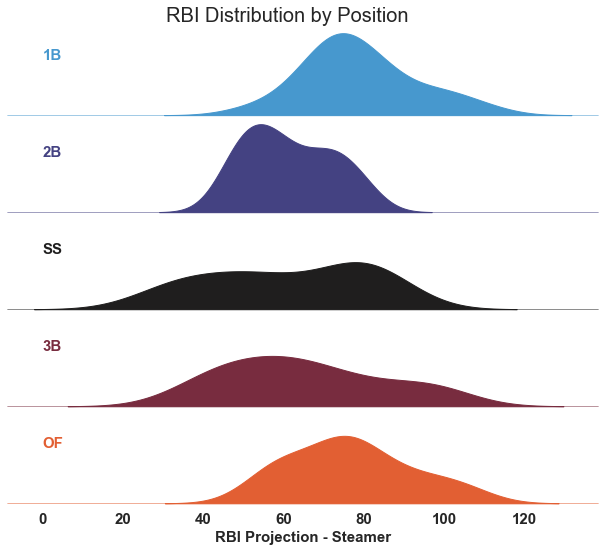
Runs and RBI come from offensively productive players and it helps when they are on good teams. These visualizations reinforce the importance of drafting top-tier 1B and 3B players. But, the distributions are a little more even. Certainly OF players are holding higher run totals, but projected RBI totals are shared fairly evenly among OF, 3B, and 1B players.
If you want a larger summary of what to glean from these distributions it’s that waiting on corner infielders is not recommended, that you can double up on speed and batting average from shortstops, and power doesn’t have to come with empty stolen base potential and that there is simply more production in total to be found in the OF position.
