Within that, the Twins are among many teams giving catchers vastly more leeway than pitchers to challenge borderline calls, with hitters likely falling somewhere in between. That’s backed by minor-league data, in addition to a general sense that the emotional bias of pitchers clouds their objectivity.
For years, there’s been lots of talk about the ABS system reducing the value of catchers by making pitch framing a less essential skill, but I’m becoming increasingly convinced the opposite is true. Catchers who master the art of ABS challenges could have a bigger impact than ever. It will change games.
“Don’t it always seem to go, you don’t know what you got ‘til it’s gone.”
Joni Mitchell may not be a roto savant, but even she might agree that the best part of the fantasy baseball season is research-and-draft season. Every day, from February until Opening Day, is so incredibly thrilling – nonstop spring training news, draft rankings adjustments, and player pool deep-dives – there’s always some rabbit hole of research to go down. As we continue studying and gaining confidence in the fresh player pool and a new year’s ADP, more questions arise, and the more work there is to be done.
Whether in NFBC or best ball contests, high-volume early drafters subconsciously form bad habits in draft rooms. We get too comfortable targeting and drafting the same players over and over. Conversely, we avoid players who have burned us in previous seasons and those we have some subjective bias against. Rarely do we deep dive and reassess those players because we’ve already made up our minds. That’s why it’s crucial to explore every nook and cranny of a positional tier. We have all fallen victim to draft room paralysis, where a decision between several similarly ranked shortstops or starting pitchers becomes gut-wrenching when we’re on the clock. This preseason column aims to help with those tough calls. We will explore some of the most confusing ADP clusters, by position, beyond the simple “I need to boost my batting average, so I’m taking this guy.”
Let’s dive into these ADP pockets logically and systematically, reviewing four analytical components of the players within each cluster. Since this specific article’s topic is starting pitchers, the components have been slightly adjusted:
Health and Durability
Skills: Arsenal, Stuff, Velocity, Command, Control
Roto Ratio Expectations (ERA, WHIP)
Team Context: Defense, Bullpen, Run Support (Wins)
ADP Cluster 4: Starting Pitchers, Rounds 18-20
These are starting pitchers drafted in the 205-240 ADP range in the NFBC Online Championship (OC) over the last seven days.
Five of the eight are seasoned veterans over the age of 30 – Nola, Musgrove, Flaherty, Boyd, and Gallen. At 35, Boyd is the elder statesman of the group. Abbott (26) has averaged 25 starts over his first three seasons. Leiter was a rookie last season, starting 29 games. Weathers has been in the league since 2021, the year he set his career high for innings pitched (94.2). Weathers turned 26 in December, and Leiter will turn 26 in April.
Aaron Nola has been the poster boy of durability over the last decade. Since 2017, his first full season, no pitcher has thrown more innings than (1,527). Last season was his first time on the IL, missing just over three months with a right ankle injury. Before that, he only spent two brief stints on the COVID-IL, in 2021 and 2022.
Zac Gallen missed three-plus months in 2021 with various injuries (fractured forearm, elbow sprain, hamstring strain) and one month with a hamstring injury in 2024. Since 2022, Gallen is third in innings pitched (734) behind Logan Webb (820) and Framber Valdez (768).
Jack Flaherty has averaged nearly 29 starts over the last three seasons, despite a relatively low innings-per-season average of 155.2, though Flaherty hasn’t been on the IL since 2022.
Andrew Abbott missed six weeks with a shoulder injury in 2024 and nearly three weeks with a shoulder strain in 2025.
Before Matthew Boyd’s 179.2 innings in 2025, he spent 380 days on the IL since 2021, and last pitched a full season in 2019. Boyd dealt with a variety of serious arm-related injuries and underwent Tommy John surgery in 2023.
Joe Musgrove missed half the season in 2023 (fractured big toe, right shoulder inflammation), half the season in 2024 (elbow), and all of last with Tommy John. Musgrove had his first bullpen session last August, has no strict innings cap for 2026, and sat at 94-95 with his fastball in his first exhibition game, against Team Great Britain on Wednesday.
Ryan Weathers has spent nearly 250 days on the IL over the last two seasons with finger, forearm and lat injuries. Weathers returned in the final month of 2025 to mixed results, but flashed strong velocity gains. Now with the New York Yankees, Weathers has our fantasy juices flowing in a late-February exhibition game where he topped out at 99.8 mph with his four-seam fastball.
If I were to bet on anyone to pitch 180+ innings, it’s Nola, followed by Gallen. Musgrove won’t be restricted, but I’d be shocked if he threw more than 155 innings (which is OOPSY’s projection). ATC and THE BAT project 133, FGDC, ZiPS and Steamer are between 156-159 and I’ve got him for 150 at FTN. I have Nola for 181, and Gallen and Leiter in the 170s. Abbott, Boyd and Flaherty are in the 160s. Weathers (148, which might be generous) is the biggest red flag, given his health history and substantial uptick in velocity.
Skills: Arsenal, Stuff, Velocity, Command, Control
Below is a two-year sample for our cluster. SIERA is my preferred ERA indicator, and I’ve included and ERA-SIERA differential. Note that Abbott’s -1.21 differential signified being the “luckiest” of the group. Last season, that differential was 1.33 (2.87 ERA, 4.20 SIERA). Aaron Nola’s 0.63 differential was the unluckiest. He posted a 4.35 ERA where his SIERA of 3.72 was nearly in line with his career ERA (3.74 through 2024). Strikeout percentage and walk percentage are the preeminent stats for pitcher analysis. The various groundball rates are interesting to review as well. Notice the odd man out there – Abbott at 32.7%.
Skills and Stats: 2024-2025
Name
ADP
IP
K%
BB%
ERA
SIERA
ERA-SIERA
GB%
vFB
Stuff+
Aaron Nola
212
293.2
24%
6.4%
4.35
3.72
0.63
43.9%
91.9
110
Joe Musgrove
213
99.2
24.6%
5.6%
3.88
3.62
0.26
41.3%
92.9
108
Jack Flaherty
214
323
28.7%
7.3%
3.90
3.38
0.52
38.1%
93.1
98
Matthew Boyd
215
219.1
22.6%
6.2%
3.12
4.00
-0.88
36.8%
93
93
Ryan Weathers
218
125
22%
6.8%
3.74
4.00
-0.26
45.6%
96
101
Andrew Abbott
227
304.1
20.7%
7.5%
3.25
4.46
-1.21
32.7%
92.8
96
Zac Gallen
229
340
23.1%
8.4%
4.31
4.07
0.24
44.7%
93.7
92
Jack Leiter
239
187.1
21.9%
10.3%
4.80
4.52
0.28
37.9%
96.9
107
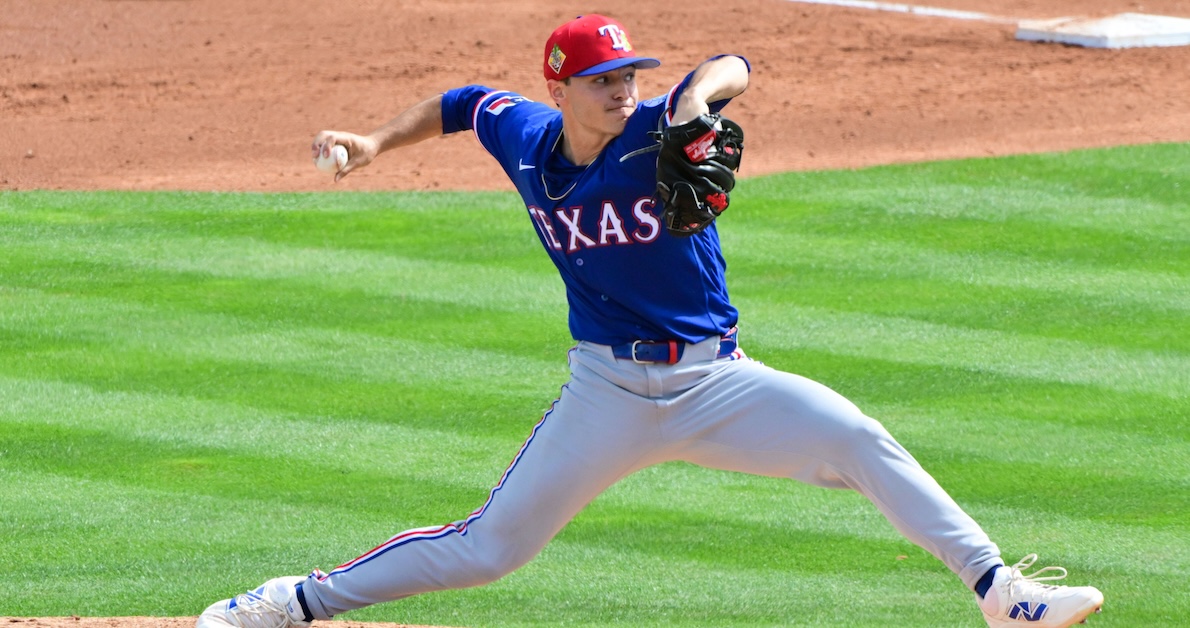
There are no truly elite control arms here, though Joe Musgrove (career 6% BB) and Aaron Nola (6.4%) are most reliable in this regard. Jack Leiter and Ryan Weathers have the nastiest stuff and throw the hardest. Leiter’s control has been his Kryptonite throughout his minor league days. Harnessing and reducing it will be the key for the former second-overall draft pick to fully break out and provide the most fantasy profit among starters in this range. Rangers’ new pitching coach Jordan Tiegs has been with the organization since 2019 and is considered to be a key driver in Leiter evolving as a big-league pitcher. It surely doesn’t hurt having veteran hurlers Jacob deGrom and Nathan Eovaldi in your corner.
All of these arms except Musgrove rely primarily on their four-seam fastball (between 48-51% usage in 2025). Musgrove has the most diverse pitch mix. He gradually increased his cutter and slider usage over his last four seasons with the Padres. Flaherty is primarily a fastball-curveball-slider guy. His curve was outstanding in 2024 (.175 wOBA, .219 SLG, 40% K). He upped his usage on it in 2025 (from 21% to 25%) and punched batters out at a 41% clip, though it did not fare quite as well – a .281 wOBA, .380 SLG.
Roto Ratio Expectations (ERA, WHIP)
Projections models and personal opinions will all differ, but the one thing we all seem to agree on is that Andrew Abbott is due for some major ratio regression. Abbott posted that magical 2.87 ERA last season, after two seasons of 3.77. FanGraphs models project ERAs between 4.17 (FGDC) and 4.65 (THE BAT X). The lone outlier is ZiPS at 3.80. The most baffling stats were Abbott’s home splits. The fly ball-leaning lefty managed a 2.39 ERA in his home park – extra hitter-friendly Great American Ball Park. Abbott did reduce his walk rate last season (from 8.9% to 6.3%), but remained a below-average in strikeouts (19.5% in 2024, 21.8% in 2025). His WHIP is likely to land somewhere in the 1.23-1.28 range. He posted a 1.15 WHIP in 2025, 1.30 in 2024 and 1.32 in 2023.
The usually dependable Zac Gallen was a tough player to roster last year. Hitters bashed him to the tune of a 5.40 ERA before the All-Star break, which he cleaned up in the final 2.5 months (3.97). He also served up home runs at an above-average rate (1.45 HR/9) after four consecutive seasons in the 0.73-0.94 range. His velocity didn’t drop last season, but his strikeout rate did – 21.5% after four seasons of 26%. Gallen is a difficult arm to project for 2026 as there is a wide band for ERA and WHIP. A 3.50/1.15 season probably wouldn’t surprise us. Neither would 4.25/1.25. My personal expectations for him are right in the middle.
Jack Leiter throws certifiable heat. His 3.86 ERA was respectable, but a 1.28 WHIP, partially fueled by a 10.8% walk rate, was not. Ryan Weathers throws just as hard, but has done a better job at limiting free passes, keeping his walk rate under 7% over his 125 innings since 2024. These are the two highest-upside pitchers in the cluster, though each come with the most risk and the risk with Weathers is higher, especially as his draft price continues to rise.
Matthew Boyd managed a splendid 3.20 ERA despite higher peripherals (4.09 SIERA, 4.22 xFIP). Boyd was especially solid in his home starts:
Home: 89.2 IP – .257 wOBA – 2.51 ERA – 0.90 WHIP – 23.2% K – 4.1% BB
Road: 90 IP – .315 wOBA – 3.90 ERA – 1.28 WHIP – 19.9% K – 7.4% BB
Boyd was mostly disaster proof before the All-Star break, allowing no more than three earned runs in 18 of 19 starts. He allowed four or more in six of his final 12 starts. He did not allow more than five runs in any of his starts, and there’s something to be said about drafting boring, late-round veteran arms who reduce our fantasy staff’s volatility. I wouldn’t be surprised if Boyd followed up with another sub-3.50 ERA, but it’s most likely to end up in the 3.65-3.90 range. We can work with that.
Joe Musgrove has the highest ratio upside of the group. His home park is a hit-suppressor factory and he’ll line up for several starts against subpar offenses in his division (COL, ARZ). Among starting pitchers with 500 or more innings pitched since 2021, Musgrove’s 3.20 ERA is tied for ninth lowest. Just stay healthy, Joe.
Team Context: Defense, Bullpen, Run Support (Wins)
Poor Jack Flaherty finished last season with an 8-15 record for a team that was 12 games over .500 and almost won their division. Matthew Boyd’s Cubs won five more games (92 to 87) and Boyd started 31 games just as Flaherty did, but ended up with better run support overall and a 14-8 record. Reviewing Flaherty’s game logs helps paint the picture. He served up at least four earned runs in 9-of-31 starts, including three horrific outings (7 ER vs. CIN, 8 ER at TB, 8 ER vs. KC). The Cubs boasted a top-tier defense last season and project for much of the same in 2026. The Tigers are about league average. This information adds additional insight to their differences in the wins category last season, and likely portends our 2026 expectations.
Aaron Nola would be the safest bet for most wins among this cluster. Ironically, high win totals have eluded the him. Despite six consecutive seasons between 32 and 34 starts, Nola has won more than 14 games in a season once – 17 in 2018. Among pitchers in this cluster, Nola’s Phillies have the highest projected win total (89.5), and the Cubs are next (88.5). The Diamondbacks have the lowest (79.5), and it doesn’t help that the Diamondbacks bullpen was a dumpster fire last year (third worst) and don’t expect A.J. Puk and Justin Martinez back anytime soon. It’s doubtful that Kevin Ginkel and Paul Sewald hold down the fort in the meanwhile. Wins are the least projectable standard roto category, so we’ll all probably just laugh about it come October if Abbott wins 16 of 33 starts and Nola just 9 of 31.
Recommendation (with target grade)
Aaron Nola (B) – Buy back in on the “King of Even Years”. Plus strikeouts, a low walk rate, decent defense, and good run support from a team with a high win total.
Andrew Abbott (D) – Tough home park for pitchers, a tough hitting division, below-average strikeouts, and the Regression Monster knocking on his door. I’ll pass.
Matthew Boyd (C) – Ceiling is low, but the floor is stable. On a team with a strong offense and top-notch defense of mostly grounded veterans. Likely a pass, but I’d draft him 1-2 rounds after his ADP.
Joe Musgrove (B+) – Intrigued, but if his spring continues to flow flawlessly, the price will rise to the 140-160 range and our margin for profit has sunk. Currently a target.
Jack Flaherty (C+) – Derives value from strikeout output potential based on recent seasons flirting with the 30% K mark. Too much volatility in his profile for me to stomach.
Zac Gallen (C) – Defense projects among the top five, but the bullpen seems wonky, offense is weaker, and Gallen has become the human rollercoaster. Not a target but would consider him.
Ryan Weathers (B) – New high velocity, health history, and durability are all concerning factors. Ideal breakout candidate based on skills and new environment. Beware the rising price. I’d consider.
Jack Leiter (A-) – Ironically, the most affordable per current ADP is my favorite target. Healthy, elite pedigree, killer stuff, pitcher-friendly home park, and the boys in his ear (deGrom, Eovaldi)
The most important takeaway is one that hasn’t been introduced yet – that there are over a dozen starters in the Rounds 21-25 range who are comparable to the arms in this cluster. If we’re comfortable with those later targets, then we don’t have to spend much time shopping in this range. To recap, Leiter is a strong target, Musgrove and Weathers are also, albeit the latter comes with a high risk factor. Boyd, Flaherty and Gallen are considerations, but only after their ADPs. I won’t have Andrew Abbott on any of my teams this season.
It’s bold prediction week here at RotoGraphs. Last year, I got 3.5 of my bold predictions correct which was a really strong showing. Maybe I need to go bolder — or maybe I just got lucky.
Here are five pitcher predictions and five hitter predictions; hopefully they’ll be of some use to you as the season starts up. Alongside the predictions, I’ve also included some draft data from the current offseason to get a better sense of how these players are being valued by the Ottoneu community right now.
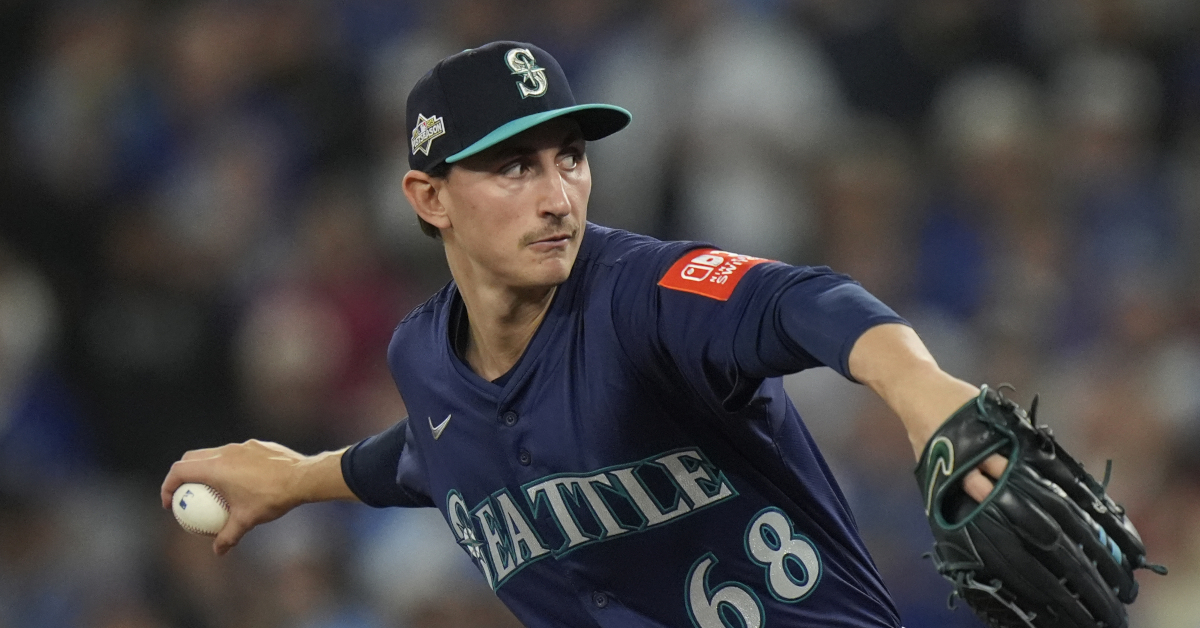
1. George Kirby is a top-15 SP (by P/IP among pitchers w/ 100+ IP) Ottoneu Average Salary: $21.1 Ottoneu Average Draft Price: $27.5
Upon first glance, this might not seem like such a bold prediction based on George Kirby’s reputation. I think the market perceives him as an ace thanks to his phenomenal strikeout-to-walk ratio and clear top tier value in 5×5 leagues. But consider his record in Ottoneu points leagues: he’s never broken 5.0 P/IP in a single season and he topped out as the 22nd ranked SP by P/IP in 2023. His current Depth Charts projections have him at 4.9 P/IP, an exact match for what he accomplished during his first three seasons in the league and 22nd among all SP.
To break into the top-15, Kirby is going to have to figure out how to either boost his strikeout rate or cut back on his home run rate. Probably a mix of both. Last year, Kirby dealt with a spring shoulder injury that cost him two months of the season. Once he returned, his arm angle was eight degrees lower and his trademark pinpoint command was a little compromised. One hidden benefit of the lower arm angle was a flatter fastball and some additional arm-side movement for his secondaries. Both his slider and curveball had career-high whiff rates last year and if he can maintain and improve on those changed mechanics, maybe his strikeout rate can steadily tick upwards again in 2026.
As for his home run rate, Kirby actually ran the best xFIP of his career last year. His home run rate was about 2.5 points above his career norm and the culprit was likely poorer command of his two fastballs. His four-seamer has always been a little home run prone since he likes to elevate it up in the zone so often, but he allowed six homers off his sinker last year after allowing six total across his first three seasons in the big leagues.
2. Ryne Nelson is a top-25 SP (by P/IP among pitchers w/ 100+ IP) Ottoneu Average Salary: $4.2 Ottoneu Average Draft Price: $3.8
When you open up the Baseball Savant pitch arsenal leaderboard, Tarik Skubal’s changeup leads the way with a +25 run value. That checks out as it’s an absolutely devastating pitch. The next most valuable pitch in baseball is Ryne Nelson’s four-seam fastball and I can’t say I expected to see that. The whiff rate on the pitch is a little below league average for a four-seamer so Nelson is racking up all that run value by limiting the amount of damage done on contact off the pitch. There are some caveats to think about here. Run value is a counting stat and Nelson threw his heater a lot — about 61.9% of the time. By RV/100, it was the 54th best pitch at 1.5 RV/100, which is still very good but not an extreme outlier.
The problem for Nelson is that he doesn’t have a great secondary pitch to pair with his hard fastball. He made some improvements to his slider and curveball last year but one of those breaking balls needs to take another step forward to raise his overall profile. To break into the top 25, he’d essentially need to break 5.0 P/IP — he landed at 4.8 in 2025. I think he’ll continue to suppress damaging contact with his heater and find a way to earn a few more whiffs with his secondary pitches this year.
3. Janson Junk is a top-30 SP (by P/IP among pitchers w/ 100+ IP) Ottoneu Average Salary: $3.3 Ottoneu Average Draft Price: $1.1
Ok, this one might not be so bold because Janson Junk was already a top-30 SP last year, sneaking in at 26th with 4.8 P/IP over 110 innings. But 22.2 of those innings came as a reliever; Junk posted a 4.4 P/IP over 87.1 innings as a starter which would have ranked somewhere around 50th. From there, maybe this prediction seems a little more bold.
What I like about Junk is that he managed to harness his command to an elite level in 2025; among all pitchers with at least 100 IP, his 2.9% walk rate was the lowest in baseball by a pretty wide margin. The downside is, like Nelson above, he doesn’t really have a secondary pitch to rack up tons of swings and misses. That’s why his strikeout rate was just 17.2% despite an elite strikeout-to-walk ratio that approached six.
The Roster Resource depth charts have Junk penciled in as a long reliever in the Marlins bullpen, but there’s enough injury question marks in Miami’s rotation that I think Junk will eventually get a shot at starting again. The command improvements he made last year provide enough of a solid foundation that he can build off of. For a $1 flier at the end of your auction, that’s not a bad bet to make.
4. Joey Cantillo scores the most total points among Guardians starting pitchers Ottoneu Average Salary: $4.3 Ottoneu Average Draft Price: $4.4
The Guardians starting rotation is filled with a ton of promising young pitchers; Gavin Williams, Tanner Bibee, and Logan Allen로건 are all already well established in the big leagues, but Slade Cecconi, Joey Cantillo, and Parker Messick are all vying to make a bigger impact in the majors in 2026. Of that group of six youngsters, I think Cantillo has the best shot at actually breaking out in a big way this year.
It all starts with his changeup. That pitch returned a whiff rate of nearly 50% in 2025 thanks to a huge velocity differential from his heater. His breaking balls are decent — his curve got better results last year but he’s testing out a new grip on his slider this spring that could help that pitch take a step forward. The knock against him is his command, which is below average at best. He was able to cut his walk rate slightly once he was inserted into the Guardians rotation in July last year. With just a little improvement to his command and maybe a better breaking ball, Cantillo has an opportunity to take a big step forward this year.
The other half of this prediction requires Williams, Bibee, and the rest of the Guardians starters to stumble a bit — or at least fall short of Cantillo’s breakout. I think there are enough questions about each of them that I’m willing to bet that Cantillo rises to the top of the pile.
5. Chad Patrick scores the second most total points among Brewers starting pitchers Ottoneu Average Salary: $3.4 Ottoneu Average Draft Price: $2.2
I hedged this prediction just a little because there should be a lot of moving parts to the Brewers rotation this year, but I think Chad Patrick will stick in the big leagues through the whole year. Because here’s the thing, this prediction was already proven correct during the first half of last year; Patrick scored 420 points before the All-Star break, second most on the Brewers behind Freddy Peralta. Then he was pushed out of the rotation and back to Triple-A for a significant portion of the second half of the season once the Brewers pitching staff got healthy.
For his part, Patrick has a really strong repertoire. By Stuff+, he has three above average pitches and his cutter is one of the best in baseball. He had a fantastic 3.2 strikeout-to-walk ratio last year and a 3.53 FIP that exactly matched his top line results by ERA.
As for the rest of Milwaukee’s rotation, I’m not sure Brandon Woodruff can make it through an entire season, Jacob Misiorowski still has to overcome his command issues, and the rest of the rotation is young and unproven. Some of those youngsters have brighter prospect pedigrees than Patrick ever had, but they still need to establish themselves in the big leagues and Patrick has already done that.
6. Mookie Betts scores the most total points among all SS
Ottoneu Average Salary: $35.7
Ottoneu Average Draft Price: $32.9
This is as much a bet on Mookie Betts as it is a bet against Bobby Witt Jr. — although Witt wasn’t even the top scoring SS in 2025, Geraldo Perdomo was. It’s no secret that Betts’s entire season last year was derailed by the mysterious illness he caught right before the team’s spring trip to Japan. There was about a month and a half during the late summer where Betts was producing like he had at his peak which gives me some hope that he’ll be able to bounce back in a big way this year now that he’s had a full offseason to get healthy. I have some lingering concerns; namely, his contact quality dropped off pretty significantly, though that could be explained away by the loss of strength that stemmed from his spring illness.
To reach the top of the pile at shortstop, Betts will probably need to score at least 1,000 points or more. He’s done that four times in his career, and if you give him credit for the 16 games he played at short in 2023, he actually led the position in scoring that season. I have nothing against Witt but he struggled to match his otherworldly production from 2024 last year and I think that’s more in line with his true talent than his outrageous line from that breakout season.
7. Alec Bohm is a top-5 3B (by P/G among batters w/ 300+ PA) Ottoneu Average Salary: $8.3 Ottoneu Average Draft Price: $5.7
Alec Bohm was one of the guys I was on the fence about keeping this offseason. I quote, “An abysmal first month of the season is bringing down Alec Bohm’s overall numbers from 2025. From May 1 through the end of the season, he posted a .308/.356/.453 slash line, good for a 124 wRC+ and 5.4 P/G.” That P/G over those five months would have landed him ninth among all 3B last year.
I also noted that Bohm’s hot finish to the season wasn’t driven by any improvement to his underlying contact quality, but simply a career-high contact rate. More balls in play led to more positive results, even if he continued to pound the ball into the ground at too high a rate. Instead of embracing the uncertainty in his profile, I’ve decided to bet on the improvements he made to his contact rate. That’s a pretty significant change to his profile, and if he’s able to figure out how to elevate his contact just a little more often, a huge breakout could be in the cards.
8. Bryson Stott is a top-5 2B (by P/G among batters w/ 300+ PA) Ottoneu Average Salary: $8.4 Ottoneu Average Draft Price: $6.8
The argument for Bryson Stott goes a lot like the argument for Bohm above. During the second half of the season, Stott posted a 135 wRC+ and 5.1 P/G in Ottoneu. Across a full season, that would have landed him around seventh among all 2B. That late season improvement stemmed from a pretty dramatic swing change. He was able to improve the quality of his contact while still maintaining his excellent plate discipline.
Assuming the new swing mechanics carry over to this year, Stott looks well positioned for a breakout in 2026. Plus, Michael Baumann also identified Stott as a potential breakout when looking for players with similar characteristics to Geraldo Perdomo and Maikel Garcia prior to their own breakouts.
9. Spencer Horwitz is a top-12 1B (by P/G among batters w/ 300+ PA) Ottoneu Average Salary: $4.1 Ottoneu Average Draft Price: $2.8
I really liked Spencer Horwitz as a sleeper last year because he had 2B eligibility and looked like he was going to have a shot at full-time at-bats after an offseason trade to Pittsburgh. Unfortunately, wrist surgery derailed the start of his season and it took a while for his bat to get going once he made it back to the majors. During the second half of the season, he posted a 154 wRC+ and put up 5.8 P/G in Ottoneu. That would have ranked 10th among qualified 1B across the full season.
His contact quality doesn’t stand out that much but he does have an excellent approach at the plate. That gives him a solid floor and I think a fully healthy wrist will help him take a big step forward this year. The potential risk to this prediction is that he’s absolutely atrocious against left-handed pitching — his career platoon split is nearly 100 points of wOBA. If he’s relegated to the strong side of a platoon and makes a bunch of pinch hit appearances in games that he doesn’t start, his P/G will likely take a pretty big hit. Practically, you can just stash him on your fantasy team’s bench whenever the Pirates are facing a lefty, but for this prediction to come true, he needs to improve his production against same-handed pitching and figure out a way to stay out of a platoon situation.
Just like my bold prediction about Roman Anthony and Kristian Campbelllast year (which I got half right), I’m throwing some cold water on the hype surrounding these three top prospects. I did hedge a little bit because I didn’t want to be too much of a downer, but it’s really hard to make the jump from the minor leagues to the majors. It certainly seems like the Pirates, Tigers, and Cardinals are going to give these three a shot to break into the big leagues this year, probably right out of spring training, but their success should not be simply assumed to be a guarantee. Griffin is only 19! McGonigle only has 206 plate appearances above High-A! Wetherholt only has a little over 600 total plate appearances as a professional! The odds are that all three of these guys will end up being very good ballplayers eventually, but it might be a lot to ask of them to be among the best at their position right off the bat in 2026.
Bold prediction season is my favorite sub-season within draft season. Way ahead “we are drafting way too early season” and just barely edging out “prospect ranking season.” The worst sub-season within draft season is “pitchers and catchers reported two days ago and now every news alert is an injury” season. I hate that season.
But bold prediction season is the best. It brings out the absolute best of the baseball world. Everyone is putting a stake in the ground for the players they love. People are being wildly optimistic, because it is spring and it’s getting warmer out and the season hasn’t started yet so anything is possible. It just doesn’t get more fun than this.
In a recent article, I wanted to show the average fastball velocity increase from Spring Training to the regular season. I went to Mike Fast’s classic article, “Spinning Yarn: Do Spring Speeds Matter?” at Baseball Prospectus, and noticed it was 15 years old. In the article, he found a 0.6 mph increase from Spring Training to the regular season. As much as I trust Mike’s work, it’s time for an update. After looking at the numbers, the velocity difference has shrunk to almost zero.
To find the change, I took the available Spring Training fastball velocities from the past three seasons for both sinkers and four-seamers. Then I calculated the average and median differences, along with the standard deviation. Additionally, it seems like relievers are down more than starters (>=50% GS/G in regular season) in Spring Training, so I split them up.
That’s pretty much it, so here are the results.
Fastball Velocity Increase from Spring Training to the Regular Season
Pitch (Role)
Average
Median
SD
1 SD (68% chance)
2 SD (95%)
3 SD (99%)
FF (All)
0.26
0.22
0.94
-0.7 to 1.2
-1.4 to 2.4
-2.0 ti 3.6
FF (SP)
0.08
0.07
0.87
-0.8 to 0.9
-1.6 to 1.9
-2.4 to 2.8
FF (RP)
0.37
0.34
0.96
-0.6 to 1.3
-1.2 to 2.7
-1.8 to 4.0
SI (All)
0.18
0.13
0.89
-0.7 to 1.1
-1.4 to 2.1
-2.1 to 3.2
SI (SP)
0.01
0.01
0.81
-0.8 to 0.8
-1.6 to 1.7
-2.4 to 2.5
SI (RP)
0.29
0.24
0.92
-0.6 to 1.2
-1.3 to 2.4
-1.9 to 3.6
2023 to 2025
The overall increase is cut in half from the original study, with starters seeing almost no increase … on average. All the standard deviations approach 1 mph, so there can be some major differences from one pitcher to the next. I included the velocity ranges for different standard deviations. In the best-case scenarios (3 SD), starters gain about 2.5 mph while relievers are adding 4 mph.
With that knowledge, feel free to navigate our player pages to see who is up and who is down. And for me, it’s back to Mining the News.
Bold can be beautiful. Sometimes it’s downright ugly. In the case of bold fantasy predictions, it’s not in the eye of the beholder, but in the results. Since most bold predictions columns focus deep into the player pool, I decided to approach it from a different angle. Below is a set of prognostications, only for hitters in the top 100 ADP. I’ll cover one per offensive position, though they will not be presented in order of confidence, since I’m mostly confident in all of them. Be sure to let me have it if they’re downright ugly come the end of the season.
No one will ever be able take away Cal Raleigh’s magical season – only six other players and no other catchers have ever socked 60 dingers in a season. He’s a consensus second-round fantasy pick, and no other backstop is within 30 ADP spots of him. Let’s pivot from fantasy to reality: Raleigh is a beast. He rarely takes a day off, makes a quarter of his starts as Seattle’s designated hitter to give his knees a rest, and he could easily crush 40+ bombs again. How can any other catcher even come close? If Raleigh’s 2026 production more closely mirrors 2023-2024 than 2025, then 76-36-90-2-.227 won’t cut the mustard for overall C1. Especially in this new world of impact fantasy catchers who spend time at other positions or more frequently DH (Salvador Perez, Hunter Goodman) or don’t catch at all (Ben Rice). If ever there was a guy to unseat him, why not the guy Raleigh just unseated? His name is William Contreras – the top fantasy catcher in 2024 and 2023.
Contreras is coming off a down year, yet he still earned $20 in 12-team standard roto and was the overall C4, playing with a fracture in his left middle finger for much of the season. Contreras’ 1,949 plate appearances over the last three seasons are the most at the position. From 2023 to 2024, as the no. 1 backstop, he averaged 93 runs, 20 homers, 85 RBIs, 8 stolen bases, and a .284 BA. A similar 5×5 stat line in 2026 should yield another top-25 season, pitchers excluded. Contreras hits the ball hard (92 mph EV, 49% HH), produces an elite batting average at his position (in fact, for any position), and he usually throws in a few bags. With Jackson Chourio and Brice Turang hitting in front of him, and Christian Yelich and Andrew Vaughn behind, who is to say Contreras can’t set new highs in runs and runs batted in? He’s healthy, in his prime (age 28 season), and is ready to earn his crown back from the Big Dumper, assuming Cal sterilizes it first.
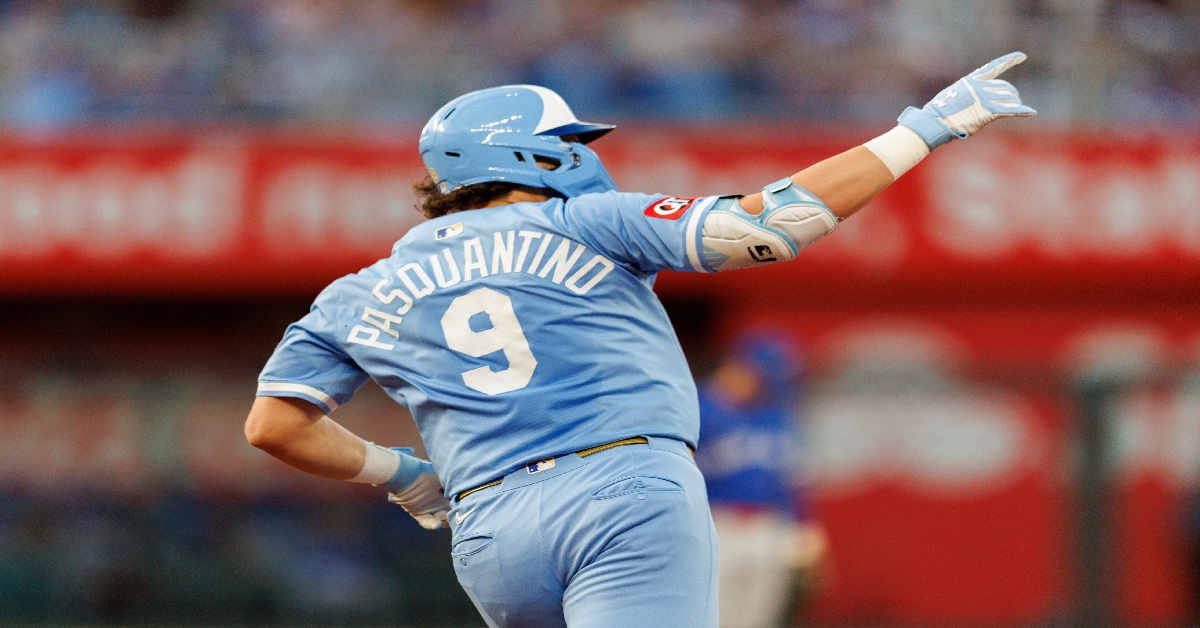
It’s possible we have not yet seen the best of Pasquatch. Pasquantino is a popular player and an easy guy to root for. The big guy is friendly, active on social media, and has a love for baseball analytics. He is one of just eight hitters averaging 105 or more RBIs over the last two seasons, and that’s with missing 33 games. He maintained a BB/K over 1.00 in the minors, and though it’s 0.61 in the majors, that is still above big-league average, and he’s a tough guy to punch out (13.5% career strikeout rate). Pasquantino set a career high in homers with 32 last season. Models project a slight regression, around 27, which is a very reasonable expectation. Those doubting 40 is possible would point toward league-average power metrics, such as a 91 average EV, 9% barrel rate, 45% hard-hit rate, and .191 ISO.
Moreover, his bat speed (72.5) is mediocre, and his launch angle of 16.6 degrees over the last two seasons could use a slight increase. Pasquantino’s plate discipline has been slowly waning over these past few years, and with Kauffman Stadium’s outfield walls moving in, Vinnie P might be interested in selling out a bit of contact (85% career) for more power. Kauffman’s dimension shifts are a big deal. The left and right field fences are coming in by 9-10 feet, and the wall heights are reduced by up to 18 inches. There is no debate about more homers being hit there in 2026 than in past seasons. Vinnie P may not be a batting average stalwart like he was in the minors and his rookie season, but that’s ok because the HR/RBI numbers will be epic. I believe the Royals will win the AL Central, and that Pasquantino crushes 40 this year.
Second Base – Nico Hoerner is fantasy’s top second baseman
“Are you trying to tell me a guy who has never hit 10 homers in a season is going to be the top producer at his position?” That’s exactly what I’m telling you. In fact, that’s exactly what happened last season when Brice Turang (who came in with a career-high seven home runs) was the only second baseman to earn $20+ in roto. This one should qualify as the least bold call of all, since the bar for being the overall 2B1 isn’t high. The only others here in the ADP 100 are Turang, Jazz Chisholm Jr. and Ketel Marte, and only a few from the field below Hoerner could even be considered dark horse candidates. Chisholm and Marte have had their share of injury woes, though both are strong candidates. Turang is firmly entrenched in the 2B1 conversation, but what if the home runs (18) and outlier batting average (.288; .262 xBA) aren’t repeated, and the swipes remain in the 20-30 range? This is a fantasy opportunity for Hoerner – an elite contact hitter and base-stealer on a talented veteran-infused lineup to tie it all together with a bow of 16 dingers? A 90-16-66-36-.292 line could earn him the top spot, and they’re all numbers he’s produced before, sans the homers.
The 30/30 Club isn’t as exclusive as it once was. No hitters accomplished the feat between 2013 and 2017. Since then, there have been two (2018), two (2019), one (2021 – Cedric Mullins), none in 2022, four (2023), and three (2024). In 2025, there were seven: José Ramírez, Julio Rodriguez, Jazz Chisholm Jr., Juan Soto, Francisco Lindor, Corbin Carroll and Pete Crow-Armstrong. Bobby Witt Jr. fell short (22/38), but accomplished the feat in 2023 and 2024. Gunnar Henderson and Zach Neto can join the club in 2026. Henderson only missed six games last season, but played through left shoulder impingement and inflammation for most of the year. He still stole 30 bases on 35 attempts and hit 17 home runs. In the previous season, Henderson crushed 37 bombs. His average exit velocity (92.1 mph), bat speed (75.3 mph) and hard-hit rate (49.2%) all ranked in the top 15% of hitters last season.
With Pete Alonso, Taylor Ward, and a loaded, improving offense around him, Henderson is very capable of 30/30 and a run at the AL MVP award. Neto produced 23/30 in his first full season (602 PA, 2024), and followed up with 26/26 in just 554 plate appearances in 2025. His average exit velocity (91 mph) and hard-hit rate (46.6%) were both well above average, and he nearly doubled his barrel rate from 2024 (8.8%) to 2025 (14%). The key for Neto to get there is, of course, health. Though not just his own, but that of veteran Mike Trout, whose presence in the lineup always has a positive impact on those around him. Despite his second/third-round ADP, Neto is still somewhat underrated and should make a name for himself on the national stage this year. Henderson and Neto join the 30/30 Club this season!
There have only been two $60+ seasons, per our Player Rater – Shohei Ohtani’s 50/50 season from 2024 and Ronald Acuña Jr.’s in 2023. That season, Acuña stayed healthy, amassed 735 plate appearances and produced an insane line: 149 R, 41 HR, 106 RBI, 73 SB and a .337 average. If anyone can beat out Ohtani, Judge or Witt for fantasy’s top earner this season, it’s Acuña. I’m buying in on another epic season as the leadoff man for a stacked Atlanta Braves offense in his age-28 season. Last season, he slashed .290/.417/.518, hit 21 dingers in 412 PAs, and flaunted healthy power metrics – 92.7 mph EV, 15.7% BRL, 52.5% HH. He kept his running to a minimum (nine swipes on 10 attempts) last season, but ran wild in winter ball (11 SB in 71 PA), and stole another two in his first four spring training games. Acuña is as healthy as he’s been since that epic 2023 season and is hungry for a repeat. With his ability for elite production across all five standard roto categories, and the fact that Ohtani isn’t projected to run wild like in 2024 (63 attempts), Acuña will edge out the field and be the king of fantasy once again.
Bonus: Kyle Tucker leads the National League in RBIs
Very few folks outside of those who drafted him or who bleed Dodger Blue want to see this one come to fruition. Tucker has been catching lots of grief over the past year between his lowkey demeanor, missing substantial time with injuries, and signing a huge AAV contract ($57.2M per for four years), loaded with deferrals. When healthy, he is one of the most consistent and well-rounded producers in fantasy, averaging .278/.353/.517, 30 HR, 23 SB, 84 R, 104 RBI and a 138 wRC+ over his first three full seasons (2021-2023). His production pace was elite in his last two, injury-marred seasons as well. Tucker is in a position to produce a career year in his first season with the Dodgers. Manager Dave Roberts intends to have him bat second between Shohei Ohtani and Mookie Betts, which would line Tucker up to score more runs than he drives in. It’s highly likely that Tucker earns most of his at-bats this season hitting third between Betts and projected cleanup man, Freddie Freeman – and that’s exactly how I foresee the top of this lineup materializing. FanGraphs Depth Charts (FGDC) currently projects Tucker with the fourth-most RBIs (99) in the NL behind Ohtani, Kyle Schwarber, and Juan Soto. I’ve got Tucker with 126 and the RBI NL crown.
It is that time of year again! It is time for BOLD predictions. As a reminder, these are not necessarily things I think will happen, but things I think could happen if a player reaches his 75-90% outcome. If I get 2-3 of these right, I will be pretty happy. Make sure you tell me where I am completely off base and what bold predictions you have for the 2026 season.
For all the rankings mentioned in those bold takes, I will use our 12 end-of-season fantasy values from the Auction Calculator.
1. The baby gloves come off, and the Nationals allow James Wood to break the MLB strikeout record.
Last season, the Nationals limited Wood’s plate appearances later in the season (average 105 PA in the first three months, 94 PA over the last three). Even with the throttling of playing time, Wood missed tying the total by just two strikeouts.
I’ve got 10 coming with one per position at C, 1B, 2B, 3B, SS, RP plus two at both OF and SP. While the first one will be catcher, we’re not going around the horn in that order, rather we’ll get spicier as we go through these in a Hot Ones-esque sort of way. You may have a different spice meter and I’m happy to hear if you think I have one firmly out of place.
C: Will Smith is the #1 Catcher on the Player Rater
How He Gets There: Mostly just by being himself. His career high 153 wRC+ last year came in just 110 games which relegated him to C7. His .345 BABIP seems ripe for regression against a .285 career mark, but he hit the ball much better last year to fuel that surge. It wasn’t just a bunch of bleeders and doinkers driving some extra hits in a sub-500 PA sample. I see him holding at least some of those gains while returning to the >500 PA plateau and easily paying off that C9 pricepoint. The competition is a bigger hurdle for this one than Smith’s skill but that’s also why it’s my opening salvo. They’ll get spicier!
Mike Trout wants to let you know he’s aiming to reach 30 feet per second, which is considered an elite sprint speed by Statcast.
Trout showed that he still has plenty of speed on Saturday, when he reached 29.9 feet per second trying to beat out an infield single against the D-backs. It was Trout’s fastest sprint speed since he first sustained his meniscus tear in his left knee in late April 2024, which he believes is a good sign.
…
For context, Trout, 34, averaged 27.9 feet per second last year, which ranked in the 62nd percentile and his fastest sprint speed was 29.7 feet per second. It was a drop off for Trout, who averaged 29.5 feet per second in ’23 (96th percentile) and 28.9 in ’24 (90th percentile) and regularly hit 30 feet per second.
But the drop was due to his issues with his left knee, as he tore his meniscus twice and had surgery twice in ’24. He returned last season but sustained a bone bruise in his left knee on April 30 when he stepped awkwardly on the first-base bag in Seattle. His fastest sprint speed of the season also came on that play. He returned May 30 but his speed wasn’t at his usual level.