wPDI & CSW: Residuals
Introduction
This is the third article in my series – wPDI & CSW. You can catch up by reading the first two articles – on called strikes and whiffs – found here and here.
Here is a quick recap of what we have covered so far:
In this series, we are looking at the PitcherList metric, CSW and how it relates to my plate discipline framework, wPDI. Last year’s FSWA Research Article of the Year by Alex Fast featured CSW, which is defined as:
Called Strikes + Whiffs
Total Pitches
With the Weighted Plate Discipline Index (wPDI) framework, all pitches are classified into six different outcomes as follows:
| Outcome | Outcome | Outcome | Outcome | Outcome | Outcome | |
|---|---|---|---|---|---|---|
| A | B | C | D | E | F | |
| Zone? | Out of Zone | Out of Zone | Out of Zone | In Zone | In Zone | In Zone |
| Swing? | Swung On | Swung On | No Swing | Swung On | Swung On | No Swing |
| Contact? | No Contact | Contact Made | No Swing | No Contact | Contact Made | No Swing |
Each outcome is then assigned a weight, or an index. A% through F% are the percent of pitches thrown in each outcome. The general formula for wPDI, the Weighted Plate Discipline Index is given as:
wPDI = IndexA * A% + IndexB * B% + IndexC * C% + IndexD * D% + IndexE * E% + IndexF * F%
In the first two articles of my series, we tackled various topics surrounding pitcher whiffs and called strikes. We touched on the effectiveness of umpires, on the correlation of foul balls to swinging strikes, and dealt with a few other assorted nuggets of understanding. Our primary objective was to express CSW within the wPDI framework. We landed on the following equation:
| Outcome | Description | Index |
|---|---|---|
| A | Out of Zone / Swung On / No Contact | 105% |
| B | Out of Zone / Swung On / Contact Made | 0% |
| C | Out of Zone / No Swing | 10% |
| D | In Zone / Swung On / No Contact | 110% |
| E | In Zone / Swung On / Contact Made | 0% |
| F | In Zone / No Swing | 90% |
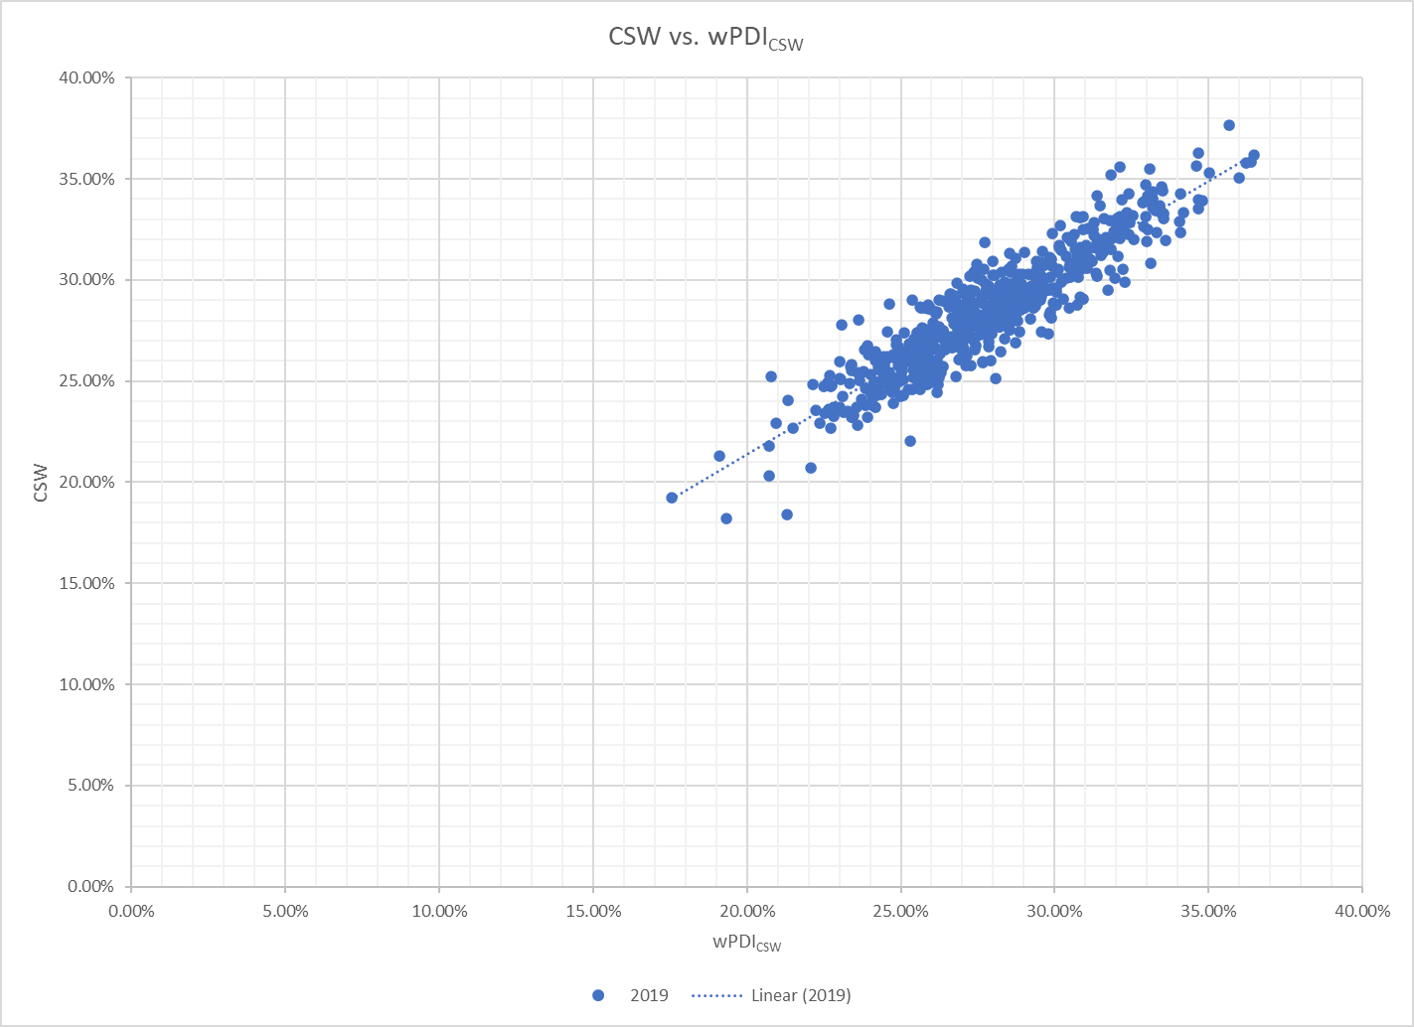
wPDICSW = 105% * A% + 10% * C% +110% * D% + 90% * F%
Our wPDI approximation of Fast’s CSW formula yielded a 92% correlation coefficient, which can be seen graphically here:
In today’s article, we will look at the pitchers who exhibited the largest differences between the PitcherList version of deception, and my own. As always, our in-depth look will tangentially lead to some interesting discussions and other findings.
2019 Leaderboard
Let’s start out by looking at the 2019 wPDICSW leaderboard. Below are the top CSW plate discipline pitchers with a minimum of 250 pitches thrown last season.
| Player | IP | wPDICSW | CSW | Diff |
|---|---|---|---|---|
| Ryan Pressly | 54.3 | .365 | .362 | +.003 |
| Austin Adams | 32.0 | .364 | .359 | +.005 |
| Nick Anderson | 65.0 | .362 | .358 | +.004 |
| Josh Hader | 75.7 | .360 | .351 | +.009 |
| JT Chargois | 21.3 | .357 | .377 | -.020 |
| Robert Stephenson | 64.7 | .350 | .353 | -.003 |
| Oliver Drake | 56.0 | .348 | .339 | +.009 |
| Ken Giles | 53.0 | .347 | .363 | -.016 |
| Jake Diekman | 62.0 | .347 | .335 | +.011 |
| Blake Snell | 107.0 | .347 | .340 | +.007 |
| Gerrit Cole | 212.3 | .346 | .357 | -.011 |
| Amir Garrett | 56.0 | .342 | .333 | +.009 |
| Zac Rosscup | 18.0 | .341 | .323 | +.018 |
| Chris Sale | 147.3 | .341 | .343 | -.002 |
| Corbin Burnes | 49.0 | .340 | .329 | +.012 |
| Joshua James | 61.3 | .336 | .320 | +.016 |
| Edwin Diaz | 58.0 | .336 | .333 | +.003 |
| Joe Jimenez | 59.7 | .335 | .330 | +.005 |
| Emilio Pagan | 70.0 | .335 | .344 | -.009 |
| Brandon Workman | 71.7 | .335 | .345 | -.010 |
| Adam Morgan | 29.7 | .335 | .333 | +.002 |
| Will Smith | 65.3 | .335 | .346 | -.011 |
| Hector Neris | 67.7 | .334 | .337 | -.003 |
| Tommy Kahnle | 61.3 | .333 | .324 | +.009 |
| Diego Castillo | 68.7 | .333 | .334 | -.001 |
| Tyler Glasnow | 60.7 | .332 | .336 | -.004 |
| Justin Verlander | 223.0 | .332 | .340 | -.008 |
| Noe Ramirez | 67.7 | .332 | .343 | -.012 |
| Jordan Hicks | 28.7 | .331 | .308 | +.023 |
| Giovanny Gallegos | 74.0 | .331 | .355 | -.024 |
| Andrew Miller | 54.7 | .330 | .325 | +.005 |
| Cody Stashak | 25.0 | .330 | .341 | -.011 |
| Jonathan Loaisiga | 31.7 | .330 | .319 | +.011 |
| Liam Hendriks | 85.0 | .330 | .332 | -.002 |
| Chaz Roe | 51.0 | .330 | .347 | -.017 |
| Adam Ottavino | 66.3 | .329 | .339 | -.009 |
| Lucas Giolito | 176.7 | .329 | .326 | +.003 |
| Mike Clevinger | 126.0 | .329 | .338 | -.010 |
| Darwinzon Hernandez | 30.3 | .326 | .320 | +.006 |
| Luke Jackson | 72.7 | .326 | .332 | -.006 |
| Jay Jackson | 30.3 | .325 | .329 | -.004 |
| Aroldis Chapman | 57.0 | .324 | .323 | +.002 |
| Max Scherzer | 172.3 | .324 | .343 | -.018 |
| Tanner Rainey | 48.3 | .324 | .329 | -.005 |
| Joe Kelly | 51.3 | .323 | .333 | -.010 |
| Jimmy Cordero | 37.3 | .323 | .299 | +.024 |
| Dinelson Lamet | 73.0 | .323 | .324 | -.001 |
| Peter Fairbanks | 21.0 | .322 | .331 | -.009 |
| Andres Munoz | 23.0 | .322 | .305 | +.017 |
| Trey Wingenter | 51.0 | .322 | .340 | -.018 |
| Raisel Iglesias | 67.0 | .321 | .327 | -.005 |
| Taylor Rogers | 69.0 | .321 | .356 | -.035 |
| Felipe Vazquez | 60.0 | .321 | .332 | -.010 |
| Yu Darvish | 178.7 | .321 | .321 | +.001 |
| Keone Kela | 29.7 | .320 | .312 | +.009 |
| Kenley Jansen | 63.0 | .320 | .331 | -.010 |
| Charlie Morton | 194.7 | .320 | .327 | -.007 |
| Jace Fry | 55.0 | .320 | .301 | +.019 |
| Scott Barlow | 70.3 | .319 | .324 | -.005 |
| Colin Poche | 51.7 | .319 | .321 | -.002 |
| Mychal Givens | 63.0 | .318 | .315 | +.003 |
| Brad Hand | 57.3 | .318 | .352 | -.034 |
| Oliver Perez | 40.7 | .318 | .329 | -.011 |
| Ray Black | 16.0 | .318 | .305 | +.013 |
| Collin McHugh | 74.7 | .318 | .316 | +.002 |
| Jose Alvarado | 30.0 | .317 | .295 | +.022 |
| Gerardo Reyes | 26.0 | .317 | .319 | -.002 |
| Matt Wisler | 51.3 | .317 | .321 | -.004 |
| Matt Barnes | 64.3 | .316 | .331 | -.014 |
| Chad Sobotka | 29.0 | .316 | .314 | +.002 |
| Zac Gallen | 80.0 | .316 | .318 | -.002 |
| Andrew Heaney | 95.3 | .315 | .312 | +.003 |
| Kirby Yates | 60.7 | .315 | .337 | -.022 |
| Andrew Kittredge | 49.7 | .314 | .320 | -.006 |
| Brandon Brennan | 47.3 | .314 | .302 | +.012 |
| Matt Magill | 50.7 | .314 | .319 | -.005 |
| Jimmie Sherfy | 18.3 | .314 | .342 | -.028 |
| Lucas Sims | 43.0 | .314 | .316 | -.002 |
| Felix Pena | 96.3 | .314 | .303 | +.010 |
| Joe Smith | 25.0 | .313 | .328 | -.016 |
| Stephen Strasburg | 209.0 | .313 | .322 | -.009 |
| Will Harris | 60.0 | .312 | .325 | -.013 |
| Roberto Osuna | 65.0 | .312 | .309 | +.003 |
| Jake Jewell | 26.3 | .312 | .316 | -.004 |
| Luis Castillo | 190.7 | .312 | .310 | +.002 |
Almost all of the elite members of the original wPDI formula appear at the top of the CSW version of the framework. That is hardly a coincidence, as four of the indexes are almost identical.
Andrew Kittredge and Sergio Romo are two relievers that seem to fall from the original list. The key difference can be found in their Outcome B component (out of zone, swung on, contact made). The aforementioned pair excel in generating swings out of the zone, albeit with contact. However, the quality of contact that they induce is superb. Kittredge and Romo sported hard hit contact rates of a 29% and 32% (respectively) in 2019. CSW does not look at any contact scenarios, whereas the original wPDI formula does.
For completion, as far as starting pitchers go – Stephen Strasberg, Zac Gallen and Mike Clevinger are the notable starting pitchers who fall from the original wPDI formula. The reasoning for their departure is in their Component E (in zone, swung on, contact made). The trio excelled at limiting contact in the zone (exceptionally low values of Component E), which was represented as a larger factor in the original formula. CSW does not distinguish between contact in and out of the zone.
Let’s now take a look at the residuals between CSW and its equation approximation, which is the main subject of today’s discussion.
Over-Fitters
Below are the pitchers who exhibit with the largest difference between wPDICSW to pure CSW, i.e. the over-fitters.
| Player | IP | wPDICSW | CSW | Diff |
|---|---|---|---|---|
| Reggie McClain | 21.0 | .253 | .220 | +.033 |
| Carl Edwards Jr. | 17.0 | .281 | .251 | +.029 |
| Ervin Santana | 13.3 | .213 | .184 | +.029 |
| Pedro Payano | 22.0 | .298 | .273 | +.025 |
| Jimmy Cordero | 37.3 | .323 | .299 | +.024 |
| Jordan Hicks | 28.7 | .331 | .308 | +.023 |
| Jose Alvarado | 30.0 | .317 | .295 | +.022 |
| Mike Mayers | 19.0 | .296 | .275 | +.021 |
| Wandy Peralta | 39.7 | .307 | .288 | +.020 |
| Ian Gibaut | 14.3 | .279 | .260 | +.019 |
| Jace Fry | 55.0 | .320 | .301 | +.019 |
| Jose Quijada | 29.7 | .309 | .291 | +.019 |
| D.J. Johnson | 25.0 | .305 | .286 | +.018 |
| Justin Wilson | 39.0 | .282 | .264 | +.018 |
| Trevor Rosenthal | 15.3 | .287 | .269 | +.018 |
| Luis Garcia | 62.0 | .299 | .281 | +.018 |
| Zac Rosscup | 18.0 | .341 | .323 | +.018 |
| Geoff Hartlieb | 35.0 | .262 | .244 | +.018 |
| Justin Anderson | 47.0 | .277 | .259 | +.017 |
| Juan Minaya | 27.7 | .277 | .259 | +.017 |
| Conner Menez | 17.0 | .308 | .292 | +.017 |
| Andres Munoz | 23.0 | .322 | .305 | +.017 |
| Joshua James | 61.3 | .336 | .320 | +.016 |
| Tayron Guerrero | 46.0 | .268 | .252 | +.016 |
| Tanner Scott | 26.3 | .298 | .283 | +.015 |
| Wade Davis | 42.7 | .273 | .257 | +.015 |
| Francisco Liriano | 70.0 | .299 | .284 | +.014 |
| Dominic Leone | 40.7 | .289 | .274 | +.014 |
| Reed Garrett | 15.3 | .221 | .207 | +.014 |
| Kyle Zimmer | 18.3 | .262 | .248 | +.014 |
| Austin Adams | 16.7 | .271 | .258 | +.013 |
| Ray Black | 16.0 | .318 | .305 | +.013 |
| Kyle Bird | 12.7 | .284 | .271 | +.013 |
| Kevin Ginkel | 24.3 | .300 | .288 | +.012 |
| Nick Goody | 40.7 | .303 | .291 | +.012 |
| Brandon Brennan | 47.3 | .314 | .302 | +.012 |
| Blake Treinen | 58.7 | .279 | .267 | +.012 |
| Lou Trivino | 60.0 | .292 | .281 | +.012 |
| Corbin Burnes | 49.0 | .340 | .329 | +.012 |
| Jake Diekman | 62.0 | .347 | .335 | +.011 |
The first item that jumps out to me is that these are primarily relievers, or more notably – those with few innings pitched on the season. Jace Fry, Luis Garcia, Joshua James, and Francisco Liriano have the largest differences of players with more than 50 innings, but all still have 70 innings or fewer. The top two pitchers with at least 100 innings were Dakota Hudson (+.009) and Blake Snell (+.007).
We will talk a bit about Blake Snell in a moment, but at first glance, it seems that errors in the approximation formula has more to do with sample size than with anything else. That of course, is an excellent result.
As for Blake Snell, let’s dive a bit further into his 2019 season as far as plate discipline goes.
| Player | Outcome A | Outcome B | Outcome C | Outcome D | Outcome E | Outcome F |
|---|---|---|---|---|---|---|
| Blake Snell | 12.3% | 9.9% | 37.8% | 5.4% | 21.3% | 13.3% |
We have seen that Snell’s Outcome A was the largest of any starting pitcher in baseball in 2019. It was the 3rd highest if we include relievers. His swinging strike rate was 17.7%, first in the majors for pitchers with at least 80 accumulated innings.
But was that the source of the residual?
My first thought was to check the foul tips for any abnormality. The league average ratio in 2019 of foul tips to pitches is 0.89%. Snell’s ratio was 1.00% – which squashes that thought. CSW (which includes foul tips) would be higher in this case.
Let’s now divide CSW into its underlying elements – called strikes and whiffs. We see that the majority of the discrepancy lies with his called strikes. The difference in CS% is +.005, but the W% is only +.002.
The key is in where Snell’s pitches are called strikes.
| Player | Called – In Zone | Called – Out of Zone | Called – Unknown |
|---|---|---|---|
| Blake Snell | 91.3% | 8.7% | 0.0% |
| All Players | 83.2% | 16.1% | 0.8% |
Snell generated far fewer called strikes out of the zone as a percentage of his called strikes in 2019. In fact, among starting pitchers – he had the lowest percentage. A few weeks back, I wrote about the debate of technology versus humanity. We discussed whether deceiving the umpire is a wanted sign of skill or not. Snell is an outlier case in this larger debate.
For Blake Snell in 2019, even with his incredible swinging strike rate, he was not getting a normal amount of in-zone called strikes. Was this related? Were umpires not giving him borderline calls because he was generating too many whiffs? Add that to the ever-growing list of future items to look at. For now, it seems (and we will assume) that Snell’s 2019 was somewhat random. Snell’s in-zone strikes comprised 82% of all called strikes from 2017 to 2018, which was close to an average figure. It is highly likely that this 2019 deviation was random noise caused by … umpires.
Under-Fitters
Below are the pitchers with the largest observed negative residuals between wPDICSW to pure CSW, i.e. the under-fitters.
| Player | IP | wPDICSW | CSW | Diff |
|---|---|---|---|---|
| Jesse Chavez | 78.0 | .231 | .278 | -.047 |
| Aaron Wilkerson | 16.0 | .208 | .252 | -.044 |
| Ryan Weber | 40.7 | .236 | .280 | -.044 |
| Adam Warren | 28.7 | .246 | .288 | -.042 |
| John Schreiber | 13.0 | .277 | .319 | -.041 |
| Craig Stammen | 82.0 | .254 | .290 | -.037 |
| Taylor Rogers | 69.0 | .321 | .356 | -.035 |
| Brad Hand | 57.3 | .318 | .352 | -.034 |
| A.J. Cole | 26.0 | .275 | .308 | -.033 |
| Pat Neshek | 18.0 | .275 | .306 | -.032 |
| David Price | 107.3 | .268 | .299 | -.030 |
| Sean Manaea | 29.7 | .274 | .304 | -.030 |
| Bryse Wilson | 20.0 | .256 | .287 | -.030 |
| Rafael Montero | 29.0 | .280 | .309 | -.030 |
| Josh Tomlin | 79.3 | .230 | .260 | -.030 |
| Alec Mills | 36.0 | .273 | .302 | -.029 |
| Yusmeiro Petit | 83.0 | .257 | .286 | -.029 |
| David Phelps | 34.3 | .245 | .275 | -.029 |
| Trevor Gott | 52.7 | .259 | .288 | -.029 |
| Luis Perdomo | 72.0 | .258 | .286 | -.029 |
| Tyler Mahle | 129.7 | .277 | .305 | -.028 |
| Julio Teheran | 174.7 | .239 | .267 | -.028 |
| Jimmie Sherfy | 18.3 | .314 | .342 | -.028 |
| Matt Hall | 23.3 | .285 | .313 | -.028 |
| Ian Kennedy | 63.3 | .262 | .290 | -.028 |
| Brock Stewart | 25.7 | .238 | .265 | -.027 |
| Zach Davies | 159.7 | .221 | .249 | -.027 |
| Tommy Milone | 111.7 | .266 | .293 | -.027 |
| Anthony Kay | 14.0 | .213 | .240 | -.027 |
| Archie Bradley | 71.7 | .266 | .293 | -.027 |
| Masahiro Tanaka | 182.0 | .259 | .286 | -.026 |
| Jake Newberry | 31.0 | .259 | .286 | -.026 |
| Joey Lucchesi | 163.7 | .264 | .290 | -.026 |
| Wily Peralta | 40.3 | .227 | .253 | -.026 |
| Chris Paddack | 140.7 | .275 | .301 | -.026 |
| Seth Lugo | 80.0 | .302 | .327 | -.025 |
| Nick Wittgren | 57.7 | .270 | .295 | -.025 |
| Jose Rodriguez | 19.7 | .234 | .258 | -.024 |
| Rich Hill | 58.7 | .307 | .331 | -.024 |
| Brad Peacock | 91.7 | .268 | .292 | -.024 |
| Giovanny Gallegos | 74.0 | .331 | .355 | -.024 |
| Aaron Nola | 202.3 | .299 | .323 | -.024 |
What jumps out to me is the following:
- The magnitude of the top under-fitters is far larger than that of the over-fitters.
- The players with the largest difference from empirical to formula tend to be low valued players.
- We still mainly see low innings present, but a few high-volume starting pitchers now begin to creep in.
Let’s do a deeper dive into the first starting pitcher of note on this list, David Price.
| Player | Outcome A | Outcome B | Outcome C | Outcome D | Outcome E | Outcome F |
|---|---|---|---|---|---|---|
| David Price | 5.8% | 11.5% | 40.5% | 5.4% | 24.8% | 11.9% |
What a stark difference to Snell’s 2019 season – especially in the swings and misses. Price’s Outcome A is quite poor, at 5.8%. That seems to be the primary source of his below average wPDICSW. If we look into the CSW underlying elements – we see once again that the difference lies within the called strikes. His W% residual is -.003, whereas the CS% is a much more significant -.027.
Taking a look into the zone location detail of Price’s called strikes yields:
| Player | Called – In Zone | Called – Out of Zone | Called – Unknown |
|---|---|---|---|
| David Price | 73.6% | 26.4% | 0.0% |
| All Players | 83.2% | 16.1% | 0.8% |
The zone data depicts the mirror image story that we saw in Blake Snell. Where the strikes are called matters. There is also a compounding effect going on. Pitchers who tend throw more of their called strikes in the zone will certainly have a better CSW, but formulaically, they also get to take even more advantage of the wPDI index structure.
Conclusion
The differences between CSW and our wPDICSW regression formula are mostly random noise, the effects of which diminish with large sample sizes.
However, we can detect that there is a relationship between the distribution of called strikes (in zone vs. out of the zone) and the over/under fitting of our equation. Pitchers who have larger than average in-zone called strikes will tend to see a better wPDI result, and those with a poor in-zone percentage will have worse results.
The zone relationship is mostly negated for larger sample sizes (and thus for starting pitchers), but is more pronounced for smaller CSW values.
Bottom line – the wPDICSW regression is a good one, and may even be more indicative of what it takes to be a good pitcher, as it removes some of the umpire bias that pure CSW displays.
Ariel is the 2019 FSWA Baseball Writer of the Year. Ariel is also the winner of the 2020 FSWA Baseball Article of the Year award. He is the creator of the ATC (Average Total Cost) Projection System. Ariel was ranked by FantasyPros as the #1 fantasy baseball expert in 2019. His ATC Projections were ranked as the #1 most accurate projection system over the past three years (2019-2021). Ariel also writes for CBS Sports, SportsLine, RotoBaller, and is the host of the Beat the Shift Podcast (@Beat_Shift_Pod). Ariel is a member of the inaugural Tout Wars Draft & Hold league, a member of the inaugural Mixed LABR Auction league and plays high stakes contests in the NFBC. Ariel is the 2020 Tout Wars Head to Head League Champion. Ariel Cohen is a fellow of the Casualty Actuarial Society (CAS) and the Society of Actuaries (SOA). He is a Vice President of Risk Management for a large international insurance and reinsurance company. Follow Ariel on Twitter at @ATCNY.
This wPDI series has been a stunning read. Are you able to approximate a conversion to K% in the same way we can double SwStr% or subtract Contact%?
Thank you so much!
In an article to come shortly, we will look at K%. 🙂