wPDI & CSW: Called Strikes
Introduction
Last year’s FSWA Research Article of the Year, CSW Rate: An Intro to an Important New Metric, was awarded to Alex Fast of PitcherList. In his article, Alex presents the pitching statistic, CSW – a metric which was originally coined and created by Nick Pollack in 2018. As cited in the author’s article summary, CSW is more predictive than Swinging Strike Rate (SwStr%), and is more descriptive than Whiff Rate (Whiff%).
The short and simple formula for CSW is defined as follows:
Called Strikes + Whiffs
Total Pitches
I enjoy elegant formulae. Sure – wOBA, wRC+ and the like are extraordinary metrics in their own right, but they are not the simplest to jot down. CSW is plain, simple, easy to understand, and nicely predictive.
Coincidentally, and unknowing of CSW, I came up with the concept of wPDI back in 2018. I then published my first works of the plate discipline framework on April 2, 2019. The original article was entitled Introducing: Weighted Plate Discipline Index (wPDI) for Pitchers, and can be found here.
What jumped out to me immediately upon reading Fasts’s article – was that the two metrics have something very in common. CSW and wPDI both share the very same denominator – Total Pitches. The base of both of our metrics are identical. Both utilize the very same sample size, both stabilize just as quickly, and both describe baseball through the very same lens – the pitch.
As a quick reminder of how wPDI works, every pitch can be classified into 6 possible pitching outcomes.
The definition of each outcome is as follows:
| Outcome | Outcome | Outcome | Outcome | Outcome | Outcome | |
|---|---|---|---|---|---|---|
| A | B | C | D | E | F | |
| Zone? | Out of Zone | Out of Zone | Out of Zone | In Zone | In Zone | In Zone |
| Swing? | Swung On | Swung On | No Swing | Swung On | Swung On | No Swing |
| Contact? | No Contact | Contact Made | No Swing | No Contact | Contact Made | No Swing |
Each and every pitch thrown at a baseball game can be classified into one of the above six categories based on just three questions, or three binary events:
- Was the ball thrown in the strike zone?
- Was the ball swung on?
- Did the batter make contact with the ball?
Each outcome is then assigned a weight (an index). In my initial wPDI article, I suggested the following indexes:
| Outcome | Description | Index |
|---|---|---|
| A | Out of Zone / Swung On / No Contact | 100% |
| B | Out of Zone / Swung On / Contact Made | 65% |
| C | Out of Zone / No Swing | 10% |
| D | In Zone / Swung On / No Contact | 90% |
| E | In Zone / Swung On / Contact Made | 0% |
| F | In Zone / No Swing | 80% |
The formula for wPDI, the Weighted Plate Discipline Index is given as:
wPDI = IndexA * A% + IndexB * B% + IndexC * C% + IndexD * D% + IndexE * E% + IndexF * F%
wPDI is calculated on a per pitcher basis. A% through F% are the percent of pitches thrown in each outcome. wPDI operates with a linear framework to combine all possible pitching outcomes into a singular all-encompassing (and sortable) metric. In theory, wPDI can be tailored to correlate to strikeouts, to whiffs, to walk rate, to deception, or to whatever the user chooses. wPDI is simply a framework, with the most elementary event of the pitch as its root.
Going back to CSW – we have already established that the metric contains the same base as wPDI, so I ask the following questions:
Is CSW simply a special case of wPDI?
Can we establish or approximate CSW using the proper weights of indexes A … F?
To answer these, I will separate CSW into its two components – the Called Strikes (CS), and the Whiffs (W). In today’s article, I will tackle the called strikes component. In my following article, I will cover the whiffs.
Called Strikes
Before delving further into tying in CSW with wPDI, it is important to understand where upon the data arises for each metric. According to Fast, CSW uses Baseball Savant as its primary source of data. wPDI on the other hand, uses FanGraphs plate discipline data – and more specifically the five metrics of:
- Zone%
- Z-Swing%
- O-Swing%
- Z-Contact%
- O-Contact%
There will always be incongruities between data sources, which is not the subject of today’s article. Instead, I want to focus on the two metrics at hand. For the moment, I will downplay any inconsistencies between Baseball Savant and FanGraphs data.
Alex Fast’s first part of the CSW formula is the called strikes. Specifically, we can define CS% as:
Called Strikes
Total Pitches
The event is not defined by Fast using pitch location – rather, it is up to the umpire himself to call the pitch as such. It is a humanistic determination of what constitutes a strike – and the umpire is the ultimate source of Fast’s formula.
On one hand, I like that idea. Pitch deception is somewhat dependent upon how a pitcher can fool the umpire, or how a catcher can frame the pitch. That very human element is indeed quite relevant, and more importantly, it counts as far as the game of baseball is played … so long as we still have human umpires.
On the other hand, relying on a manual call introduces some statistical noise into rating a pitcher’s effectiveness. The accuracy of the umpire now comes into play, as well as the catcher’s ability to frame a ball. There would potentially be a large difference in Clayton Kershaw’s called strike rate while pitching to a poor framer, versus throwing to an elite one. Max Scherzer might see a different called strike rate if Angel Hernandez umpired all of his games, and so on …
To get a sense of the inaccuracy of umpires, or of the inaccuracy of the recording technology (or both) – below are all of the called strikes from the 2019 baseball season:
| All | In Zone | Out of Zone | Unknown | |
|---|---|---|---|---|
| Called Strikes | 120,337 | 100,061 | 19,345 | 931 |
| % of Total | 100.0% | 83.2% | 16.1% | 0.8% |
The data above comes from Baseball Savant. As you can clearly see, umpires do not always agree with the way that a pitch is classified by Statcast. In fact, there is a rather large gap of disagreement; they differ almost one sixth of the time. Adding further to that, for almost 1% of the pitches – the technology cannot even classify the given pitch.
The discussion of the use of robotic umpires will certainly resurface in the near future. Perhaps it will be revisited shortly after the world returns back to its normal state (from the COVID pandemic). For now, the question at hand is as follows:
How we can approximate, or emulate called strikes from our three binary plate discipline questions?
My first thought is to simply set wPDI parameters as follows:
| Outcome | Description | Index |
|---|---|---|
| A | Out of Zone / Swung On / No Contact | 0% |
| B | Out of Zone / Swung On / Contact Made | 0% |
| C | Out of Zone / No Swing | 0% |
| D | In Zone / Swung On / No Contact | 0% |
| E | In Zone / Swung On / Contact Made | 0% |
| F | In Zone / No Swing | 100% |
Outcome F refers to balls thrown in the zone, that are not swung at. Theoretically, setting wPDI solely to aggregate Outcome F scenarios should be the correct proxy for called strikes. Pitches is the zone should be called strikes, and all other pitches should in theory be balls!
However, as we have seen above, many pitches out of the zone are called as strikes. Likewise (although to a lower rate), there are of course many pitches in the zone that are incorrectly called as balls.
Let’s start by looking at the top called strike (CS%) performers from 2019, and their associated Outcome F (F%) percentages – to get a sense of their relationship:
| Name | CS% | F% | CS% to F% Ratio |
|---|---|---|---|
| Chaz Roe | 24.2% | 20.5% | 118.4% |
| Taylor Rogers | 23.8% | 18.6% | 128.3% |
| Buddy Boshers | 23.4% | 19.8% | 118.5% |
| Joe Smith | 23.0% | 19.4% | 118.1% |
| Dillon Tate | 22.6% | 19.4% | 116.1% |
| Joe Kelly | 22.3% | 19.7% | 113.0% |
| Adam Ottavino | 22.0% | 18.3% | 120.2% |
| James Sherfy | 21.8% | 16.5% | 132.6% |
| Matt Hall | 21.6% | 16.0% | 135.0% |
| Ryan Weber | 21.5% | 14.7% | 146.6% |
| JT Chargois | 21.2% | 16.1% | 131.6% |
| Tyler Glasnow | 21.2% | 18.5% | 114.5% |
| Josh D. Smith | 21.1% | 15.8% | 133.2% |
| Brandon Workman | 20.9% | 17.2% | 121.4% |
| Rich Hill | 20.8% | 17.3% | 120.3% |
| Brad Hand | 20.6% | 15.3% | 134.4% |
| Sam Gaviglio | 20.6% | 16.3% | 126.5% |
| Aaron Nola | 20.5% | 15.8% | 129.9% |
| Phillips Valdez | 20.5% | 17.8% | 115.3% |
| Seth Lugo | 20.5% | 15.8% | 129.7% |
As you can see upon visual inspection, the CS% rates are all higher than the F% rates. The average ratio of CS% to F% is 125.2% for the top 20 players, and 125.0% for the entire player population.
Below is a graph of CS% vs F% all players in 2019 who threw at least 250 pitches:
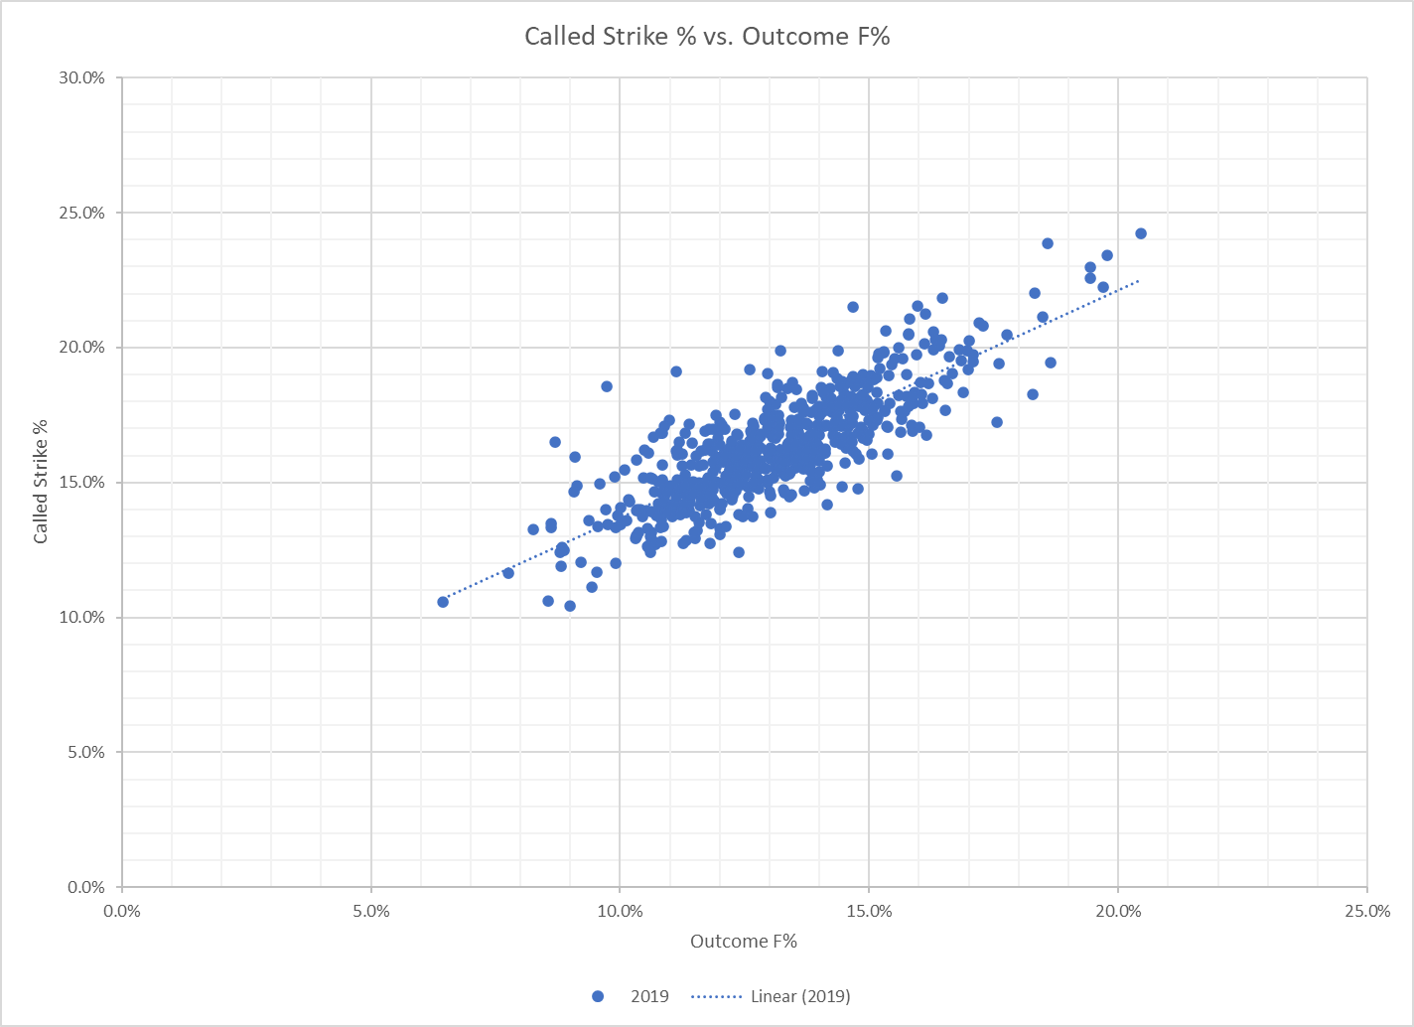
The result is a clearly a linear relationship. In fact, upon running a regression analysis, we find that the optimal multiplier of F% to obtain CS% is 123.6%, with an R-Squared value of 99.3%! [I assume a zero intercept for all of today’s analysis.]
Before we crown the approximation of CS% = 123.6% * F% – since we do have the other outcomes (A to E) at our disposal, we might as try well run a full regression analysis using all six plate discipline outcomes.
| Index A | Index B | Index C | Index D | Index E | Index F |
|---|---|---|---|---|---|
| -7.0% | 9.8% | 10.8% | -3.2% | -1.4% | 90.1% |
The full multipliers obtained from the regression are listed above. They come with a whopping R-Squared value of 99.6%. This is even higher than before! However, the coefficients of Outcomes D & E are quite small, and either way – I am not a fan of negative coefficients for wPDI. They simply are not intuitive to what we want wPDI to represent.
My next step is to run the regression using only Outcomes B, C and F. The resulting coefficients are:
| Index B | Index C | Index F |
|---|---|---|
| 8.3% | 9.5% | 88.1% |
The R-Squared for this run is 99.5%. I already enjoy this result more than the previous one which makes use of all six outcomes. As many familiar with statistical process know, we often try to reduce the number of variables in a regression equation – where the variable does not contribute much to the overall results. Like most things in life, it is good to reduce the clutter.
Intuitively, we know why Outcome F (In the zone, no swing) belongs in the approximation equation for a swinging strike. We can also easily understand why Outcome C makes sense – as there are a certain fraction of pitches that are thrown out of the zone, yet are called strikes by umpires. In fact, below is a breakdown of all out of the zone pitches thrown in 2019:
| All | Called Ball | Called Strike | |
|---|---|---|---|
| Out of Zone | 270,008 | 250,663 | 19,345 |
| % of Total | 100.0% | 92.8% | 7.2% |
Above, I have enumerated the percentage of out of zone pitches that were incorrectly called (or that Statcast says so). To be technical, hit by pitches are included in the ‘called balls,’ but I have excluded intentional or automatic balls in my counts.
We see that on average, 7.2% of out of zone pitches are called for strikes. For that reason, I believe that Outcome C should be included in our equations for CS%.
Interestingly, Outcome B (Out of the zone, swung on and contacted) still shows significant weight in the regression equation. However, I do not see and cannot think of an intuitive connection between the outcome in question and a swinging strike. Hence, I am going to run one final regression with only Outcomes C & F as the only variables.
| Index C | Index F |
|---|---|
| 11.6% | 88.7% |
The above are the resulting indexes for the two remaining outcomes. The associated R-Squared did not deteriorate, and remains at a lofty 99.5%. Rounding each weight to the nearest 5%, I will finalize and officially define the wPDI indices for called strike rate as:
| Outcome | Description | Index |
|---|---|---|
| A | Out of Zone / Swung On / No Contact | 0% |
| B | Out of Zone / Swung On / Contact Made | 0% |
| C | Out of Zone / No Swing | 10% |
| D | In Zone / Swung On / No Contact | 0% |
| E | In Zone / Swung On / Contact Made | 0% |
| F | In Zone / No Swing | 90% |
wPDICS = 10% * C% + 90% * F%
Interestingly, the C coefficient of the original wPDI equation remains identical (at 10%), and the F coefficient is raised from 80% to 90%. That is not coincidental. Using the rounded figures, the R-Squared still remains at 99.5%, which is an extremely high result for any regression.
Below is the resulting X-Y graph plotting the wPDI formula for called strikes to the CSW definition for 2019. The picture looks quite similar to the one above, and is even closer to linear.
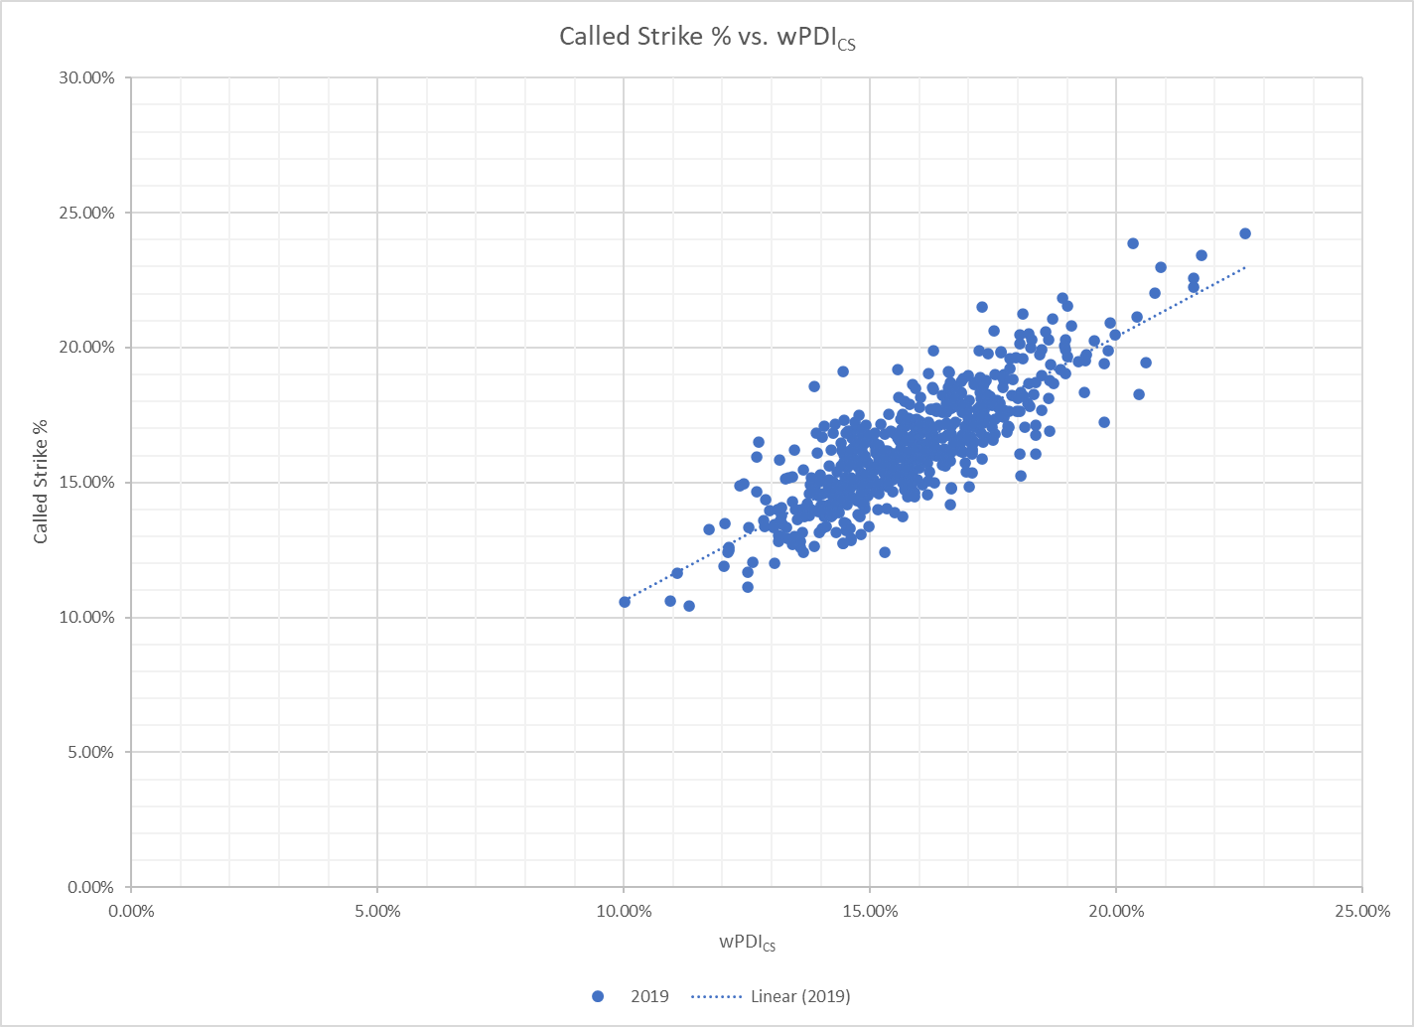
A nice outcome for wPDI both in its simplicity and in its accuracy!
–
In my next article, I will move on to quantifying Whiff% using the wPDI framework.
Many thanks to Alex Fast of PitcherList for his groundwork on the statistic, and for his assistance to me in obtaining CSW data for this article.
Ariel is the 2019 FSWA Baseball Writer of the Year. Ariel is also the winner of the 2020 FSWA Baseball Article of the Year award. He is the creator of the ATC (Average Total Cost) Projection System. Ariel was ranked by FantasyPros as the #1 fantasy baseball expert in 2019. His ATC Projections were ranked as the #1 most accurate projection system over the past three years (2019-2021). Ariel also writes for CBS Sports, SportsLine, RotoBaller, and is the host of the Beat the Shift Podcast (@Beat_Shift_Pod). Ariel is a member of the inaugural Tout Wars Draft & Hold league, a member of the inaugural Mixed LABR Auction league and plays high stakes contests in the NFBC. Ariel is the 2020 Tout Wars Head to Head League Champion. Ariel Cohen is a fellow of the Casualty Actuarial Society (CAS) and the Society of Actuaries (SOA). He is a Vice President of Risk Management for a large international insurance and reinsurance company. Follow Ariel on Twitter at @ATCNY.