wPDI & CSW: Whiffs
This is the second article of my series – wPDI vs. CSW. For those new to either metric, I will quickly catch you up. [The opening article can be found here.]
In last year’s FSWA Research Article of the Year, CSW Rate: An Intro to an Important New Metric, Alex Fast of PitcherList examines his site’s pitching statistic, CSW. The short and simple formula for CSW is defined as follows:
Called Strikes + Whiffs
Total Pitches
Independently, I came up with the concept of Weighted Plate Discipline Index (wPDI). With wPDI, we ask just three questions, or three binary events for every pitch:
- Was the ball thrown in the strike zone?
- Was the ball swung on?
- Did the batter make contact with the ball?
Every pitch can then be classified into 6 possible pitching outcomes based on the above. The definition of each outcome is as follows:
| Outcome | Outcome | Outcome | Outcome | Outcome | Outcome | |
|---|---|---|---|---|---|---|
| A | B | C | D | E | F | |
| Zone? | Out of Zone | Out of Zone | Out of Zone | In Zone | In Zone | In Zone |
| Swing? | Swung On | Swung On | No Swing | Swung On | Swung On | No Swing |
| Contact? | No Contact | Contact Made | No Swing | No Contact | Contact Made | No Swing |
Each outcome is then assigned a weight, or an index. The formula for wPDI, the Weighted Plate Discipline Index is then given as:
wPDI = IndexA * A% + IndexB * B% + IndexC * C% + IndexD * D% + IndexE * E% + IndexF * F%
A% through F% are the percent of pitches thrown in each outcome, and the indexes are linear multipliers to obtain the aggregated, sortable metric.
What CSW has most in common with wPDI, is that it shares the same denominator – Total Pitches. That being the case, we can attempt to use the wPDI framework to express the PitcherList metric. CSW is rooted in Baseball Savant data, while wPDI is fed by FanGraphs figures. By exploring the similarities and differences between the metrics, we can also uncover some great nuggets of understanding.
To start, I have separated out CSW into its two components – the Called Strikes (CS), and the Whiffs (W). In the previous article, I tackled the called strikes component. In today’s article, I will cover the whiffs.
Whiffs
First, to focus the whiffs part of CSW, let’s start with a simple definition. The Whiff Rate (W%) can be calculated as:
Whiffs
Total Pitches
In attempting to formulize W% using the wPDI framework, my immediate and opening thought is to set the wPDI parameters as follows:
| Outcome | Description | Index |
|---|---|---|
| A | Out of Zone / Swung On / No Contact | 100% |
| B | Out of Zone / Swung On / Contact Made | 0% |
| C | Out of Zone / No Swing | 0% |
| D | In Zone / Swung On / No Contact | 100% |
| E | In Zone / Swung On / Contact Made | 0% |
| F | In Zone / No Swing | 0% |
Outcome A refers to pitches thrown out of the zone, swung on and missed. Outcome D covers pitches in the zone that are swung on and missed. Theoretically, if all data parties are in sync, simply adding up Outcomes A & D using FanGraphs data should exactly represent the Baseball Savant equivalent.
Let’s take a quick look at just how close [wPDI’s] Outcomes A & D are to [CSW’s] Whiff%. Below are the top 20 Whiff (W%) performers from 2019, and their associated Outcome A + D (A+D%) percentages:
| Name | W% | A+D% | W% to A+D% Ratio |
|---|---|---|---|
| Josh Hader | 24.6% | 22.9% | 107.8% |
| Nick Anderson | 20.4% | 19.5% | 104.7% |
| Ken Giles | 20.2% | 18.8% | 107.8% |
| Robert Stephenson | 19.6% | 18.9% | 103.6% |
| Edwin Diaz | 19.5% | 18.0% | 108.4% |
| Emilio Pagan | 19.3% | 17.7% | 108.9% |
| Colin Poche | 18.7% | 17.2% | 108.7% |
| Blake Snell | 18.7% | 17.7% | 105.6% |
| Tanner Rainey | 18.7% | 16.9% | 110.4% |
| Hector Neris | 18.7% | 17.7% | 105.6% |
| Tommy Kahnle | 18.6% | 17.9% | 103.9% |
| Jay Jackson | 18.6% | 17.9% | 103.8% |
| Gerrit Cole | 18.6% | 16.8% | 110.5% |
| Liam Hendriks | 18.5% | 17.2% | 107.3% |
| Ryan Pressly | 18.3% | 17.7% | 103.4% |
| Corbin Burnes | 18.2% | 17.2% | 105.7% |
| Gerardo Reyes | 18.1% | 15.7% | 115.3% |
| Roberto Osuna | 18.1% | 16.9% | 107.4% |
| Luke Jackson | 17.9% | 16.7% | 107.6% |
| Cody Stashak | 17.9% | 17.1% | 104.8% |
Upon visual inspection, we clearly see that the W% rates are all higher than the A+D% rates – by some 5-10%. The average ratio of W% to A+D% is 107% for the top 20 players, and 108% for the entire player population.
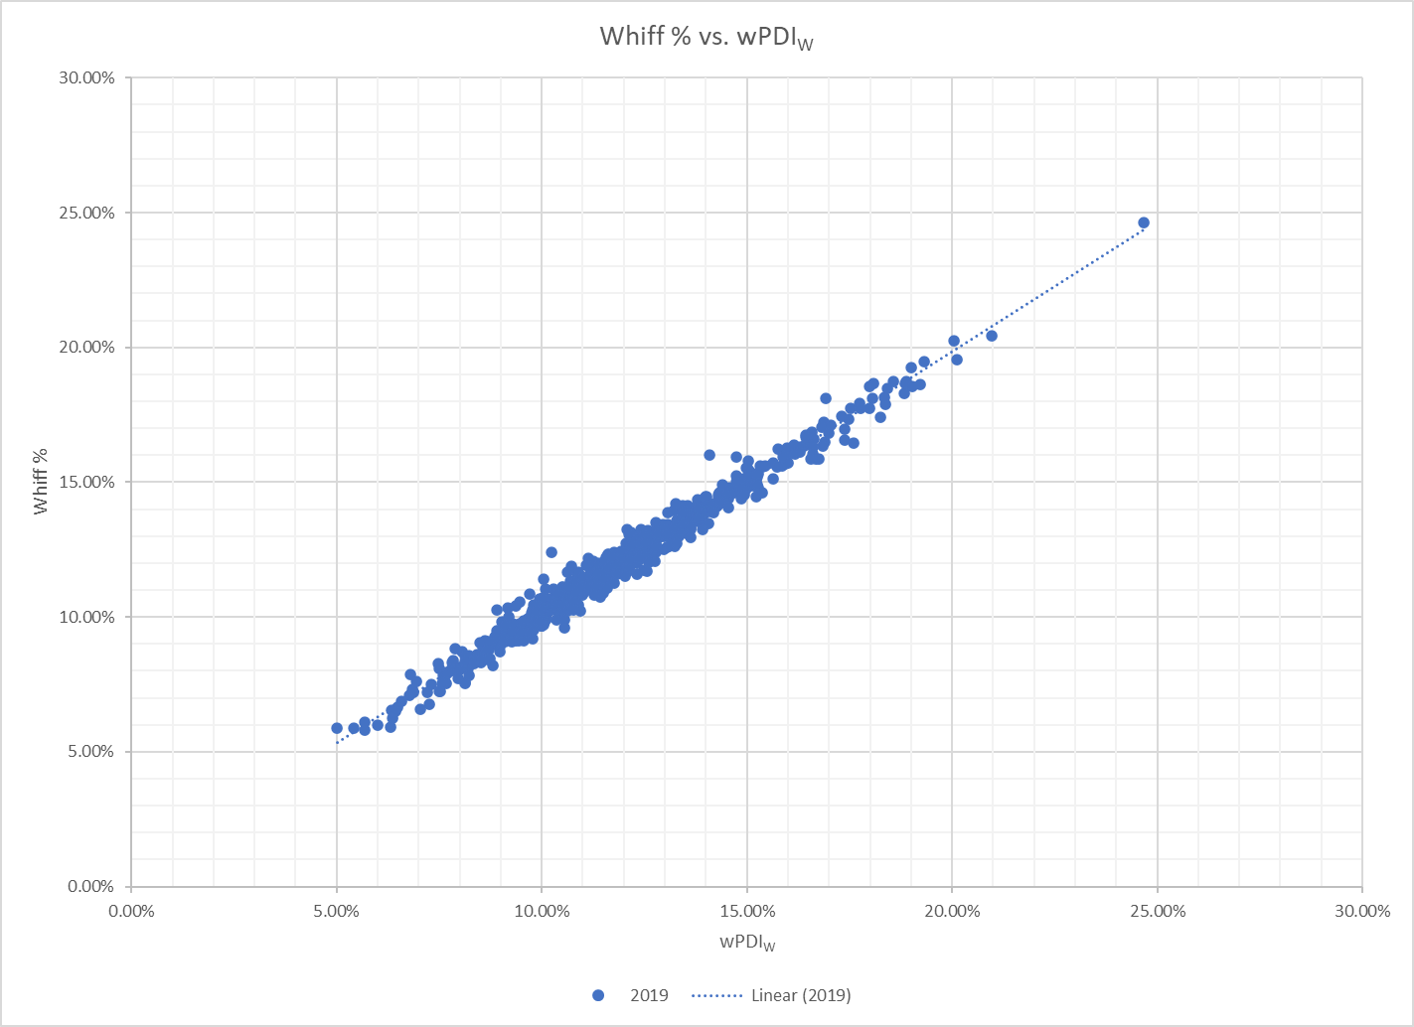
Below is a graph of W% vs. A+D% all players in 2019 who threw at least 250 pitches:

It appears that my first instinct was correct. There is a strong linear relationship present. Using regression analysis, the optimal multiplier (of A+D%) to obtain W% is 107.65%, with an R-Squared value of 99.885%! [I will once again assume a zero intercept for all analysis.]
The question is – why are there an extra 7-8% whiffs in the CSW calculation [above what FanGraphs data would indicate]? There must be some something missing here.
In talking with Alex Fast, the difference is in the foul tips. Baseball Savant has decided to include foul tips in their calculation of whiffs. Below is a summary of all whiffs that were generated in 2019.
| All | Swinging Strikes | Foul Tips | |
|---|---|---|---|
| Whiffs | 88,527 | 82,030 | 6,497 |
| % of Total | 100.0% | 92.7% | 7.3% |
There it is! All whiffs divided by swinging strikes comes out to 107.9% – the multiplier that we were looking for.
At the moment, I will not debate whether foul tips should or should not be included in the calculation of whiffs (and CSW). That is for another time, perhaps later on in this series. For now, let’s take Savant’s inclusion at face value and continue to work on representing whiffs using the wPDI framework.
Just as with called strikes, it is wise to consider using all of our available variables to generate the best representation of wPDI. Using all six outcomes (A – F), the following would be the regression multipliers for whiffs:
| Index A | Index B | Index C | Index D | Index E | Index F |
|---|---|---|---|---|---|
| 102.0% | 1.3% | -0.4% | 107.3% | 2.4% | -1.2% |
Just as suspected, outcomes A & D are the key variables to the equation. All of the other weights are negligible … but I do find one aspect interesting. Indexes for outcomes C & F are slightly negative, while indexes for outcomes B & E are slightly positive.
Intuitively, the signed results make sense. Outcomes C & F are the non-swinging ones, whereas B & E are the swinging with contact events. It makes sense that whiffs are slightly negatively correlated with takes, and slightly positively correlated with contact.
I might have expected a bit more weight for indexes B & E. One would think that foul tips should theoretically arise from FanGraphs contact events. Instead, we find that foul tips are better modeled using a multiplier for Outcome D. That is eye opening. It tells us that foul tips are highly correlated to pure swinging strikes. In fact, the observed correlation coefficient between the two is over 90%. [Perhaps this is one reason why Baseball Savant choose to include foul tips in their whiff calculations.]
With the above as evidence, our next step is to focus back on only Outcomes A & D, and to disregard all other variables. For the next regression attempt, I will break out outcomes A & D separately.
| Index A | Index D |
|---|---|
| 104.5% | 112.5% |
The above are the resulting indexes for the two remaining outcomes. The associated R-Squared is still at a lofty 99.89%. For the final wPDI Whiff indexes, I will round each weight to the nearest 5%. This will not diminish the effectiveness of the overall calculation, and yet is still more accurate than using a single multiplier for A+D% combined.
| Outcome | Description | Index |
|---|---|---|
| A | Out of Zone / Swung On / No Contact | 105% |
| B | Out of Zone / Swung On / Contact Made | 0% |
| C | Out of Zone / No Swing | 0% |
| D | In Zone / Swung On / No Contact | 110% |
| E | In Zone / Swung On / Contact Made | 0% |
| F | In Zone / No Swing | 0% |
wPDIW = 105% * A% + 110% * D%
The resulting X-Y plot of the wPDIW formula to Whiffs for individual pitchers in 2019 is as follows, which is quite linear – even more so than the called strikes graph:
CSW
Finally, let’s put it all together. We can we combine the called strikes wPDI regression (wPDICS) with today’s whiffs formula (wPDIW) to yield:
| Outcome | Description | Index |
|---|---|---|
| A | Out of Zone / Swung On / No Contact | 105% |
| B | Out of Zone / Swung On / Contact Made | 0% |
| C | Out of Zone / No Swing | 10% |
| D | In Zone / Swung On / No Contact | 110% |
| E | In Zone / Swung On / Contact Made | 0% |
| F | In Zone / No Swing | 90% |
wPDICSW = 105% * A% + 10% * C% +110% * D% + 90% * F%
There we have it! CSW can now be fully approximated, and expressed using the FanGraphs wPDI component data. The resulting X-Y plot between the two is as follows, yielding a 92% coefficient of correlation:
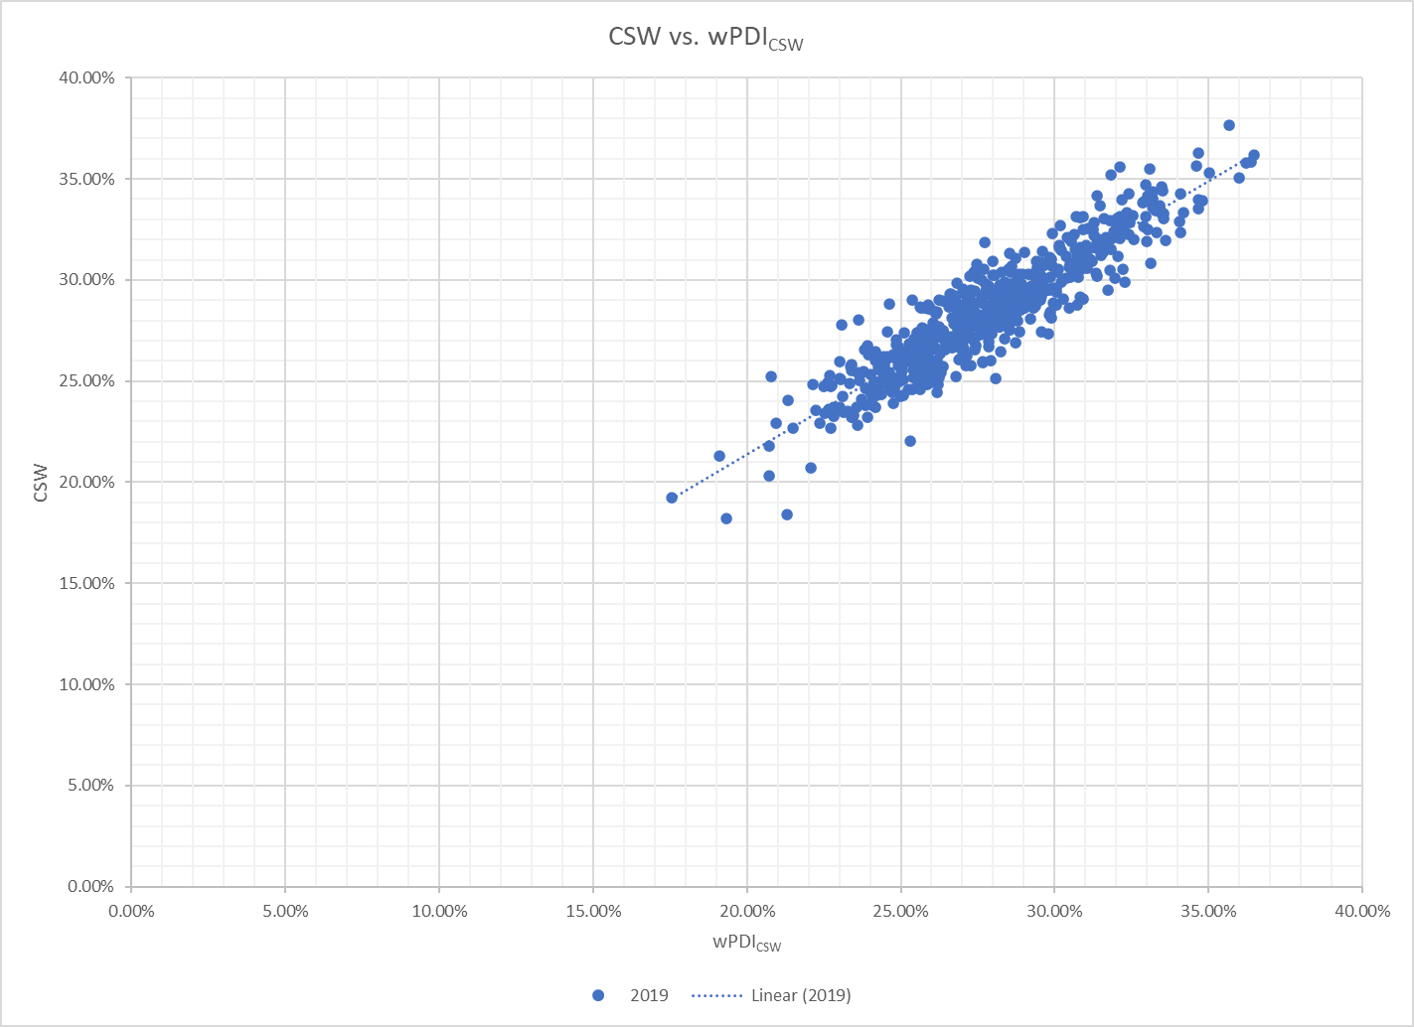
One quick note: The formulation of the whiffs portion of this equation yielded far more accuracy than the regression for called strikes. The overall CSW approximation still provides an excellent overall fit.
–
There are still so many other questions, which wPDI may help us uncover. Some outstanding items include (but are not limited to):
- How are Outcomes B & E related to the effectiveness or deceptiveness of a pitcher?
- Are there refinements to wPDICSW that can improve the correlation of CSW to strikeouts?
- How do walks figure into all of this?
- How helpful is the inclusion of foul tips in whiffs? Do they make CSW more predictive?
- For which pitchers is there a large difference between Alex Fast’s CSW and my wPDICSW formula?
- What about hitters? What does the offensive equivalent of wPDICSW look like?
I will aim to tackle many of these questions in further articles. Stay tuned.
Ariel is the 2019 FSWA Baseball Writer of the Year. Ariel is also the winner of the 2020 FSWA Baseball Article of the Year award. He is the creator of the ATC (Average Total Cost) Projection System. Ariel was ranked by FantasyPros as the #1 fantasy baseball expert in 2019. His ATC Projections were ranked as the #1 most accurate projection system over the past three years (2019-2021). Ariel also writes for CBS Sports, SportsLine, RotoBaller, and is the host of the Beat the Shift Podcast (@Beat_Shift_Pod). Ariel is a member of the inaugural Tout Wars Draft & Hold league, a member of the inaugural Mixed LABR Auction league and plays high stakes contests in the NFBC. Ariel is the 2020 Tout Wars Head to Head League Champion. Ariel Cohen is a fellow of the Casualty Actuarial Society (CAS) and the Society of Actuaries (SOA). He is a Vice President of Risk Management for a large international insurance and reinsurance company. Follow Ariel on Twitter at @ATCNY.
Fantastic stuff, thank you! Keep rolling up the sleeves and digging in, Ariel!
Thank you very much!
I love this. One question though, why is it in rotographs instead of fangraphs?
Do you have a Google sheet with the wPDI’s which is updated that you can link? Will it be added to a fangraphs leaderboard table?
Thanks
As of now, no – but I shall be doing this at some point. I’m hoping when we finalize what wPDI weights we want, we get that on the FG pages.