Archive for Statcast

A(n Unnecessary) Sprint Speed Adjustment for xBA

Hi! Disclaimer: In this post I use raw Statcast data to calculate expected batting average (xBA). Evidently the raw data do not include the sprint speed adjustment that the Statcast folks said they made. That adjustment only shows up on player pages and in the search. This explains why it seemed to me an adjustment had not been made! The xBA values on player pages are much closer than the raw values and look similar to what I have presented below, and it explains my confusion herein regarding the matter.

So, this post reinvents the wheel a bit. Perhaps it can serve as a mini-primer or -tutorial for you. At the very least it can serve as further validation of the work that the folks at Statcast completed and instituted a couple of years ago. Just keep in mind that the original post below remains intact, completely unedited.

Thanks for reading!

* * *

It has always seemed rather obvious to me that Statcast’s expected batting average (xBA) failed to properly account for a hitter’s speed (“sprint speed”). It seemed like fast hitters routinely outperformed their xBAs while slower hitters underperformed. In looking at a Statcast-era leaderboard (2015-21) of differentials between actual and expected batting averages on ground balls, obvious names rise to the top: Delino DeShields, Dee Strange-Gordon, Eduardo Núñez, Billy Hamilton, Jose Altuve, Jonathan Villar, Norichika Aoki, Mallex Smith, Jean Segura, Adam Eaton, Starling Marte… the list of players who have historically outperformed their xBAs by the widest margins are (were) all elite speedsters. At the other end of the spectrum, post-prime sluggers: Justin Smoak, Chris Davis, Logan Morrison, Jay Bruce, Kendrys Morales, etc. etc.

I thought this exact phenomenon, which is not a revelation by now, had once nudged the Statcast team to apply a sprint speed adjustment to xBA. Apparently, this happened sometime between the 2018 and 2019 seasons. Here’s the original snippet, which I very lightly edited for clarity:
Read the rest of this entry »


A Simple Fix for Barrels in 2021

Here is a disputed fact: MLB changed the ball. League brass, on the record, wanted to make the ball livelier but also raise the height of the seams, which would increase drag. The two changes — more bounce, but also more air resistance — would, more or less, offset each other.

The fact is disputed because some of the game’s most intelligent minds — namely, renowned baseball physicists, the very people most capable of determining if the ball is, indeed, different — doubt the ball has changed. It’s imperative I tell you this because they may be right, which would make me (and MLB, for the umpteenth time), well, wrong. Everything that follows assumes the ball has changed. Maybe this meshes with what you’ve witnessed, maybe it doesn’t. This is simply one stupid man’s interpretation of the data available to us thus far.

Early returns suggest MLB accomplished what it set out to accomplish. We can use weighted on-base average on contact (wOBAcon) to describe hitter production on balls in play, aka batted ball events (BBE). The average hitter is slightly less productive in 2021 than in past years, but not egregiously so, as shown below. Also, it’s only April; as the weather warms, so should be the bats. It’s reasonable to expect 2021’s league-wide wOBAcon value to climb a few ticks before year’s end.

Read the rest of this entry »


Blasts: A Subset of Barrels (Not the Same as Statcast Blasts)

Edit (5/13/24): Hi! Alex here, writing to you from the future. MLBAM just published swing data (it’ll be exciting, I promise you), and one of the marquee metrics for swings on Statcast is called a “Blast.” It has nothing to do with the Blasts herein. As far as I’m concerned, Statcast is the ledger of record, so I will brainstorm new terminology for this so it doesn’t create confusion… although changing the name of my metric might create confusion for the four people or whatever who use it. Anyway, just a PSA for y’all. These are not the same blasts!

I’ve heard (read) a lot of hullabaloo about “not all barrels are equal.” Hullabaloo or not, it’s true; although barrels capture exit velocity (EV) and launch angle (LA) combinations that produce optimal wOBAcon (weighted on-base average on contact) results, the Statcast metric is defined broadly enough to include absolute blasts alongside somewhat-pedestrian hard hits within the same grouping.

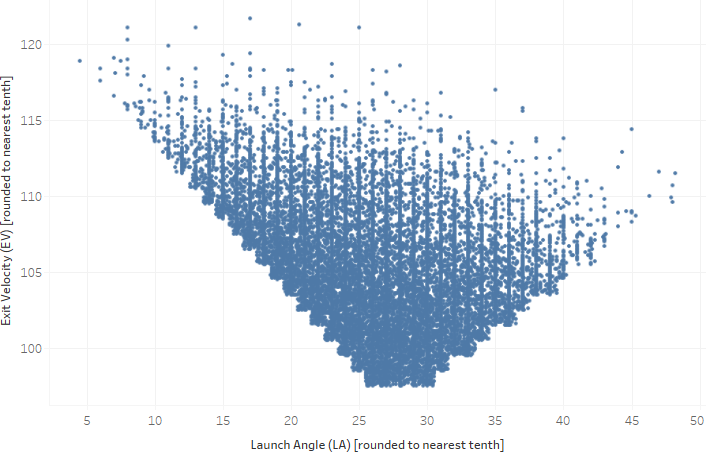
The algorithm used to classify barrels is not publicly available (edit: an anonymous tipster alerted me that it, indeed, is available! I think I reverse-engineered it correctly just by sight…), but one can reverse-engineer it easily enough. Here’s a plot of all barrels since the start of the 2017 season.

Given the scatterplot, the formula is most likely as follows:

if EV < 97.5 mph, then barrel = no
if LA > 25.5° and LA < 30.5°, then barrel = yes
if LA < 25.5° and (25.5 – LA) < (EV – 97.5), then barrel = yes
if LA > 30.5° and ((LA – 30.5) * 2) < ((EV – 97.5) * 3), then barrel = yes
if EV > 97.5 mph but none of these apply, then barrel = no

“Not all barrels are equal” takes on its meaning once you convert the above scatterplot to a heatmap. I set the low end of the color legend artificially high to show the contrast between barrels that are relatively productive versus those that are massively productive:

Read the rest of this entry »


2017-19 Hitter Launch Angles, Revised

Recently I outlined how the installation of Hawk-Eye as Major League Baseball’s tracking and data collection system has shed light on the issue of untracked batted ball events (BBE) in prior years. The issue was first broached by Connor Kurcon, who uses launch angle for his various research and analytical endeavors, including classified run average (CRA), dynamic hard hit rate (DHH%), and TrueHit percentage.

If you’re too lazy to click through, I’ll recap: Because Hawk-Eye tracks more than 99% of BBE, we can use the distribution of launch angles in 2020 to identify the possible launch angles of untracked BBE in previous years. Most likely, untracked BBE converge on the most extreme angles — think -90° and 90°, but with a margin for error such that some BBE as shallow as -40° (for ground balls) or 50° (for pop-ups) might have still gone untracked.

Absent the information available to us now, Tom Tango and the Statcast team devised a method that would impute exit velocity (EV) and launch angle (LA) values that most closely mimic the untracked BBE’s observed outcome by measure of weighted on-base average on contact (wOBAcon). From my observation, Statcast applied roughly half a dozen different launch angle estimates for this purpose, with two in particular used disproportionately: -21° or -20.7° (for ground balls) and 69° (for pop-ups).

Again, absent the data we now have, this was as good an approach as one could reasonably expect. But now we know untracked BBE cluster around the extremes. An imputation of 69° for pop-ups is reasonable, but -21° for grounders might not be extreme enough.

To correct for this issue in the seasons preceding 2020, I adopted an approach I recommended in my original post.

Read the rest of this entry »


A Needed Update on Launch Angle Tightness

As the de facto purveyor of launch angle tightness (or launch angle consistency, both terms that I use interchangeably), it is important I relay to you significant developments related to launch angles in general in 2020. Let the record show I am merely the messenger and Connor Kurcon, whose name graces these pages (or at least my pages) quite often these days, is forever my muse.

In 2020, Major League Baseball instituted its new pitch-tracking (and also ball- and player-tracking) system, Hawk-Eye. You can read about its merits here, among them being its alleged ability to “more comprehensively [track] the full flight of the ball”:

Furthermore, if the ball leaves the field of view of all 12 cameras (as can happen on high pop-ups and fly balls), the system can then reacquire the ball later in its trajectory as gravity pulls it back into the view of one or more cameras.

Hawk-Eye was expected to track more than 99% of all BBE, a significant upgrade from the previous system. Many approached the claim with skepticism. Turns out, the claim may be legit.

Kurcon noticed Hawk-Eye all but ruined the year-to-year consistency of launch angle tightness. Consistency is now inconsistent! Specifically, launch angle consistency values (calculated as the standard deviation of launch angle) have nearly universally grown larger in 2020. For the purposes of launch angle consistency, higher is worse, so it gives the appearance (if you’re looking at players individually and not at the larger picture) that a lot of players cratered a bit during the spring season. And it’s not only because of the shortened season, although the season’s length does contribute partly to the discrepancy:

Read the rest of this entry »


The Near-Immediate Usefulness of Max EV

Maximum exit velocity (max EV) measures a player’s hardest-hit ball, typically measured within a single season and compared against other players. Our Mike Podhorzer has documented its leaders and laggards. Rob Arthur, one of baseball’s best public analysts and whom I admire greatly, wrote intelligently on the importance of max EV as a projection-buster back in 2018. Max Freeze (real name) blends extremely hard hits (114+ mph) with launch angle to look for possible power breakouts ahead of 2020.

It has been established (by Al Melchior and me, in fact) that max EV, while an effective indicator, is not the or even a superior indicator of hitter power.

That’s not to say max EV is useless, by any means. It is altogether a different breed of metric than, say, barrel rate (Barrel%, either per plate appearance [PA] or per batted ball event [BBE]) or average exit velocity (EV), both to which fantasy baseball analysts refer much more often. The latter two, and many others, are rate metrics that need large sample sizes to become reliable — or, in common parlance, to “stabilize.” (More on that here, from our former and beloved Eno Sarris.)

Meanwhile, max EV is not a rate or average but a singular data point. It can happen at any moment in time — including the very first batted ball of a hitter’s season. This makes it an intriguing addition to the ol’ tool belt insofar as it could become “reliable” (not necessarily in the statistical sense) much sooner than would barrels or EV. Potentially, we could use max EV loosely as a leading indicator of where a hitter’s barrel rate, average EV, or even weighted on-base average on contact (wOBAcon) might eventually settle.

So: what are the merits of max EV?

Read the rest of this entry »


Kyle Hendricks and Location-Based Contact Management

This month last year, Connor Kurcon of Six Man Rotation set out to quantify the location aspect of command (or “LRP”). By establishing an accounting system that credited and debited pitchers for changes in ball-strike counts based on the attack zone of and hitter’s disposition (take? swing? ball in play?) for every pitch, he effectively created an alternative to Pitch Value (PVal) that rewards optimal movement through ball-strike counts but with much more pitcher and hitter context.

His findings are as you’d expect: Jacob deGrom and Justin Verlander lead the pack, with Gerrit Cole, Max Scherzer, and Clayton Kershaw not far behind. Other budding aces like Jack Flaherty and Mike Clevinger pepper the list, and some pleasant surprises (such as Brendan McKay, Caleb Smith, and, for those still thirsting, Jake Odorizzi) are scattered throughout as well. Out of the bullpen, newly anointed relief ace Nick Anderson led the pack followed by the underrated Emilio Pagán, breakout reliever Giovanny Gallegos, and others.

Near the end of his post, Kurcon includes a subhead dedicated to Kyle Hendricks where he highlights how Hendricks, widely respected as a command artist, fares lukewarmly by measure of LRP. He then reminds us “LRP doesn’t paint the full picture of command.” True that.

Fortunately, Kurcon has left the door open for me to tie up loose ends with find Gs I’ve been meaning to write up for a couple of months now. Never fear, Hendricks is the command artist we know and love — it’s just that he relies heavily on incurring contact in optimal pitch locations. It is a needle very few pitchers can thread, but Hendricks does it masterfully.

Read the rest of this entry »


Jose Altuve and the Point of No Return(?)

Ominous title, I know, but in all fairness: Jose Altuve sports a paltry .207/.267/.322 (65 wRC+) line. The former consensus 2nd-overall pick who hit .298 with a career-high 31 home runs last year may seem like an unlikely collapse candidate on the surface.

Unfortunately, the cracks began to show last year. For one, Altuve all but stopped running; when he did run, he fared poorly, succeeding in only six of 11 attempts. Moreover, his .298 average, while excellent, was a far cry from his best (.346) and post-breakout five-year peak from 2014 through 2018 (.331). These are the obvious signs of wear.

A lightly critical evaluation might have concluded Altuve would still be a valuable commodity in 2020. Average draft position (ADP) data confirms this suspicion; a post-pandemic-onset ADP of 40.12 (37th overall), per the National Fantasy Baseball Championship (NFBC), ain’t nothing to sneeze at.

Yet my work on launch angle tightness in December, while illuminating and fun to research, shone a spotlight on an interesting and very specific data point: Altuve.

A tight launch angle (small standard deviation) is not always good, and a loose launch angle (large) is not always bad, but by and large the overall trend holds. Perhaps a more effective way to use tightness is to compare it historically for each player. While Altuve never had elite tightness, it was consistent, and he was an elite hitter, and that’s all that mattered. So it alarmed me to see his launch angle loosen up in 2019:

Read the rest of this entry »


Randy Dobnak, Probable Great American Hero

It’s easy to dismiss Randy Dobnak, to turn him into a punchline. When 99.99% of baseball fans were introduced to Dobby last fall, they learned two things:

  1. When he wasn’t pitching, he worked part-time as a ride-share driver to help pay the bills (an altogether separate indictment of MLB and its broad moral shortcomings), and
  2. He has a handlebar mustache.

That’s just enough, but also plenty, to undercut a grown man’s legitimacy. It’s this very illegitimizing, I hypothesize, that has allowed Dobnak to fly under fantasy radars, even as he demonstrates nonzero aptitude on the mound.

Read the rest of this entry »


ERA Estimators, Pt. III: Future

I semi-recently had the honor of presenting at PitcherList’s PitchCon online conference to help raise money for Feeding America. My presentation, “ERA Estimators: Past, Present, and Future,” discussed, well, exactly what it sounds like it discussed. Over three posts, I will recap and elaborate upon points made in my presentation.

In the first two parts of this series (1) (2), I reviewed every manner of estimator, from the classics (FIP, xFIP, SIERA) to new-fangled doohickeys (Baseball Prospectus’ DRA, Statcast’s xERA, Connor Kurcon’s pCRA, Dan Richards‘ FRA). Today, we march forward, envisioning a future that may already be upon us.

ERA Estimators, Part III: Future

Read the rest of this entry »