Blasts: A Subset of Barrels (Not the Same as Statcast Blasts)
Edit (5/13/24): Hi! Alex here, writing to you from the future. MLBAM just published swing data (it’ll be exciting, I promise you), and one of the marquee metrics for swings on Statcast is called a “Blast.” It has nothing to do with the Blasts herein. As far as I’m concerned, Statcast is the ledger of record, so I will brainstorm new terminology for this so it doesn’t create confusion… although changing the name of my metric might create confusion for the four people or whatever who use it. Anyway, just a PSA for y’all. These are not the same blasts!
I’ve heard (read) a lot of hullabaloo about “not all barrels are equal.” Hullabaloo or not, it’s true; although barrels capture exit velocity (EV) and launch angle (LA) combinations that produce optimal wOBAcon (weighted on-base average on contact) results, the Statcast metric is defined broadly enough to include absolute blasts alongside somewhat-pedestrian hard hits within the same grouping.
The algorithm used to classify barrels is not publicly available (edit: an anonymous tipster alerted me that it, indeed, is available! I think I reverse-engineered it correctly just by sight…), but one can reverse-engineer it easily enough. Here’s a plot of all barrels since the start of the 2017 season.
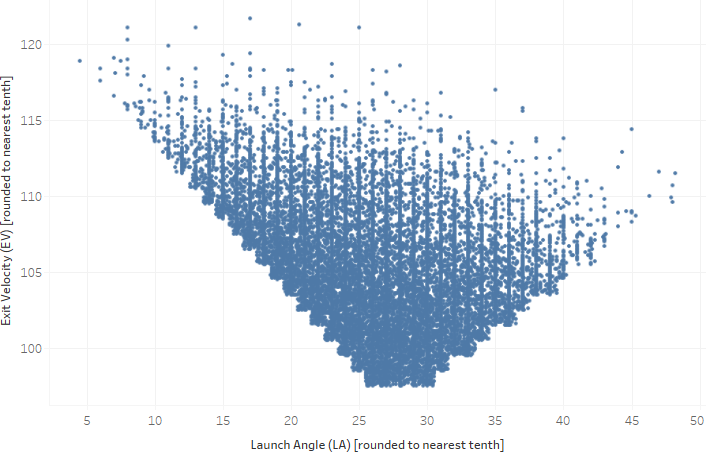
Given the scatterplot, the formula is most likely as follows:
if EV < 97.5 mph, then barrel = no
if LA > 25.5° and LA < 30.5°, then barrel = yes
if LA < 25.5° and (25.5 – LA) < (EV – 97.5), then barrel = yes
if LA > 30.5° and ((LA – 30.5) * 2) < ((EV – 97.5) * 3), then barrel = yes
if EV > 97.5 mph but none of these apply, then barrel = no
“Not all barrels are equal” takes on its meaning once you convert the above scatterplot to a heatmap. I set the low end of the color legend artificially high to show the contrast between barrels that are relatively productive versus those that are massively productive:
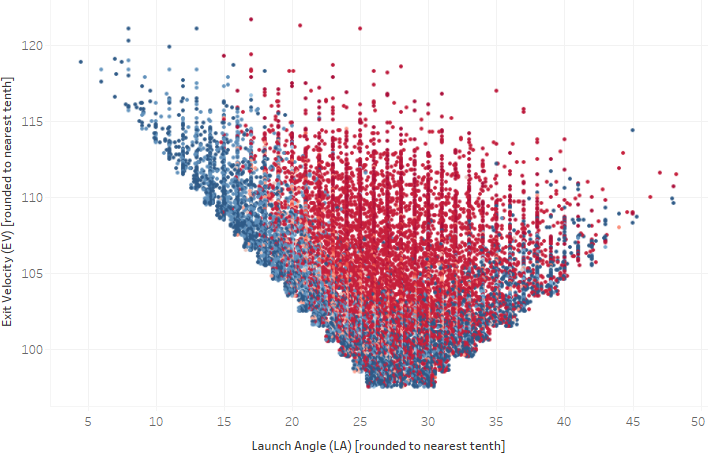
The blue strip bordering a mostly red heatmap captures the contact qualities that range from [decent EV at optimal LA] to [excellent EV at suboptimal LA]. They’re good but not great.
To put words in its creators’ mouths, barrel rate is functional as a metric because it correlates well with many other measures of production, both descriptively and predictively. So, what happens when we shave off the blue fat? What if we pinch the base of the graphic above — instead of a base of launch angles from 25.5° to 30.5°, we condense it to just the midpoint, 28° — and increase the lowest EV threshold from 97.5 mph to 100 mph?
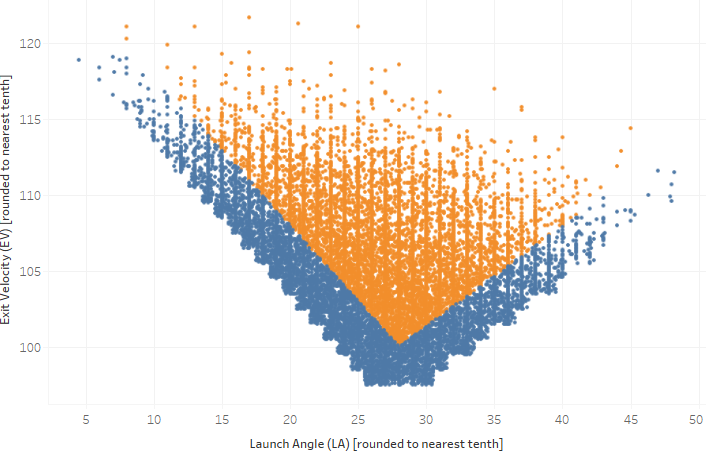
if EV < 100 mph, then blast = no
if LA < 28° and (28 – LA) < (EV – 100), then blast = yes
if LA > 28° and ((LA – 28) * 2) < ((EV – 100) * 3), then blast = yes
if EV > 100 mph but none of these apply, then blast = no
Turns out we nearly perfectly isolate the reddened portion of the heatmap. I call these orange dots “blasts,” for lack of a better word (although “long bombs away” was a serious contender). Because I don’t have a name for the blue area, but because I will need to refer to these other batted balls, I’ll call them “weak barrels.”
Some mildly interesting things happen by establishing blasts:
Statcast barrels are divided nearly perfectly 50-50 between blasts and weak barrels. Since the start of 2017, Statcast barrels have been 46% blasts, 54% weak barrels. It makes for a really nice league-wide benchmark; you know now that the average hitter’s barrels are likely to be half-blasts, half-weak, and any variations in talent deviate from there. I like the evenness of the split, at least.
The productive value of a blast is starkly different from that of a weak barrel. Since the start of 2017, barrels averaged a 1.416 wOBAcon, 58% home run rate, and .804 AVG. Now, blasts average a 1.744 wOBAcon, 82% HR/BBE, and .919 AVG while weak barrels average a 1.140 wOBAcon, 38% HR/BBE, and .707 AVG.
By narrowing Statcast barrels down to blasts, we neither substantively gain nor substantively lose descriptive or predictive power. Blasts predict themselves year-to-year (r2 = 0.66) just as well as barrels do (r2 = 0.66). Their relationships with wOBAcon, both descriptively (blast r2 = 0.59, barrel r2 = 0.62) and predictively (blast r2 = 0.41, barrel r2 = 0.42), are virtually indistinguishable. Ultimately, it’s largely a neutral/lateral move — which I’ll chalk up as a minor overall gain. (Barrels make up only 7% of all batted balls yet describe roughly 60% of the variance in wOBAcon; now just 3% of all batted balls can explain that variance. That’s really wild!)
A pessimist (me, admittedly) might ask, “Well, if we don’t gain anything [if you’re really pessimistic, you’ll nitpick the r2 and think we’ve lost something], what’s the point of another metric?” An optimist (me, but only in this instance) might respond, “Now we have two ways to measure excellent contact quality that, while, fundamentally different, can be used interchangeably. Moreover, it’s possible they’re most illuminating when used not just in place of each other but together.” Because wouldn’t you want to know if the majority of someone’s barrels were blasts (Luke Voit, Teoscar Hernández) or “weak” (Mookie Betts, Mike Moustakas)?
I hope this provides another tool for the ol’ tool belt — one not necessarily superior to anything we already have but does measure something we maybe hadn’t measured quite this way before.
Blast% is now hosted on my Pitch Leaderboard, where you can sort by all of Statcast’s original definitions for BBEs (barrels, solid contact, flares/burners, and poor contact) as well as by blasts. Blasts are viewable for both hitters and pitchers!
If you’re too lazy to click through, you can view a table of barrels leaders here, with barrels split into blasts and weak barrels. Nearly 200 hitters recorded at least 100 BBE last year, presented below; by default, they’re sorted descending by overall barrel rate (Barrel%).
| Name | BBE | EV | Max EV | Blast% | Weak Brl | Barrel% |
|---|---|---|---|---|---|---|
| Fernando Tatis Jr. | 164 | 95.9 | 113.4 | 9.1% | 10.4% | 19.5% |
| Teoscar Hernandez | 128 | 93.3 | 115.9 | 12.5% | 5.5% | 18.0% |
| Juan Soto | 123 | 92.2 | 113.3 | 11.4% | 6.5% | 17.9% |
| Brandon Lowe | 137 | 89.8 | 111.4 | 9.5% | 8.0% | 17.5% |
| Bryce Harper | 150 | 92.2 | 114.7 | 12.0% | 5.3% | 17.3% |
| Brandon Belt | 113 | 90.7 | 109.1 | 7.1% | 9.7% | 16.8% |
| Eloy Jimenez | 158 | 92.4 | 113.6 | 5.7% | 10.8% | 16.5% |
| Nicholas Castellanos | 150 | 91.0 | 108.5 | 6.0% | 10.0% | 16.0% |
| Ronald Acuna | 100 | 92.4 | 114.8 | 13.0% | 3.0% | 16.0% |
| Corey Seager | 177 | 93.2 | 113.1 | 6.2% | 9.6% | 15.8% |
| Marcell Ozuna | 169 | 93.0 | 115.6 | 10.1% | 5.3% | 15.4% |
| Mike Trout | 147 | 93.7 | 112.9 | 10.9% | 4.1% | 15.0% |
| Nelson Cruz | 127 | 91.6 | 114.4 | 11.0% | 3.9% | 15.0% |
| Wil Myers | 142 | 91.0 | 109.2 | 7.7% | 7.0% | 14.8% |
| Rhys Hoskins | 108 | 89.8 | 111.2 | 7.4% | 7.4% | 14.8% |
| Freddie Freeman | 177 | 92.4 | 109.3 | 6.8% | 7.9% | 14.7% |
| Eugenio Suarez | 132 | 89.1 | 111.4 | 8.3% | 6.1% | 14.4% |
| Mitch Moreland | 104 | 88.2 | 110.1 | 4.8% | 9.6% | 14.4% |
| Jose Abreu | 182 | 92.9 | 114.0 | 7.1% | 7.1% | 14.3% |
| Keston Hiura | 134 | 87.4 | 110.2 | 9.0% | 5.2% | 14.2% |
| Joey Gallo | 114 | 90.7 | 113.5 | 7.9% | 6.1% | 14.0% |
| Adam Duvall | 137 | 88.1 | 114.2 | 8.8% | 5.1% | 13.9% |
| J.T. Realmuto | 124 | 90.1 | 112.4 | 6.5% | 7.3% | 13.7% |
| Jesse Winker | 104 | 92.1 | 113.0 | 6.7% | 6.7% | 13.5% |
| Colin Moran | 127 | 91.9 | 112.0 | 7.1% | 6.3% | 13.4% |
| Dominic Smith | 135 | 89.8 | 110.7 | 5.9% | 7.4% | 13.3% |
| Edwin Encarnacion | 106 | 85.4 | 112.9 | 5.7% | 7.5% | 13.2% |
| Luke Voit | 160 | 88.9 | 111.7 | 10.6% | 2.5% | 13.1% |
| Luis Robert | 131 | 87.9 | 115.8 | 9.2% | 3.8% | 13.0% |
| Salvador Perez | 115 | 90.8 | 110.4 | 6.1% | 7.0% | 13.0% |
| Franmil Reyes | 147 | 92.4 | 114.7 | 6.8% | 6.1% | 12.9% |
| Pete Alonso | 148 | 90.2 | 118.4 | 10.8% | 2.0% | 12.8% |
| Matt Olson | 133 | 92.3 | 112.5 | 6.0% | 6.8% | 12.8% |
| George Springer | 153 | 88.7 | 115.0 | 9.8% | 2.6% | 12.4% |
| Max Muncy | 145 | 88.5 | 109.8 | 6.2% | 6.2% | 12.4% |
| Renato Nunez | 130 | 86.4 | 110.3 | 6.2% | 6.2% | 12.3% |
| Rafael Devers | 165 | 93.0 | 116.7 | 6.7% | 5.5% | 12.1% |
| Christian Yelich | 124 | 94.0 | 112.0 | 7.3% | 4.8% | 12.1% |
| Kole Calhoun | 144 | 89.4 | 109.0 | 3.5% | 8.3% | 11.8% |
| Lourdes Gurriel | 162 | 90.8 | 109.5 | 4.3% | 7.4% | 11.7% |
| Kyle Lewis | 137 | 88.3 | 110.9 | 5.8% | 5.8% | 11.7% |
| Ryan Braun | 103 | 89.8 | 110.2 | 4.9% | 6.8% | 11.7% |
| Evan Longoria | 157 | 91.7 | 111.5 | 5.1% | 6.4% | 11.5% |
| Chris Taylor | 131 | 87.7 | 109.6 | 4.6% | 6.9% | 11.5% |
| Dansby Swanson | 167 | 89.0 | 109.3 | 4.2% | 7.2% | 11.4% |
| Randal Grichuk | 169 | 88.9 | 110.9 | 4.1% | 7.1% | 11.2% |
| Kyle Schwarber | 125 | 92.8 | 114.9 | 8.8% | 2.4% | 11.2% |
| Justin Turner | 125 | 90.3 | 107.8 | 3.2% | 8.0% | 11.2% |
| Travis d’Arnaud | 116 | 93.4 | 109.7 | 6.0% | 5.2% | 11.2% |
| Ryan McMahon | 107 | 90.1 | 109.7 | 4.7% | 6.5% | 11.2% |
| Trent Grisham | 153 | 88.3 | 111.9 | 7.2% | 3.9% | 11.1% |
| Manny Machado | 191 | 90.2 | 115.7 | 6.3% | 4.7% | 11.0% |
| J.D. Martinez | 154 | 89.5 | 110.7 | 3.9% | 7.1% | 11.0% |
| Michael Conforto | 145 | 88.4 | 114.4 | 4.1% | 6.9% | 11.0% |
| Mike Yastrzemski | 137 | 88.2 | 105.6 | 6.6% | 4.4% | 10.9% |
| Paul Goldschmidt | 149 | 89.2 | 111.3 | 3.4% | 7.4% | 10.7% |
| Alex Dickerson | 122 | 91.0 | 114.6 | 4.9% | 5.7% | 10.7% |
| Shohei Ohtani | 103 | 89.1 | 111.9 | 5.8% | 4.9% | 10.7% |
| A.J. Pollock | 153 | 89.6 | 110.0 | 4.6% | 5.9% | 10.5% |
| Jake Cronenworth | 143 | 89.8 | 110.1 | 3.5% | 7.0% | 10.5% |
| Willson Contreras | 134 | 89.8 | 114.1 | 5.2% | 5.2% | 10.4% |
| Jeimer Candelario | 136 | 90.2 | 110.8 | 3.7% | 6.6% | 10.3% |
| Ian Happ | 136 | 91.1 | 109.1 | 5.1% | 5.1% | 10.3% |
| Anthony Santander | 126 | 88.4 | 113.2 | 3.2% | 7.1% | 10.3% |
| Alec Bohm | 126 | 90.2 | 109.6 | 3.2% | 7.1% | 10.3% |
| Eric Hosmer | 117 | 90.8 | 112.0 | 6.0% | 4.3% | 10.3% |
| Jose Ramirez | 177 | 88.7 | 114.3 | 4.5% | 5.6% | 10.2% |
| Kyle Seager | 176 | 89.1 | 108.7 | 2.3% | 8.0% | 10.2% |
| Bryan Reynolds | 128 | 87.5 | 110.7 | 4.7% | 5.5% | 10.2% |
| Tim Anderson | 159 | 87.2 | 108.8 | 5.7% | 4.4% | 10.1% |
| Austin Riley | 140 | 91.0 | 111.0 | 6.4% | 3.6% | 10.0% |
| Willy Adames | 111 | 88.8 | 109.1 | 4.5% | 5.4% | 9.9% |
| Miguel Cabrera | 155 | 93.2 | 112.2 | 5.2% | 4.5% | 9.7% |
| Brian Anderson | 135 | 87.5 | 109.5 | 4.4% | 5.2% | 9.6% |
| Mike Moustakas | 105 | 88.8 | 111.7 | 1.9% | 7.6% | 9.5% |
| Cody Bellinger | 171 | 89.3 | 110.6 | 4.1% | 5.3% | 9.4% |
| Ramon Laureano | 128 | 87.7 | 111.3 | 4.7% | 4.7% | 9.4% |
| Brandon Crawford | 127 | 88.7 | 109.8 | 1.6% | 7.9% | 9.4% |
| Yoshitomo Tsutsugo | 108 | 90.2 | 108.9 | 4.6% | 4.6% | 9.3% |
| Trea Turner | 196 | 90.4 | 111.2 | 4.6% | 4.6% | 9.2% |
| Joey Votto | 142 | 87.4 | 113.2 | 4.9% | 4.2% | 9.2% |
| Kyle Tucker | 164 | 91.1 | 110.9 | 3.7% | 5.5% | 9.1% |
| J.D. Davis | 135 | 90.1 | 111.2 | 4.4% | 4.4% | 8.9% |
| Vladimir Guerrero Jr. | 183 | 92.5 | 116.1 | 3.3% | 5.5% | 8.7% |
| Trevor Story | 172 | 90.0 | 109.0 | 4.1% | 4.7% | 8.7% |
| Ty France | 104 | 85.7 | 108.2 | 3.8% | 4.8% | 8.7% |
| Xander Bogaerts | 163 | 89.0 | 112.5 | 5.5% | 3.1% | 8.6% |
| Josh Bell | 140 | 91.7 | 114.2 | 4.3% | 4.3% | 8.6% |
| Rio Ruiz | 139 | 88.3 | 109.0 | 0.7% | 7.9% | 8.6% |
| Pat Valaika | 105 | 88.6 | 108.2 | 3.8% | 4.8% | 8.6% |
| Justin Upton | 105 | 91.7 | 111.5 | 3.8% | 4.8% | 8.6% |
| Andrew McCutchen | 170 | 89.8 | 109.9 | 3.5% | 4.7% | 8.2% |
| Hunter Dozier | 110 | 86.4 | 110.3 | 3.6% | 4.5% | 8.2% |
| Javier Baez | 149 | 89.4 | 116.0 | 4.7% | 3.4% | 8.1% |
| Garrett Hampson | 111 | 86.3 | 105.6 | 2.7% | 5.4% | 8.1% |
| Travis Shaw | 114 | 90.9 | 112.8 | 5.3% | 2.6% | 7.9% |
| Anthony Rizzo | 167 | 87.8 | 114.5 | 3.0% | 4.8% | 7.8% |
| Austin Nola | 129 | 89.7 | 110.1 | 2.3% | 5.4% | 7.8% |
| Mookie Betts | 182 | 90.7 | 108.5 | 0.5% | 7.1% | 7.7% |
| Brandon Nimmo | 143 | 87.2 | 106.9 | 4.2% | 3.5% | 7.7% |
| Mark Canha | 142 | 89.7 | 108.9 | 2.8% | 4.9% | 7.7% |
| Jackie Bradley Jr. | 144 | 88.3 | 112.4 | 2.8% | 4.9% | 7.6% |
| Yasmani Grandal | 105 | 90.3 | 110.5 | 3.8% | 3.8% | 7.6% |
| Paul DeJong | 106 | 89.2 | 105.5 | 1.9% | 5.7% | 7.5% |
| Robinson Cano | 148 | 90.4 | 113.5 | 4.1% | 3.4% | 7.4% |
| Pedro Severino | 121 | 87.6 | 111.2 | 3.3% | 4.1% | 7.4% |
| Adalberto Mondesi | 151 | 90.6 | 111.0 | 3.3% | 4.0% | 7.3% |
| Enrique Hernandez | 109 | 88.5 | 110.2 | 3.7% | 3.7% | 7.3% |
| Jesus Aguilar | 152 | 89.3 | 109.9 | 3.9% | 3.3% | 7.2% |
| Wilson Ramos | 112 | 89.0 | 110.1 | 4.5% | 2.7% | 7.1% |
| Aaron Hicks | 131 | 87.9 | 109.5 | 4.6% | 2.3% | 6.9% |
| Giovanny Urshela | 130 | 91.4 | 111.0 | 1.5% | 5.4% | 6.9% |
| Carlos Santana | 164 | 87.9 | 111.5 | 3.7% | 3.0% | 6.7% |
| Erik Gonzalez | 134 | 88.5 | 111.4 | 2.2% | 4.5% | 6.7% |
| Asdrubal Cabrera | 151 | 89.7 | 107.0 | 2.0% | 4.6% | 6.6% |
| Stephen Piscotty | 108 | 88.1 | 111.1 | 3.7% | 2.8% | 6.5% |
| Starling Marte | 188 | 87.1 | 110.6 | 3.7% | 2.7% | 6.4% |
| Christian Walker | 171 | 90.4 | 110.4 | 3.5% | 2.9% | 6.4% |
| Alex Verdugo | 157 | 87.0 | 109.5 | 1.3% | 5.1% | 6.4% |
| Anthony Rendon | 158 | 90.1 | 109.1 | 2.5% | 3.8% | 6.3% |
| Eddie Rosario | 178 | 87.5 | 105.0 | 2.2% | 3.9% | 6.2% |
| Yoan Moncada | 130 | 87.8 | 109.9 | 3.8% | 2.3% | 6.2% |
| Wilmer Flores | 163 | 87.9 | 107.8 | 3.1% | 3.1% | 6.1% |
| Jean Segura | 148 | 87.7 | 109.4 | 2.7% | 3.4% | 6.1% |
| Carlos Correa | 153 | 88.6 | 109.0 | 2.6% | 3.3% | 5.9% |
| Maikel Franco | 189 | 86.7 | 112.5 | 2.1% | 3.7% | 5.8% |
| Corey Dickerson | 159 | 85.7 | 108.8 | 2.5% | 3.1% | 5.7% |
| Francisco Lindor | 197 | 89.9 | 111.4 | 2.5% | 3.0% | 5.6% |
| Orlando Arcia | 142 | 89.0 | 108.7 | 1.4% | 4.2% | 5.6% |
| Jonathan Schoop | 125 | 87.2 | 114.4 | 4.0% | 1.6% | 5.6% |
| Eduardo Escobar | 164 | 88.6 | 106.7 | 1.8% | 3.7% | 5.5% |
| Robbie Grossman | 128 | 89.0 | 108.1 | 0.8% | 4.7% | 5.5% |
| Albert Pujols | 128 | 88.6 | 108.8 | 1.6% | 3.9% | 5.5% |
| Kevin Pillar | 167 | 87.0 | 108.0 | 1.2% | 4.2% | 5.4% |
| Nolan Arenado | 166 | 87.8 | 108.9 | 3.0% | 2.4% | 5.4% |
| Nick Ahmed | 153 | 87.7 | 107.7 | 1.3% | 3.9% | 5.2% |
| Todd Frazier | 115 | 87.8 | 108.1 | 1.7% | 3.5% | 5.2% |
| Whit Merrifield | 216 | 86.1 | 105.8 | 0.5% | 4.6% | 5.1% |
| Marwin Gonzalez | 138 | 89.2 | 106.0 | 3.6% | 1.4% | 5.1% |
| Max Kepler | 136 | 88.5 | 110.3 | 2.9% | 2.2% | 5.1% |
| Marcus Semien | 161 | 86.2 | 108.0 | 1.9% | 3.1% | 5.0% |
| David Peralta | 160 | 89.2 | 113.8 | 1.9% | 3.1% | 5.0% |
| Cavan Biggio | 159 | 87.4 | 103.6 | 0.6% | 4.4% | 5.0% |
| Charlie Blackmon | 182 | 86.9 | 109.7 | 1.6% | 3.3% | 4.9% |
| Michael Brantley | 142 | 88.5 | 105.3 | 0.0% | 4.9% | 4.9% |
| Daniel Murphy | 103 | 85.1 | 109.6 | 1.0% | 3.9% | 4.9% |
| Tommy La Stella | 187 | 88.0 | 108.8 | 0.5% | 4.3% | 4.8% |
| Josh Reddick | 147 | 85.9 | 106.7 | 1.4% | 3.4% | 4.8% |
| Luis Garcia | 105 | 83.5 | 111.1 | 1.9% | 2.9% | 4.8% |
| Nick Solak | 171 | 89.9 | 111.7 | 1.8% | 2.9% | 4.7% |
| Adam Eaton | 128 | 87.8 | 109.8 | 3.1% | 1.6% | 4.7% |
| Jose Altuve | 153 | 86.7 | 106.9 | 1.3% | 3.3% | 4.6% |
| Donovan Solano | 152 | 88.5 | 108.1 | 0.7% | 3.9% | 4.6% |
| Christian Vazquez | 130 | 88.4 | 108.8 | 2.3% | 2.3% | 4.6% |
| Jason Heyward | 112 | 87.6 | 108.1 | 3.6% | 0.9% | 4.5% |
| Freddy Galvis | 111 | 87.0 | 107.7 | 0.9% | 3.6% | 4.5% |
| Didi Gregorius | 190 | 83.8 | 104.7 | 1.1% | 3.2% | 4.2% |
| Manuel Margot | 121 | 89.0 | 108.2 | 0.8% | 3.3% | 4.1% |
| Cesar Hernandez | 177 | 89.1 | 108.2 | 2.3% | 1.7% | 4.0% |
| Adam Frazier | 175 | 85.5 | 107.5 | 1.7% | 2.3% | 4.0% |
| Mauricio Dubon | 124 | 86.2 | 106.3 | 1.6% | 2.4% | 4.0% |
| Alex Bregman | 128 | 88.9 | 105.6 | 0.8% | 3.1% | 3.9% |
| Luis Arraez | 102 | 87.5 | 103.7 | 0.0% | 3.9% | 3.9% |
| Tommy Edman | 158 | 86.7 | 109.0 | 0.6% | 3.2% | 3.8% |
| Victor Reyes | 157 | 90.0 | 108.6 | 2.5% | 1.3% | 3.8% |
| Avisail Garcia | 132 | 87.4 | 113.3 | 3.0% | 0.8% | 3.8% |
| Yulieski Gurriel | 189 | 89.3 | 107.1 | 1.1% | 2.6% | 3.7% |
| Ketel Marte | 163 | 89.0 | 115.9 | 0.0% | 3.7% | 3.7% |
| Joey Wendle | 134 | 86.7 | 104.9 | 1.5% | 2.2% | 3.7% |
| Amed Rosario | 109 | 86.5 | 107.8 | 1.8% | 1.8% | 3.7% |
| Gleyber Torres | 108 | 88.6 | 110.2 | 2.8% | 0.9% | 3.7% |
| Jurickson Profar | 155 | 87.2 | 107.7 | 1.9% | 1.3% | 3.2% |
| Jose Iglesias | 126 | 86.2 | 110.2 | 1.6% | 1.6% | 3.2% |
| Alex Gordon | 126 | 82.8 | 112.3 | 2.4% | 0.8% | 3.2% |
| DJ LeMahieu | 175 | 91.3 | 109.5 | 1.1% | 1.7% | 2.9% |
| Jorge Polanco | 177 | 86.6 | 109.2 | 0.6% | 2.3% | 2.8% |
| Tim Lopes | 109 | 87.2 | 109.1 | 0.0% | 2.8% | 2.8% |
| Cedric Mullins | 107 | 88.6 | 110.2 | 2.8% | 0.0% | 2.8% |
| Jeff McNeil | 162 | 86.6 | 106.2 | 1.2% | 1.2% | 2.5% |
| Yadier Molina | 126 | 84.7 | 104.2 | 0.8% | 1.6% | 2.4% |
| Isiah Kiner-Falefa | 180 | 87.2 | 106.2 | 0.0% | 2.2% | 2.2% |
| Raimel Tapia | 150 | 85.3 | 107.2 | 1.3% | 0.7% | 2.0% |
| Nick Markakis | 107 | 89.0 | 106.1 | 0.0% | 1.9% | 1.9% |
| J.P. Crawford | 167 | 85.8 | 110.1 | 1.2% | 0.6% | 1.8% |
| Victor Robles | 117 | 81.9 | 109.2 | 0.9% | 0.9% | 1.7% |
| Jonathan Villar | 134 | 86.7 | 111.1 | 1.5% | 0.0% | 1.5% |
| Nicky Lopez | 131 | 84.9 | 104.6 | 0.0% | 1.5% | 1.5% |
| Hanser Alberto | 188 | 82.7 | 103.8 | 0.0% | 1.1% | 1.1% |
| Miguel Rojas | 107 | 87.3 | 107.0 | 0.9% | 0.0% | 0.9% |
| Shogo Akiyama | 121 | 85.1 | 104.0 | 0.0% | 0.8% | 0.8% |
| Kevin Newman | 138 | 85.5 | 104.7 | 0.0% | 0.7% | 0.7% |
| Kolten Wong | 154 | 86.5 | 103.7 | 0.0% | 0.6% | 0.6% |
| David Fletcher | 185 | 84.7 | 107.0 | 0.0% | 0.5% | 0.5% |
| Andrelton Simmons | 102 | 86.8 | 105.8 | 0.0% | 0.0% | 0.0% |
Click headers to sort!
Justin Choi recently wrote about Nick Castellanos‘ barrels issue here; the distinction between blasts and weak barrels further supports that narrative.
Thanks to Tango and the Statcast team for doing all the hard work and developing the “barrel” taxonomy in the first place. Apologies to anyone who I may have inadvertently mimicked or copied in my work here; surely someone has had this very train of thought before.
Tatis Jr rocks
How many of these weak barrels matter and when?
thanks for making me feel good about cutting teoscar about 1 week in in all my leagues…..
Cool thanks….could we get a league average BLAST%
It’s roughly 3%! Maybe just a hair more. Like 3.2ish.
Thx
How did Sano come out? I don’t believe he made the list due to too few BBEs.
14.6% blasts + 8.3% weak barrels = 22.9% barrels
Seems like this would me most useful when looking at the ratio between blasts and weak barrels to determine how repeatable someones power is. I know some people find sleepers by looking at OPS on barrelled balls and seeing who the laggards are but this could help draw some detail into how much good or bad luck the hitter experienced
This is awesome work, thanks Alex!
Really interesting stuff here, thanks for the article. Do you have any intentions to apply this to past years to look at the year to year stickiness of Blasts?
Blasts are extremely sticky—effectively just as sticky as barrels year to year.
Awesome to know. Thanks for the response and keep up with this kind of stuff. There’s no silver bullet to understanding all the statcast data but every refinement, like Blasts, is another tool that helps me and others stay ahead of our fantasy competition!
Let’s run with your earlier descriptor and call weak barrels “Barrel Fat”
Austin Meadows?
Looks like this Acuña guy is no good when it comes to hitting weak barrels.
The weak barrels should be called flarrels combined from flare and barrel:).