ERA Estimators, Pt. III: Future
I semi-recently had the honor of presenting at PitcherList’s PitchCon online conference to help raise money for Feeding America. My presentation, “ERA Estimators: Past, Present, and Future,” discussed, well, exactly what it sounds like it discussed. Over three posts, I will recap and elaborate upon points made in my presentation.
In the first two parts of this series (1) (2), I reviewed every manner of estimator, from the classics (FIP, xFIP, SIERA) to new-fangled doohickeys (Baseball Prospectus’ DRA, Statcast’s xERA, Connor Kurcon’s pCRA, Dan Richards‘ FRA). Today, we march forward, envisioning a future that may already be upon us.
ERA Estimators, Part III: Future
We have a lot of clues about what would be useful to us in terms of devising an estimator superior to the existing field of estimators. We know, thanks to Statcast, that pitch types perform wildly differently (I summarized those differences crudely here, but the preceding link to my pitch leaderboard is superior):
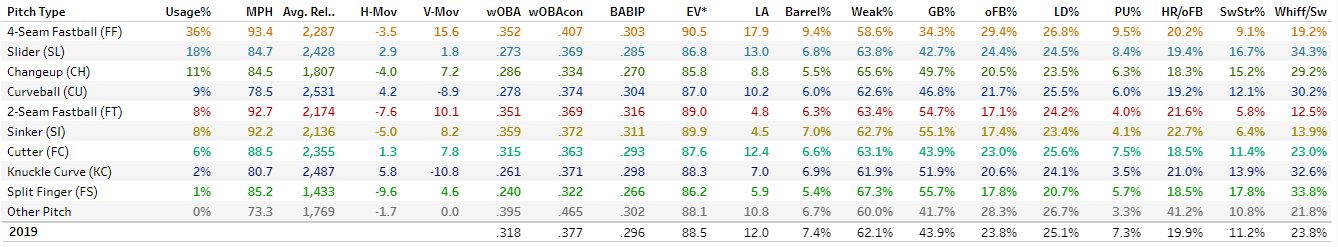
(Click for full image. Note: the table pictured above differs slightly from the one in the link to my leaderboard. I am working on some updates in private! Most notably, average exit velocity here excludes bunts. Also, “Avg. Rel…” is average spin rate.)
If the average fastball allows a significantly higher wOBAcon than the average off-speed or breaking pitch and most likely allows fewer whiffs, it stands to reason that, among two identical pitchers, the one who throws fewer fastballs will boast a greater likelihood of success. In a vacuum, nearly every pitcher could exist as-is (that is, not tinker with any of their pitches) and improve simply by optimizing their arsenal (aka changing the frequency with which they throw certain pitches, especially in certain counts). Stop throwing a bad fastball if you’ve got a good curveball, you know?
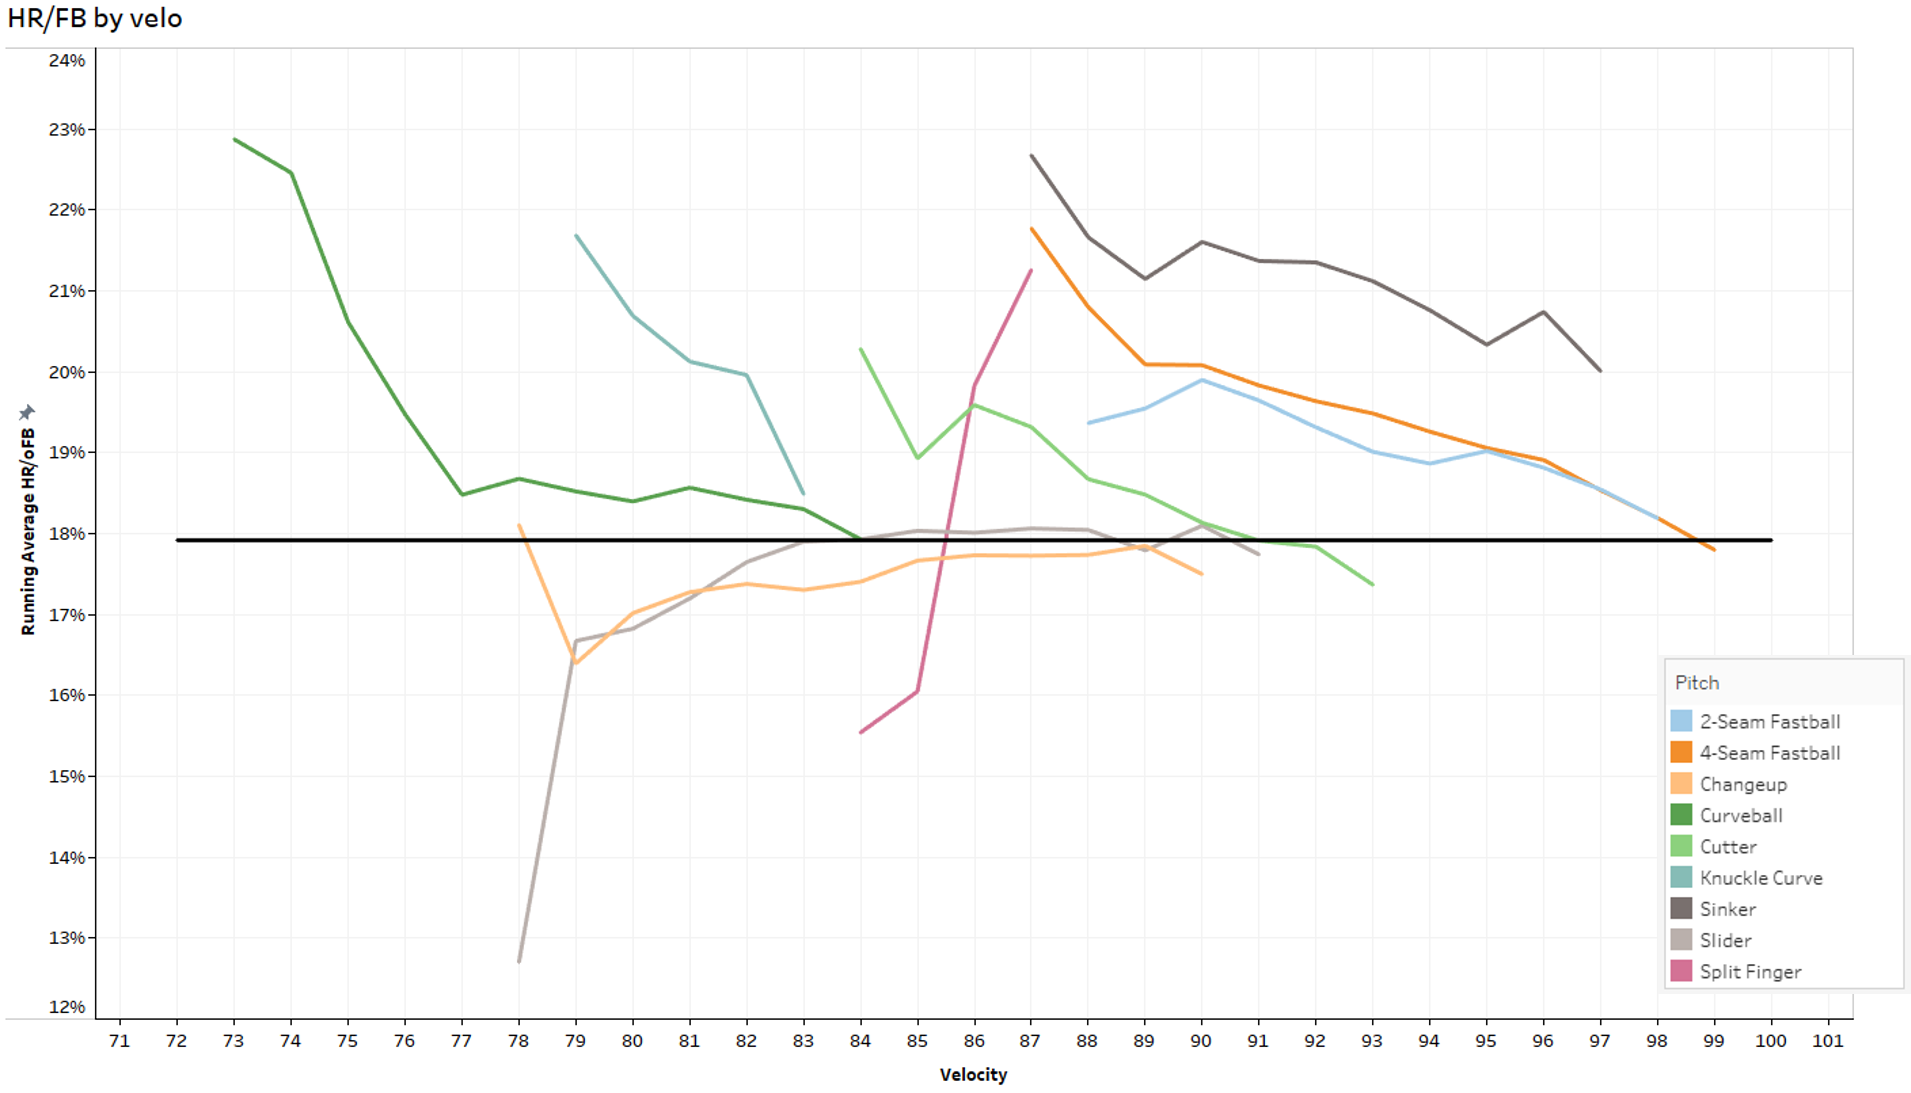
Moreover, distinctions within pitch types bear fundamentally different degrees of effectiveness. Take, for example, the ratio of home runs to fly balls (HR/FB) by pitch velocity within each pitch type:
(Click for full image.)
The lines are not smooth, but you can see how fastballs and offspeed pitches, on average, allow fewer home runs per fly ball per additional tick of velocity. Breaking pitches have interesting, perhaps noisy, relationships with velocity, but it’s perhaps fastballs’ relationship with velocity that matters most.
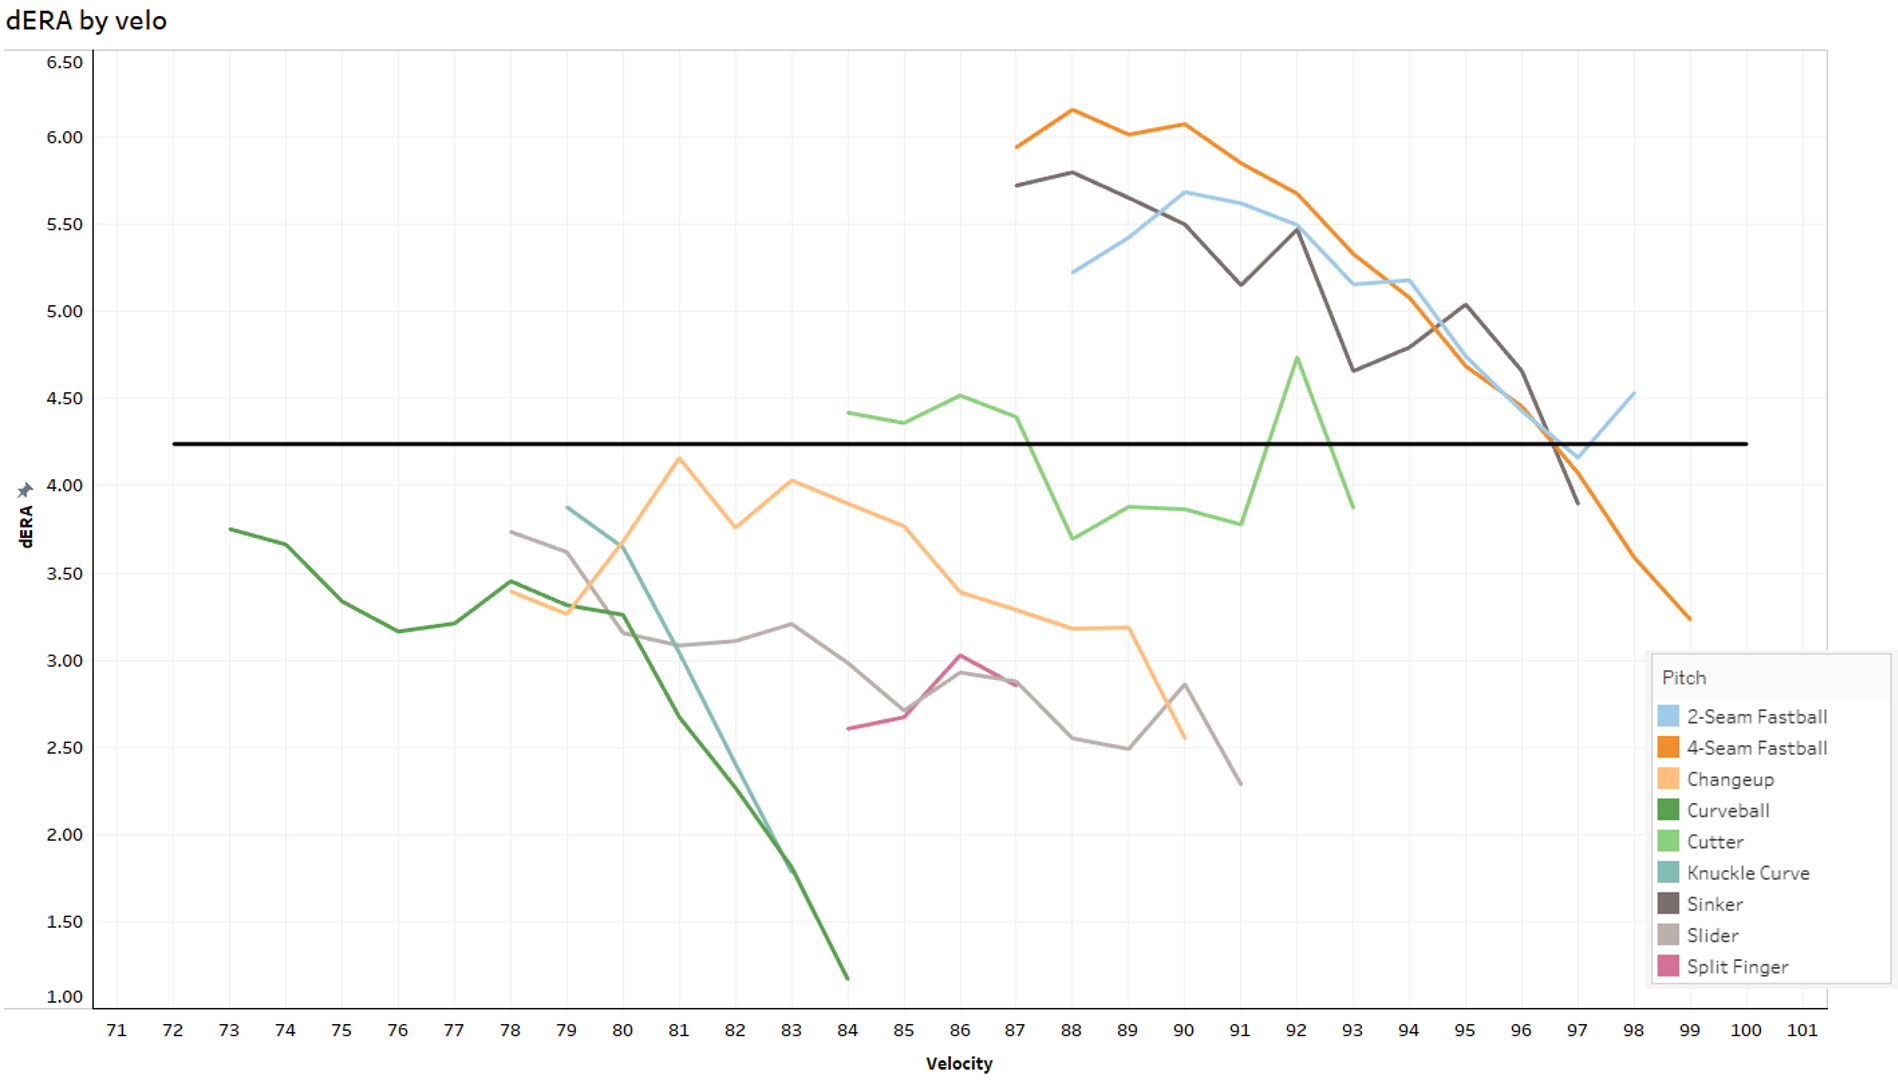
I don’t recommend using estimators for individual pitches, but my deserved ERA (dERA) makes it easy to see how whiffs and batted ball outcomes improve significantly with velocity:
(Click for full image.)
(And, as alluded to earlier, fastballs perform consistently worse than their non-fastball counterparts.)
To wit, these physical differences in pitches lay the groundwork for understanding not just that Pitcher A might generate better outcomes than Pitcher B, but how Pitcher A generates better outcomes than Pitcher B.
The Meat and Potatoes of It All
The issue of moving forward in the sphere of ERA estimators, for me, goes beyond simply looking at plate appearance outcomes, on which we remain too focused. You could’ve guessed this is where I was going with this. We know plate appearance outcomes reflect pitcher skill to an extent. But how do you measure pitcher skill? What is it, exactly, that makes a pitcher skilled?
In other words, if plate appearance outcomes reflect a pitcher’s skill, what about that pitcher cultivates those specific outcomes?
If the one thing a pitcher can control is the 15 or 100 pitches he throws each appearance, then it stands to reason the best indicator of his skill are the very pitches he throws. To look at them from a physical standpoint — their velocity, their movement, their location — we can better understand what elements of a pitch make it successful, regardless of how it’s classified by Statcast.
I had previously taken a rudimentary stab at this in the summer of 2018. I used pitch velocity and movement to model whiff rates and ground balls. I wanted the equation to be publicly usable, so I devised a regression that would elicit coefficients (weights) that anyone could use to plug in the physical specs of a pitch and estimate its average ground ball rate (GB%) or swinging strike rate (SwStr%).
(This is a gory-mathematical-details-ahead warning, so if you get bogged down in this kind of stuff, feel free to skip the bullet points.)
I faced some problems at the time, some known to me, some unknown:
- Known: I used PITCHf/x data rather than Statcast data. (I was daunted by Statcast data at the time!) And the only data I had access to was already rolled up into summaries (think a traditional FanGraphs leaderboard) rather than broken down to each individual pitch thrown (like Statcast, which tracks more than 700,000 pitches every year).Data formatted this way has its advantages and disadvantages. Outcomes presented as averages can be helpful, especially when the dependent variable (say, swinging strike rate) is a simple binary (was it a swinging strike: yes or no?). But, in terms of explanatory variables, such as movement, velocity, and location, using average values can be problematic. You lose the granularity of understanding the behavior of specific pitch compositions.
- Known: Despite this limitation, I knew a pitch-level model that used wOBA as the dependent variable using all the usual suspects as explanatory variables would perform very poorly. Each outcome has a unique run value (a single is roughly 0.7; a home run is roughly 2.0), but there are only a small number of distinct outcomes, and they have widely varying discrete values as opposed to a continuous spectrum of values. Averages resolve this issue.
- Unknown: Pitch location is stupid important. Like, so important that I will devote an entire post to it soon.
Despite the limitations, some self-imposed, I created distinct models for both whiffs and grounders that, using just velocity and movement, explained more than 50% of the variance in each metric. That’s not bad! That’s pretty decent, y’all.
Recent work from Ethan Moore (now of Prospects365), though, has helped see my original vision a little more clearly. He used what’s called a K-Nearest Neighbor model, which is mathematically dense but nominally intuitive: given these certain aspects of a pitch, what other pitches are most similar to it — its nearest neighbors? And, ultimately, what were the outcomes of those most-similar pitches?
Moore leveraged the model to calculate the average outcome of all the most-similar pitches to the subject pitch (for example, the 100 most-similar pitches to a random four-seamer from Jacob deGrom). He then rolled up the average outcomes of every pitch for every pitcher and converted them to a FIP-like framework to estimate WAR. Extremely clever! It sort of circumvents the issue of discerning the importance of any particular variable and, instead, relies broadly on pitch similarity (based on certain criteria) to guide the way.
It also resolved all my issues in one fell swoop:
- It used Statcast data,
- it incorporated location, and
- it accommodated average outcomes without losing the specificity of the physical characteristics of every pitch thrown.
The logical extension of Moore’s work — for my own selfish purposes — is, rather than converting the average outcome of each pitch into a WAR framework, converting it into an ERA framework instead. As I demonstrated in Part 2 of this series, converting wOBA to ERA is quick and painless.
Concluding Remarks
Moore’s investigation shows that we can discern how we should expect, say deGrom’s fastball to perform moving forward by relying on past results. However, those past results need not be limited to deGrom’s fastball alone, instead expanding our sample to all pitches, looking for those most similar to deGrom’s and seeing how they performed on average.
(For the best and worst pitchers, perhaps the most-similar pitches are their own. It’s plausible that Moore’s model fails to find consistent comps for deGrom’s or Gerrit Cole‘s or Justin Verlander‘s or Max Scherzer’s fastballs. It’s not uncommon for a model to perform less successfully with regard to outliers/extremes. However, despite this possible limitation, at least the model still recognizes those aces as aces, so I feel confident in it.)
It’s an excellent step toward my white whale, which is an ERA estimator based on pitch quality, and where pitch quality is measured by more than just its outcomes in the absence of its physical composition. That is, my white whale estimates outcomes based on physical composition, and attributes values to those estimated outcomes, rather than attributing value to observed (actual) outcomes. If one of the core pursuits of fantasy baseball is anticipating how a player will perform moving forward, why wouldn’t we want to try to achieve that at the most tangible and fundamental building-block level of pitcher performance?
Ultimately, I hope you found even one sentence of these last three posts interesting, illuminating, insightful, informative, whichever synonym beginning with the letter “i” that suits you. I hope it spoke to fantasy baseball competitors of all skill sets and possibly expanded the horizons of even the most-skilled and -seasoned of veterans. Maybe one day we’ll have a pitch-based estimator that is more predictive than any outcome-based estimator. That’s the dream, baby.
Until then. Next time you hear from me, we’ll be talking about launch angle again, but for pitchers, not hitters. Thanks for reading.
Can I get your quick thoughts on pCRA versus FRA?
I think you might be smarter than me.
Everyone is smarter than you.