Archive for Statcast

Can Worm Killers Eventually Lift the Ball?

A while back on Twitter, Razzball’s Rudy Gamble made the following comment in a discussion of Vladimir Guerrero Jr. and his high groundball rate.

Vlad’s career groundball rate in just 900 PA is 50.5% which would rank as the 5th highest of 75 hitters. Over the same sample, his 118.9 mph Max Exit Velocity is the highest. It’s like he’s been blasting holes in the infield. So coming back to Rudy’s comment, will a power hitter, like Vlad, eventually get the ball in the air. While the answer is some, it’s likely not enough to make a difference.
Read the rest of this entry »


A Simple Fix for Barrels in 2021

Here is a disputed fact: MLB changed the ball. League brass, on the record, wanted to make the ball livelier but also raise the height of the seams, which would increase drag. The two changes — more bounce, but also more air resistance — would, more or less, offset each other.

The fact is disputed because some of the game’s most intelligent minds — namely, renowned baseball physicists, the very people most capable of determining if the ball is, indeed, different — doubt the ball has changed. It’s imperative I tell you this because they may be right, which would make me (and MLB, for the umpteenth time), well, wrong. Everything that follows assumes the ball has changed. Maybe this meshes with what you’ve witnessed, maybe it doesn’t. This is simply one stupid man’s interpretation of the data available to us thus far.

Early returns suggest MLB accomplished what it set out to accomplish. We can use weighted on-base average on contact (wOBAcon) to describe hitter production on balls in play, aka batted ball events (BBE). The average hitter is slightly less productive in 2021 than in past years, but not egregiously so, as shown below. Also, it’s only April; as the weather warms, so should be the bats. It’s reasonable to expect 2021’s league-wide wOBAcon value to climb a few ticks before year’s end.

Read the rest of this entry »


Statcast Gains and Increasing Value

Now is that time in the season where you’re probably starting to get a little antsy. Why hasn’t Player A hit any home runs yet? When will Player B steal a base? Do I cut this player? Do I add that player? You may fall into the trap of cutting players on a whim because of a 3-for-31 performance thus far, but then regret that cut when he goes on a home run hitting bonanza in a few weeks. So, what indicators can you look for when trying to decide whether to buy or sell, cut or claim? 

Read the rest of this entry »


MLB DFS Pitching Analysis: April 6, 2021

Our MLB DFS lineups don’t start and end with pitching. My first five-figure tournament score came on a night where Collin McHugh scored negative points, I think–or maybe it was, like, six points. Extremely flukey, as I made the big money because Justin Turner hit three HRs for me at nearly no ownership. I’m not saying to put pitcher every night or even every now and then. I’m just stressing that each and every slate does not rest upon our pitching.

The pitcher position is so vital because it’s the slot where we can get the most accurate projection in an extremely volatile wing of DFS.

Our pitching isn’t just a source of fantasy points. The price tags on pitchers make it so they shape they dictate the freedoms and restrictions of building our lineups. Before reading this article, it’s highly suggested that you read my article, “DFS Pitching Primer,”so the concepts discussed here make more sense.

That we’re not selecting the best players to win tournaments. We’re constructing the lineups which carry the most leverage without sacrificing many projected fantasy points.
Read the rest of this entry »


Spring Training Groundball Changers

Blah, blah, some intro stuff on some guy that goes on too long. And here are the hitters who might be changing their launch angle (i.e. groundball rate).

Using Spring Training Ground Outs divided by Airball Outs (GO/AO), some possible swing plane changes might already be detectable. To find possible change, I found the hitters who had a combined 50% GB% and at least 300 PA from 2019 to 2020. Then, I removed those with fewer than 30 spring plate appearances and got the GO/AO values for the rest. Next, I converted the GO/AO to groundball rate (GB%) using the formula in this article. Finally, I just calculated the greatest differences and here are the results.

Read the rest of this entry »


New Exit Velocity Highs

Maximum Exit velocity is starting to get noticed more and more as the best single stat to measure a hitter’s raw power. While quite a bit has been written on it, the subject’s money quote is from Rob Arthur:

For every mile per hour above 108, a hitter is projected to gain about 6 points of OPS relative to their predicted number.

With several new Florida Spring Training ballparks getting publicly available Trackman, I sifted through all the games and found any players who set a new over 108 mph Exit Velocity high compared to the previous two seasons. Twenty-two players have seen improvement. Most of them had a limited number of plate appearances, so setting a new high should be expected. There are a few regulars who could see an improvement in 2021.

Alejandro Kirk
Combined PA: 25
2019 Max EV: NA
2020 Max EV: 107.4
Combined Max: 107.4
2021 Max EV: 110.3

Kirk has displayed power in the past and this jump is probably setting a baseline versus an actual power increase.

Read the rest of this entry »


Where 2020 Velocity Decliners Stand in Spring Training

During the offseason, I kept track of pitchers who saw a 2020 velocity drop or were coming back from injuries. I’ve decided to check in on them. I know some of the sources can be a little wonky (e.g. stadium guns), but it’s better than nothing. Also, the pitchers could add velocity as they continue through Spring Training even though it rarely happens. That said, any information is better than going in blind.

For the velocity readings, I used FanGraphs for the 2019 and 2020 readings and the 2021 information from my personally collected list.

Madison Bumgarner
2019: 91.4
2020: 88.4
2021: 90-91

Bumgarner seems to be caring after he blew off his pre-season throwing last year. Projections don’t like him projecting an ERA near 5.00 but if the velocity stands, he should at least be around 4.00 ERA pitcher.

Read the rest of this entry »


Regressing StatCast: A Fable

This fable is inspired by Eric Hosmer and Dansby Swanson. In my last article, I noticed both improved in some of their StatCast metrics. So, I wondered how much should the values regress? After wasting more time than I’ll admit roaming for the answers, I remembered I already discovered the answers when creating my StatCast projections. Magically the season weightings work out to simply splitting the difference between 2019 and 2020 value. Normally, the most recent season would carry more weight, but with 2020’s limited sample, the two StatCast metrics (launch angle and max exit velocity) carry equal weight. Now, I can continue drudging through life. The end.


Blasts: A Subset of Barrels (Not the Same as Statcast Blasts)

Edit (5/13/24): Hi! Alex here, writing to you from the future. MLBAM just published swing data (it’ll be exciting, I promise you), and one of the marquee metrics for swings on Statcast is called a “Blast.” It has nothing to do with the Blasts herein. As far as I’m concerned, Statcast is the ledger of record, so I will brainstorm new terminology for this so it doesn’t create confusion… although changing the name of my metric might create confusion for the four people or whatever who use it. Anyway, just a PSA for y’all. These are not the same blasts!

I’ve heard (read) a lot of hullabaloo about “not all barrels are equal.” Hullabaloo or not, it’s true; although barrels capture exit velocity (EV) and launch angle (LA) combinations that produce optimal wOBAcon (weighted on-base average on contact) results, the Statcast metric is defined broadly enough to include absolute blasts alongside somewhat-pedestrian hard hits within the same grouping.

The algorithm used to classify barrels is not publicly available (edit: an anonymous tipster alerted me that it, indeed, is available! I think I reverse-engineered it correctly just by sight…), but one can reverse-engineer it easily enough. Here’s a plot of all barrels since the start of the 2017 season.
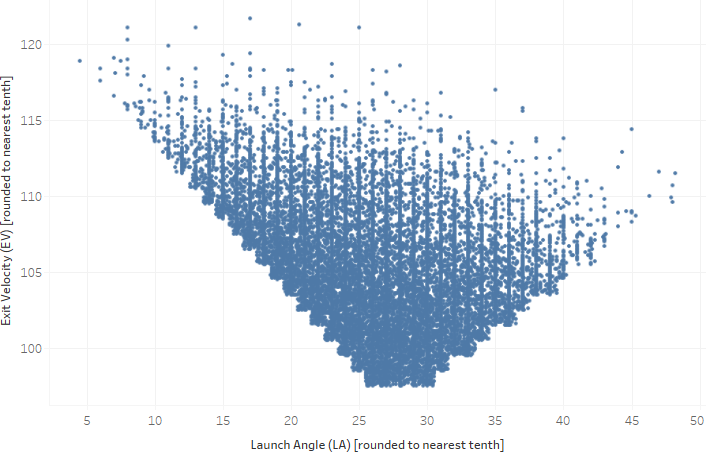
Given the scatterplot, the formula is most likely as follows:

if EV < 97.5 mph, then barrel = no
if LA > 25.5° and LA < 30.5°, then barrel = yes
if LA < 25.5° and (25.5 – LA) < (EV – 97.5), then barrel = yes
if LA > 30.5° and ((LA – 30.5) * 2) < ((EV – 97.5) * 3), then barrel = yes
if EV > 97.5 mph but none of these apply, then barrel = no

“Not all barrels are equal” takes on its meaning once you convert the above scatterplot to a heatmap. I set the low end of the color legend artificially high to show the contrast between barrels that are relatively productive versus those that are massively productive:

Read the rest of this entry »


A Needed Update on Launch Angle Tightness

As the de facto purveyor of launch angle tightness (or launch angle consistency, both terms that I use interchangeably), it is important I relay to you significant developments related to launch angles in general in 2020. Let the record show I am merely the messenger and Connor Kurcon, whose name graces these pages (or at least my pages) quite often these days, is forever my muse.

In 2020, Major League Baseball instituted its new pitch-tracking (and also ball- and player-tracking) system, Hawk-Eye. You can read about its merits here, among them being its alleged ability to “more comprehensively [track] the full flight of the ball”:

Furthermore, if the ball leaves the field of view of all 12 cameras (as can happen on high pop-ups and fly balls), the system can then reacquire the ball later in its trajectory as gravity pulls it back into the view of one or more cameras.

Hawk-Eye was expected to track more than 99% of all BBE, a significant upgrade from the previous system. Many approached the claim with skepticism. Turns out, the claim may be legit.

Kurcon noticed Hawk-Eye all but ruined the year-to-year consistency of launch angle tightness. Consistency is now inconsistent! Specifically, launch angle consistency values (calculated as the standard deviation of launch angle) have nearly universally grown larger in 2020. For the purposes of launch angle consistency, higher is worse, so it gives the appearance (if you’re looking at players individually and not at the larger picture) that a lot of players cratered a bit during the spring season. And it’s not only because of the shortened season, although the season’s length does contribute partly to the discrepancy:

Read the rest of this entry »
