Archive for Statcast

Lay Off the High Ones

It’s like Dottie said, “Lay off the high ones.” But, it ain’t so easy. Just ask Kit. I feel like I’ve been seeing more swings and misses on pitches up and out of the zone. Here’s an example, courtesy of Pitching Ninja:

Read the rest of this entry »


Who Hit It Harder? Round 2

Round 1 | Round 2

Have you ever been to a circus or county fair, and they have that game where random people hit a spot with a sledgehammer and try to ring the bell at the top? With enough force, it can be done, but contestants must be strong! The game, according to Wikipedia is called the high striker. You can hear the game being played from afar, a crack of a hammer, a crowd cheering, and every once in a while, a bell ringing. You can hear the shouts too, “Step right up, step right up! See if you have the strength to ring the bell! You sir! You look like a strong man who can impress all these people. Just five bucks a whack! Step right up and show us how strong you really are!”

Part of the reason this is so fun and entertaining is because it’s one of those cases where all else really is equal. In baseball, that rarely, if ever, truly happens. Take for example two hitters who have struck the same pitch type with the same launch angle. How would you determine which one was hit harder?

Guess That EV
Launch Angle 2022 MaxEV 2022 HardHit% Exit Velocity
Player A 23 118.4 43.4% ?
Player B 23 117.4 61.2% ?

What other information would you like? The count? The pitcher? Whether or not runners were on base? Now, we’re adding in variation. We’re giving one person in our analogy a heavier hammer or maybe one of our contestants is somehow stronger when other people are watching. Ok, enough with the analogy, let’s add some variation to our baseball data points:

Guess That EV, Added Info
Launch Angle 2022 MaxEV 2022 HardHit% Count Pitcher Runners On: Exit Velocity
Player A 23 118.4 43.4% 0-0 Brent Suter Third ?
Player B 23 117.4 61.2% 2-1 Brock Burke – ?

As we know, these two batted balls are not, could not be totally equal. They were in different cities with different weather scenarios with different pitchers with different runners on base. Both, however, did leave the yard for home runs:

Player A – Oneil Cruz – Video Link – 113.9 MPH

Player B – Yordan Alvarez – Video Link – 114.6 MPH

So, what makes these two batted balls unique? Well, a lot actually. But, hit an in-the-zone pitch that hard and it’s going to go a long way. It just all depends on how hard you can swing the hammer. Without further ado, let’s play another round of, “Who Hit It Harder!”


Who Hit It Harder? – Round 2

3-2 count, sinkers in statcast gameday zone 8.Sinker Pitch Chart, Gameday Zone 8
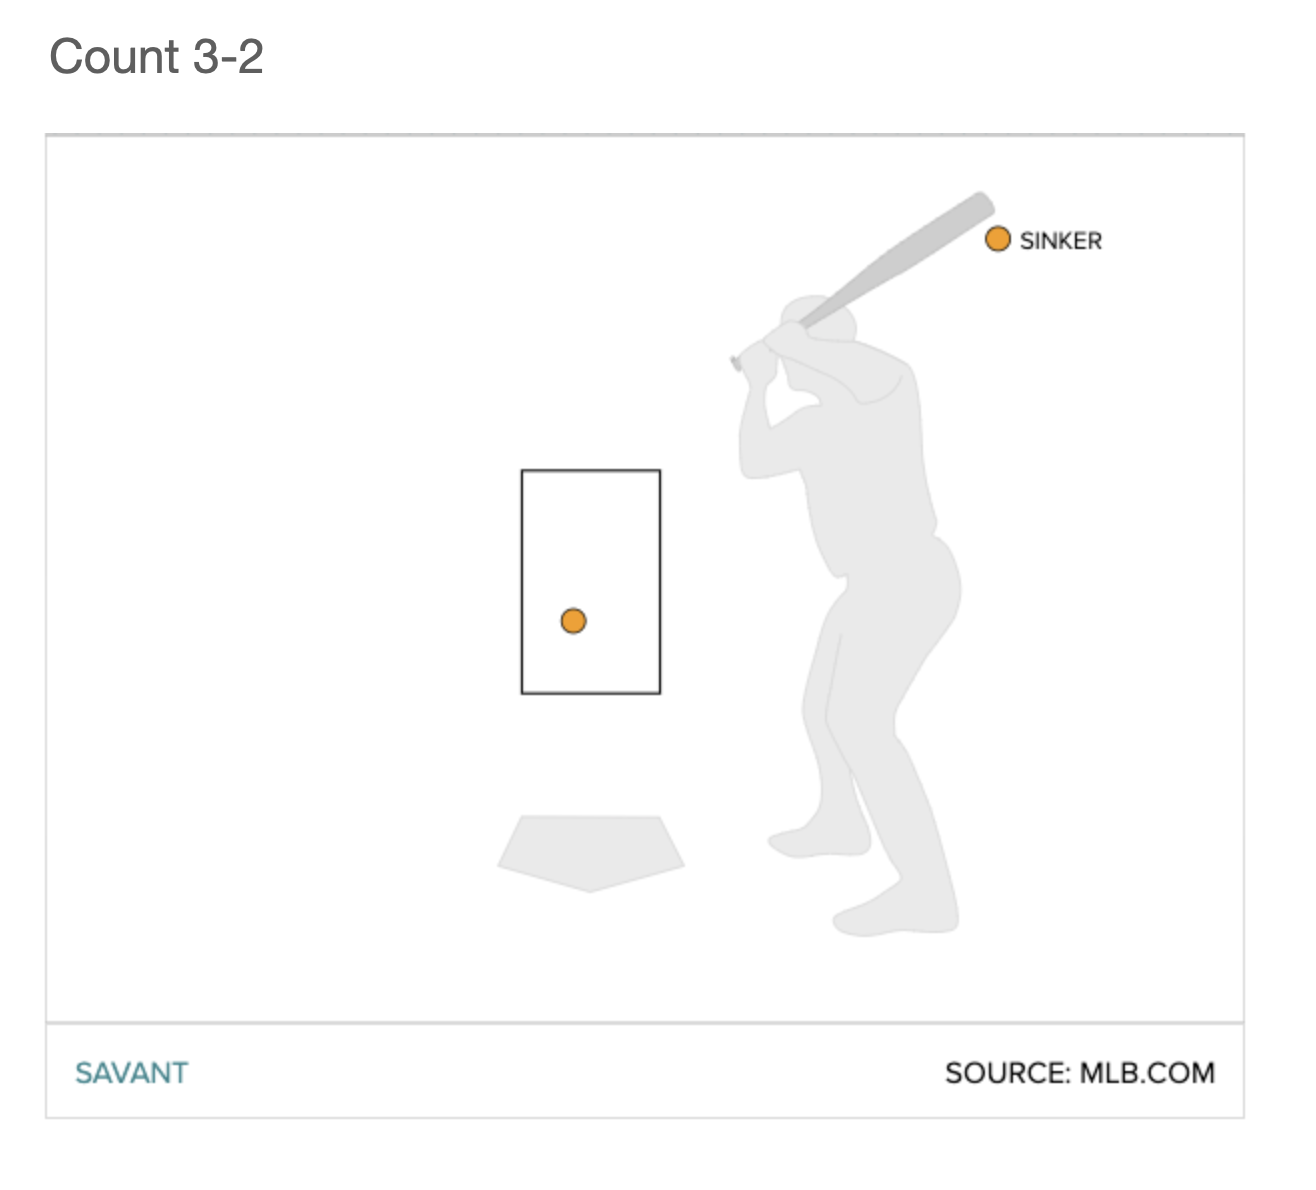
In this exercise, I’ll give you three batted balls under somewhat similar conditions and your job is to determine which batter hit the ball harder. Here are our hitters along with some data points:

Batted Ball Data: Round 2
Batter Pitch Type Pitch Velocity Batter Stands Pitcher Throws Count
Keston Hiura SI 92.5 R R 3-2
Ronald Acuña Jr. SI 93.4 R L 3-2
Anthony Santander SI 95.3 R L 3-2
SOURCE: Statcast

Here are three heavy hitters who have stepped up to the plate and worked their way into a full count. A sinker, low in the zone comes at them and they each put the ball in play. There’s not a whole lot of differentiation here. Santander certainly had a faster pitch to hit, but both he and Acuña benefited from a righty-lefty matchup. Here’s some more information for you to use to determine who hit it harder:

2022 Averages: Round 2
Batter PA maxEV 2022 Average EV HardHit% Barrel%
Keston Hiura 156 112.4 93.3 50% 18.2%
Ronald Acuña Jr. 368 117.9 91.1 52.3% 12.7%
Anthony Santander 460 113.2 90.1 42.7% 10.5%
2022 MLB Averages – – 88.6 38.3% 7.6%
SOURCE: Statcast

If you use HardHit% to simply help you decide then you can just play the percentages and choose Ronald Acuña. But, what about that perfect combination of exit velocity and launch angle? Percentages tell you that Hiura finds the sweet spot more often, but that’s misleading because he’s only had 156 plate appearances. So, what do we do? How about adding in, probably the most important metric to putting this puzzle together, launch angle:

Hint 1: Round 2
Batter Launch Angle
Keston Hiura 35
Ronald Acuña Jr. -12
Anthony Santander 3
SOURCE: Statcast

Remember that what we’re after is exit velocity. We know that each of these hitters can hit the ball hard, but under these conditions, who hit it harder? We can probably assume that Acuña’s ball goes into the ground. Does a sinker hit into the ground have a lower EV than one that is put in the air? How does the pitcher influence your decision?:

Hint 2: Round 2
Batter Pitcher IP EV maxEV Barrel% HardHit% ERA xERA
Keston Hiura Adrian Sampson 샘슨 53.1 86.8 115.2 6.0% 32.1% 3.88 3.88
Ronald Acuña Jr. Ranger Suárez 107.1 86.9 115.8 6.5% 30.9% 3.52 3.64
Anthony Santander Aaron Ashby 91.1 87.8 112.3 6.3% 34.4 4.32 –
SOURCE: Statcast


Here’s one graph that will show you it’s really anybody’s guess. Balls can usually be hit with high exit velocity despite the launch angle, but typically balls hit straight into the ground, angles of -40 or below, have a hard time getting above 100 MPH.


Scatter Plot, LA vs. EV (Zone 8 Sinkers)

Now, it’s time to guess. Decide which hitter had the higher EV and cross your fingers. Want to see for yourself? Here are the links to each individual at-bat.

Keston Hiura video

Ronald Acuña Jr. video

Anthony Santander video


ANSWER:

Round 2: Answer
Batter Events Hit Distance Launch Speed
Keston Hiura home_run 416 110.5
Ronald Acuña Jr. field_out 349 110.8
Anthony Santander single 389 111.2
SOURCE: Statcast

It may seem strange to have a groundball single take the cake by only .4 MPH. But if this were a leaderboard, Santander would be on top. It goes to show that a high exit velocity doesn’t always translate to a home run. But, exit velocity and launch angle together do. When a sinker low in the zone just doesn’t sink enough, it can go a long way. However, these three outcomes show us that context is key. A ball hit with a proper angle and force can make good things happen. But, that’s also why a sinker, low in the zone in a 3-2 count can make a monster hitter like Ronald Acuña Jr. head back to the dugout. Now, we just need to get him, Santander, and Hiura to swing by the high striker the next time the circus is in town.


Can a Baseball Make it to the Moon?

Short answer: No.

Read the rest of this entry »


Who Hit It Harder? Round 1

John E. Sokolowski-USA TODAY Sports

Stop me if you’ve heard this one before; Aaron Judge hits the ball hard.

On June 6th, 2022 Dylan Bundy left a changeup right over the heart of the plate for none other than current 2022 MVP candidate Aaron Judge. If you’ve never seen Aaron Judge before, he’s big. He’s not the type of guy you want to leave one over the heart of the plate for. Can you guess what happened? It was smoked. The ball was scorched 116 MPH to left field and while it doesn’t look like much of an issue for the left fielder in the video below, I can guarantee that if it were me (and probably you too) in left field, there would be more avoidance of the ball than intentionally getting in front of it.

Let’s take a look:

Read the rest of this entry »


Starting Pitcher xERA Underperformers — Jun 23, 2022

I haven’t done a lot of research on Statcast’s xERA metric, but it’s similar to batter xwOBA in that it uses a pitcher’s actual batted balls against to compute what a pitcher’s ERA “should” be. That means for all those who love justifying a pitcher’s low BABIP being the result of allowing soft contact, xERA should theoretically account for this. Now, this doesn’t mean the pitcher will continue to allow the types of batted balls that have resulted in a suppressed or inflated xERA, but it does suggest that what they have already allowed should yield the calculated xERA. So let’s review the pitchers who have most underperformed their xERA marks.

Read the rest of this entry »


Early Season ISO Leaps

This early in the season it’s easy to jump all over players who are putting up big numbers. But just remember, you drafted a team while considering their projected season-long stats and while it may be tempting to drop a poor performing player at the start of the season for a hot starter, take caution. Players who hit doubles and triples and home runs early in the season can make a lot of noise, as they’re likely to put up strong category stats. Isolated power is a nice statistic that allows us to see, “how often a player hits for extra bases”. But, ISO does not stabilize until around 16o at-bats, and it will probably take another two weeks or so before we can really call this a good sample size. Let’s take a look at players who have shown strong early season ISO, how it compares to the ISO they showed at the start of last year and how that compares to their career average. Read the rest of this entry »


Creating Synthetic Data In a Data-less World

What will we do without the zeros and ones of spring training? The underground, black market .csv file that comes from the person who knows the person who operates a Rapsodo in a mini-camp? How will we go on without knowing spin rates or the depth of clay infield impression drilled by various brands of signature spikes? I have an idea, let’s make it up.

Read the rest of this entry »


Baseballs to the Moon!

I won’t claim to know as much about Bitcoin as some of my peers, but I know enough to determine that winning $100K of it would be great. For the more crypto-skeptical baseball fans out there, MLB and their new contest sponsor, FTX, are offering cold, hard cash as an alternative reward for their new promo contest. The challenge? Guess who will hit the longest home run of the rest of the season, the distance in feet of that home run, and the type of home run (solo, 2-run, etc.,). Let’s take a look at the details of the Moon Blast contest and see if our more enlightened way of thinking can help make a prediction.

Read the rest of this entry »


A(n Unnecessary) Sprint Speed Adjustment for xBA

Hi! Disclaimer: In this post I use raw Statcast data to calculate expected batting average (xBA). Evidently the raw data do not include the sprint speed adjustment that the Statcast folks said they made. That adjustment only shows up on player pages and in the search. This explains why it seemed to me an adjustment had not been made! The xBA values on player pages are much closer than the raw values and look similar to what I have presented below, and it explains my confusion herein regarding the matter.

So, this post reinvents the wheel a bit. Perhaps it can serve as a mini-primer or -tutorial for you. At the very least it can serve as further validation of the work that the folks at Statcast completed and instituted a couple of years ago. Just keep in mind that the original post below remains intact, completely unedited.

Thanks for reading!

* * *

It has always seemed rather obvious to me that Statcast’s expected batting average (xBA) failed to properly account for a hitter’s speed (“sprint speed”). It seemed like fast hitters routinely outperformed their xBAs while slower hitters underperformed. In looking at a Statcast-era leaderboard (2015-21) of differentials between actual and expected batting averages on ground balls, obvious names rise to the top: Delino DeShields, Dee Strange-Gordon, Eduardo Núñez, Billy Hamilton, Jose Altuve, Jonathan Villar, Norichika Aoki, Mallex Smith, Jean Segura, Adam Eaton, Starling Marte… the list of players who have historically outperformed their xBAs by the widest margins are (were) all elite speedsters. At the other end of the spectrum, post-prime sluggers: Justin Smoak, Chris Davis, Logan Morrison, Jay Bruce, Kendrys Morales, etc. etc.

I thought this exact phenomenon, which is not a revelation by now, had once nudged the Statcast team to apply a sprint speed adjustment to xBA. Apparently, this happened sometime between the 2018 and 2019 seasons. Here’s the original snippet, which I very lightly edited for clarity:

Read the rest of this entry »


Analyzing Power Drainers

In one of the most iconic and artistic pieces of American cinematography of all time, power-hungry aliens travel to Earth from Planet Moron Mountain and drain NBA basketball all-stars of their talent. While I still hold out hope that there will be a baseball version of SpaceJam within my lifetime, I can only imagine who amongst MLB’s stars would be cast. One look at statcast leaderboards could help. Here are the 10 qualified hitters so far this year who have seen the largest drain in hard-hit rate:

Read the rest of this entry »