Who Hit It Harder? Round 1
Stop me if you’ve heard this one before; Aaron Judge hits the ball hard.
On June 6th, 2022 Dylan Bundy left a changeup right over the heart of the plate for none other than current 2022 MVP candidate Aaron Judge. If you’ve never seen Aaron Judge before, he’s big. He’s not the type of guy you want to leave one over the heart of the plate for. Can you guess what happened? It was smoked. The ball was scorched 116 MPH to left field and while it doesn’t look like much of an issue for the left fielder in the video below, I can guarantee that if it were me (and probably you too) in left field, there would be more avoidance of the ball than intentionally getting in front of it.
Let’s take a look:
If I gave you this situation, a changeup left for feasting in statcast’s Gameday Zone 5, and asked you to pick who hit the ball the hardest among three big-league sluggers and Aaron Judge was on the list, you’d likely just choose Aaron Judge. But, what if the list was a little less assumptive? You might need to dig into the data points a little further in order to make a more informed decision and you might actually have fun. So, let’s make a game of it! I’ll give you three hitters, one very specific pitch, and some statcast batted ball data points to analyze. Aaron Judge won’t be on the list. Your task is to choose which of the three batters hit the ball the hardest according to exit velocity. Let’s play!
Who Hit It The Hardest? – Round 1
Barreled balls, 0-0 count, four-seam fastballs in statcast gameday zone 2.
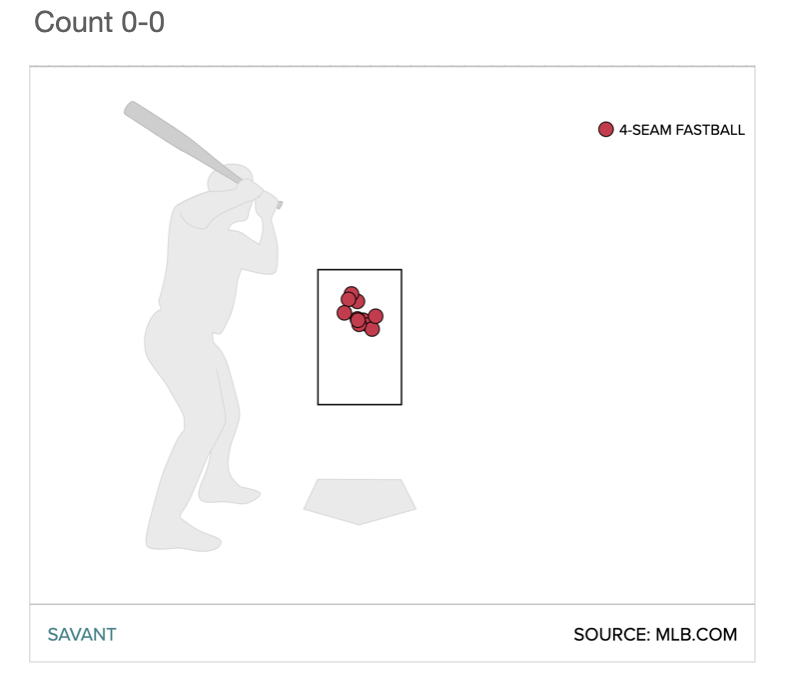
Gameday zone 2 according to Baseball Savant is middle-up and meatball-esque. Enrique Hernández has placed this particular pitch in play the most this season on a barreled ball, three times. He’s hit one for a single, one for a double, and one for a home run. Remember, that’s specific to 0-0 counts and Enrique is a career 59% F-Strike batter. Those are good outcomes, but I haven’t given you any other information about them besides the location and count. Certainly, not all middle-up four-seam fastballs are created equal, and that’s why I’ll give you some more data to make your guess. Meet our contestants:
| Batter | Pitch Type | Pitch Velocity | Batter Stands | Pitcher Throws | Spin Rate |
|---|---|---|---|---|---|
| Kyle Garlick | FF | 97.5 | R | L | 2298 |
| Nick Solak | FF | 92.2 | R | R | 2443 |
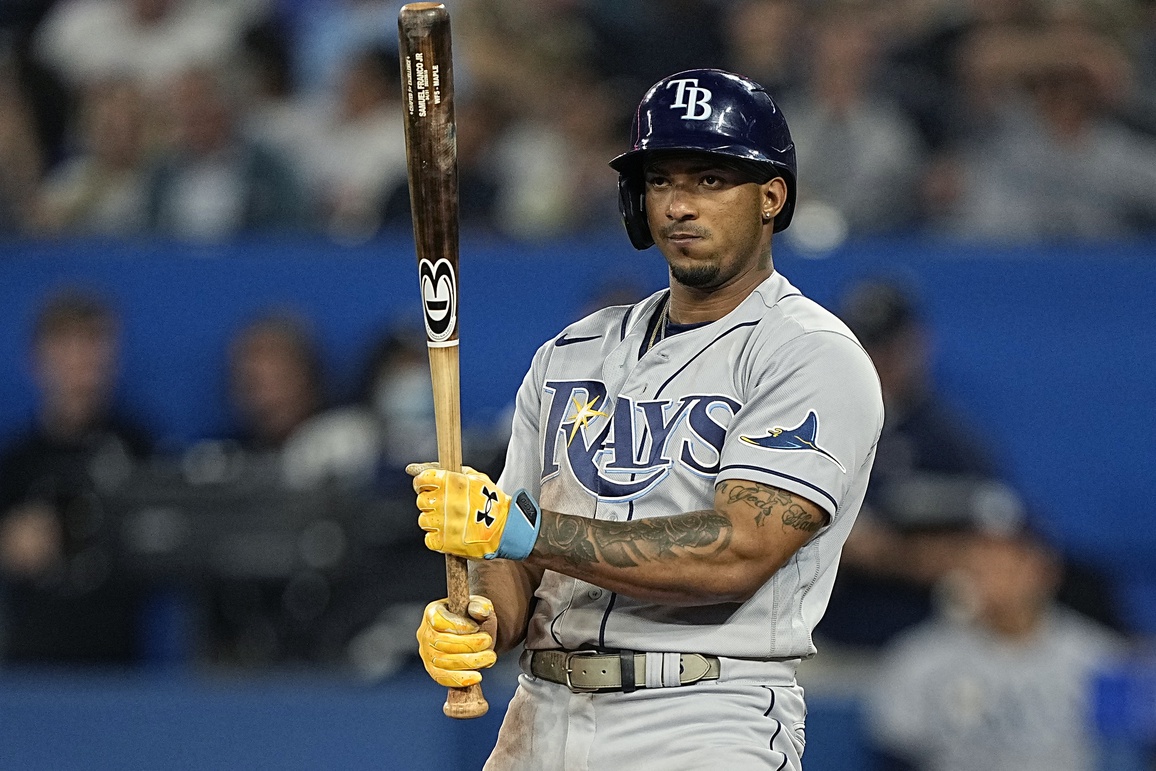
| Wander Franco | FF | 91.3 | L | R | 2321 |
So, what do you say? Upon first look you might think a meatball at 91.3 mph for Wander Franco seems like a safe bet. Maybe you’re more inclined to take the pitch that’s coming in faster, maybe because a faster pitch could generate quicker bat speed. Do you look at righty/righty versus righty/lefty matchups? How about a little background information on each hitter to get you started:
| Batter | PA | maxEV | 2022 Average EV | HardHit% | Barrel% |
|---|---|---|---|---|---|
| Kyle Garlick | 91 | 110.2 | 92.9 | 54.1% | 13.1% |
| Nick Solak | 75 | 111.1 | 88.4 | 36% | 6% |
| Wander Franco | 247 | 112.4 | 88.1 | 37.7% | 4.4% |
| MLB Averages | – | 119.8 | 88.7 | 38.5% | 7.8% |
You could simply look at Wander Franco’s pure power and go from there. His 112.4 2022 maxEV is impressive and ranks in the 86th percentile according to his Savant page. Or, perhaps you think Kyle Garlick’s above-average Barrel% is something to sway your pick. Maybe you think Nick Solak just hasn’t been given enough opportunity and he’s really the one with the raw power here. He has hit the ball hard before. Well, how about a hint? Don’t care for a hint? Scroll down and don’t look! Here’s each batted ball event’s launch angle:
| Batter | Launch Angle |
|---|---|
| Kyle Garlick | 27 |
| Nick Solak | 21 |
| Wander Franco | 23 |
Ok, does that help? Probably not. These launch angles are certainly in the sweet spot range, but I’ve already told you that all three of these batted ball events are labeled as barreled balls. Does a six-degree launch angle range change much? How about I tell you the pitcher who threw this meatball on display and some of their 2022 statcast measurements? Will that be enough? Maybe. Let’s try:
| Batter | Pitcher | IP | EV | maxEV | Barrel% | HardHit% | ERA | xERA |
|---|---|---|---|---|---|---|---|---|
| Kyle Garlick | Shane McClanahan | 110.2 | 87.0 | 116.2 | 7.8% | 30.2% | 1.71 | 2.28 |
| Nick Solak | Nick Pivetta | 103.2 | 91.1 | 115.7 | 8.6% | 46.2% | 4.08 | 4.31 |
| Wander Franco | Michael Wacha | 70.1 | 89.1 | 112.4 | 7.1% | 36.5% | 2.69 | 4.61 |
Cy Young hopeful Shane McClanahan doesn’t give up hard contact all that often, but one really hard-hit ball (maxEV) sneaked in at one point this season. Nick Pivetta does give up hard contact and his ERA is expected to be higher as a result. Michael Wacha is a seasoned veteran and knows how to pitch to young up-and-comers like Wander Franco.
Now it’s time to guess. Make your guess now. Don’t scroll down until you’ve decided.
Want to see for yourself? Here are the links to each individual at-bat.
ANSWER:
| Batter | Events | Hit Distance | Launch Speed |
|---|---|---|---|
| Kyle Garlick | home_run | 416 | 110.2 |
| Nick Solak | field_out | 349 | 106.9 |
| Wander Franco | home_run | 389 | 109.7 |
Kyle Garlick’s 416-foot bomb off of Shane McClanahan takes the cake. His ball was hit for a home run to dead center and it was hit hard. While Garlick’s maxEV is the lowest among these three hitters, his average exit velocity is the highest and he hits the ball hard on a more consistent basis. You could argue that his rates haven’t stabilized with a low plate appearance count and this blast on display was Garlick’s max on the year so far. But, I have a feeling he’s got more juice to add to his swing. If you lower the Baseball Savant Expected Stats leaderboard down to 50 batted ball events, Garlick’s .394 xwOBA ranks 24th among these low BBE players. In addition, he was facing the most difficult pitcher of the three to make hard contact on. You may have seen Shane McClanahan’s 30.2% HardHit% in 2022 and crossed Garlick off the list. But the 30-year-old has seen his share of middle-up fastballs and he’s clearly not afraid. Solak got robbed out of a double and Franco turned on one, pulling the ball out with such smooth, yet alarming power. Sorry Wander, Kyle had you beat by a clear half mph. Sadly, Garlick is only projected by FanGraphs Depth Charts ROS to make 68 more plate appearances. But, keep an eye out for more power. I’m willing to bet he could reach 112 mph by season’s end.
Hey, this was fun.
This was a blast. Give me more. (Also, for the record, I guessed right from the get-go and never changed my mind.)
maxEV is a sucker bet
You could just look at the sheer power of Wander Franco and go from there. Her 112.4 maxEV 2022 is impressive and ranks in the 86th percentile according to hers Wise page. https://www.vwcredit.me/ Or maybe you think Kyle Garlick’s above-average barrel percentage is something to sway your pick. Maybe you think Nick Solak didn’t have enough opportunities and he’s really the one with the raw power here. He has first hit the ball hard. Well, how about a tip? Not interested in a tip? Scroll down and don’t look! Here is the launch angle of each batted ball event.
What is this bullplop
Please make this a regular feature, although I’m sure it was a ton of work. This is a brilliant approach to bridging the gap between the numbers and what we see.
I would love to see counter-intuitive examples. EG, compare 3 batters – one who hits a homer, one who hits a towering popup, and one who grounds out. Or 2 bip, where one is a homerun and one a flyout where the homer has lower EV.
To make it easier, I think you could do the video links and general bip data / hitter context. IE, I kinda only skimmed the pitcher information.