When something becomes sexy, I’m all in. Crocs and socks? Sexy. Minivans with a built-in vacuum cleaner to suck up all the floor Cheerios? Sexy. Throwing a four-seam fastball with a very shallow vertical approach angle due to some serious induced vertical break at the top of the zone? Sexy. Some things some people just can’t pull off. But when a trend becomes a trend, you’re either in or you’re out.
Part one of this installment looked at four-seam fastballs and cutters. Part two analyzed sinkers and splitters. Part three, our final act, will detail sliders, curveballs, and changeups.
pVals are a topic of debate among pitch-level data masterminds. One side may consider them useless. Good pitches get hit and bad pitches get taken for strikes and pVals don’t explain any of that. On the other side, people like to know what actually happened. If a splitter left in the middle of the zone gets a called third strike when it probably should have been mashed for a home run, then pVals still credit the pitcher. The strikeout is what actually happened.
Keep in mind as you peruse this season’s best fastballs just that; pVals aren’t perfect. You’ll read about Chris Bassitt’s sinker and think, Chris Bassitt is a clear candidate for being drafted, but read on and you may back away from that stance. pVals help us understand what occurred, but take caution when using them to predict what will happen. Confused? Let’s just watch some GIFs.
Part one of this installment looked at four-seam fastballs and cutters. Part two will focus on sinkers and splitters.
On July 17th of the 2022 season in Minnesota, Dylan Cease dealt. He threw seven innings, only gave up one hit, and recorded eight strikeouts. His showing left a game score of 83. It wouldn’t be his highest game score of the year (94), in fact, it wouldn’t even be his second-highest (90), but it was a great outing nonetheless. I’m going to use this game as way of continuing my analysis from last week on what we can measure from a pitching mechanics standpoint using statcast pitch-level data. Like in last week’s post, I took the following variables from Cease fastballs on that great start, July 17th:
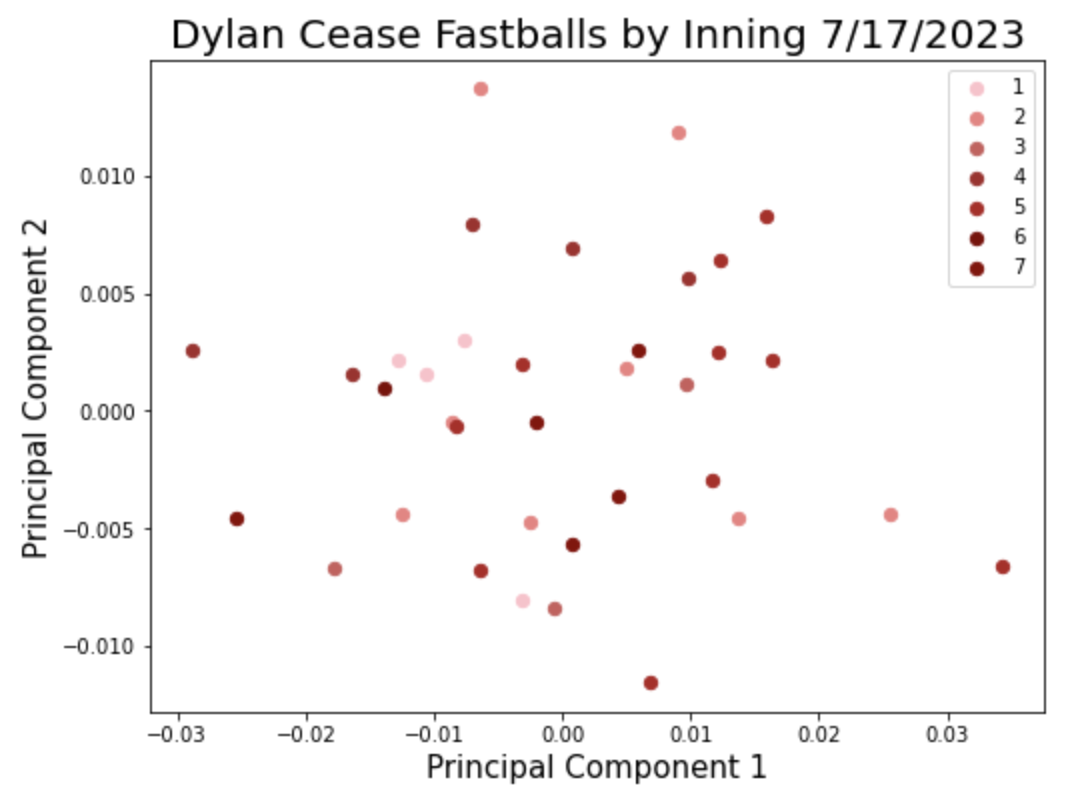
I then conducted a principal component analysis in order to bring these five columns of data down into two. That allows me to then plot the data points on a scatter plot like so:
The graph above shows two principal components of all of Cease’s fastballs thrown on July 17th. I am interested in understanding if the spread, or variance, of these data points, relates in any way to performance. A helpful suggestion from FanGraphs member, “couthcommander” came in last week’s post:
“[C]an you…change the point-character shape based on inning?”
I chose a slightly different route and changed the color of the points based on the inning. I was expecting to see the darker points (later innings) on the outer edges of the scatter plot and lighter points (earlier innings) tighter around the center, but it’s hard to notice much of a pattern from this one game. Let’s visualize it in a different way. Rather than directly plotting the two principal components as X and Y, I calculated the variance of each by inning and compared the two components:
Click to enlarge
The first principal component shows higher variance as the game goes on through the fourth inning, but then comes back down for the fifth and seventh. A similar pattern is shown in the second component but only through inning two. The variance in PCA2 jumped in inning five but came back down in inning seven. No fastballs were thrown in inning 6.
It’s important to remind ourselves of what we’re actually looking at here. PCA1 finds a new axis of variation in this multi-dimensional dataset. Imagine a straight line being drawn through a multi-dimensional scatter plot. This new “principal component” does its best job of explaining as much of the variability in the dataset as possible. By that logic, PCA1 is just a little more informative than PCA2. The bar chart is telling us that as the game increased, that component become more variable through the fourth and then stabilized in the fifth. But remember, this is only explaining the following:
So the question is, does it matter? Does the variance of a component measure of these five features correlate with success? We can look at the components of Cease’s start before and after the great July 17th start.
–July 24th VS CLE: Game Score 63–
PCA1 = 2.1
PCA2 = 0.2
Variance = STD(PCA)^^2 x 10,000
While this is in no way conclusive evidence, it’s a start. The variance of PCA1 was lowest on July 17th. The next step in this analysis, as always, is to bring in more data! I will work towards answering the question, does a low variance PCA1 or PCA2 correlate with better performance? If it does, fantasy managers could use this information, if it is tracked and made available, to determine hot spots in a season where pitchers are locked-in. Thanks for participating in this data journey with me. We’ll see where it takes us.
Through games played on June 23rd, 2022, Luis Arraez held the highest batting average in the MLB at .349. He was just ahead of Paul Goldschmidt (.340), who was in the midst of putting together a career year, and Xander Bogaerts (.335), who was just being Xander Bogaerts. So, if you had chosen a player that you thought was most likely to get a hit the following day, June 24th, any of those three players would have been a safe bet. But, it’s just not that simple, is it? Goldschmidt played the next day but went 0-4. Arraez played and went 0-4. Bogaerts didn’t play. And that really is the challenge in trying to predict something like who will get a hit each day. That’s why there remains a $5.6 Million jackpot on the line.
I’ve written about my ventures in using analytics and a predictive model (Jolt) to help with daily batter hit predictions while playing in the Beat the Streak contest. You can learn more about the contest here, you can listen to a podcast about it during the season and you can sign up to the play game yourself! I won’t write much about the specifics of the contest, but it is the motivation for this research. The general idea is that you choose a player each day that you think will get a hit, if he does, you get a point, if he doesn’t, you go back down to zero. The goal is to reach 56. But, strip away the millions, strip away any contest or fantasy-style game, and what we’re left with is the question of how to best predict the next day’s hitters.
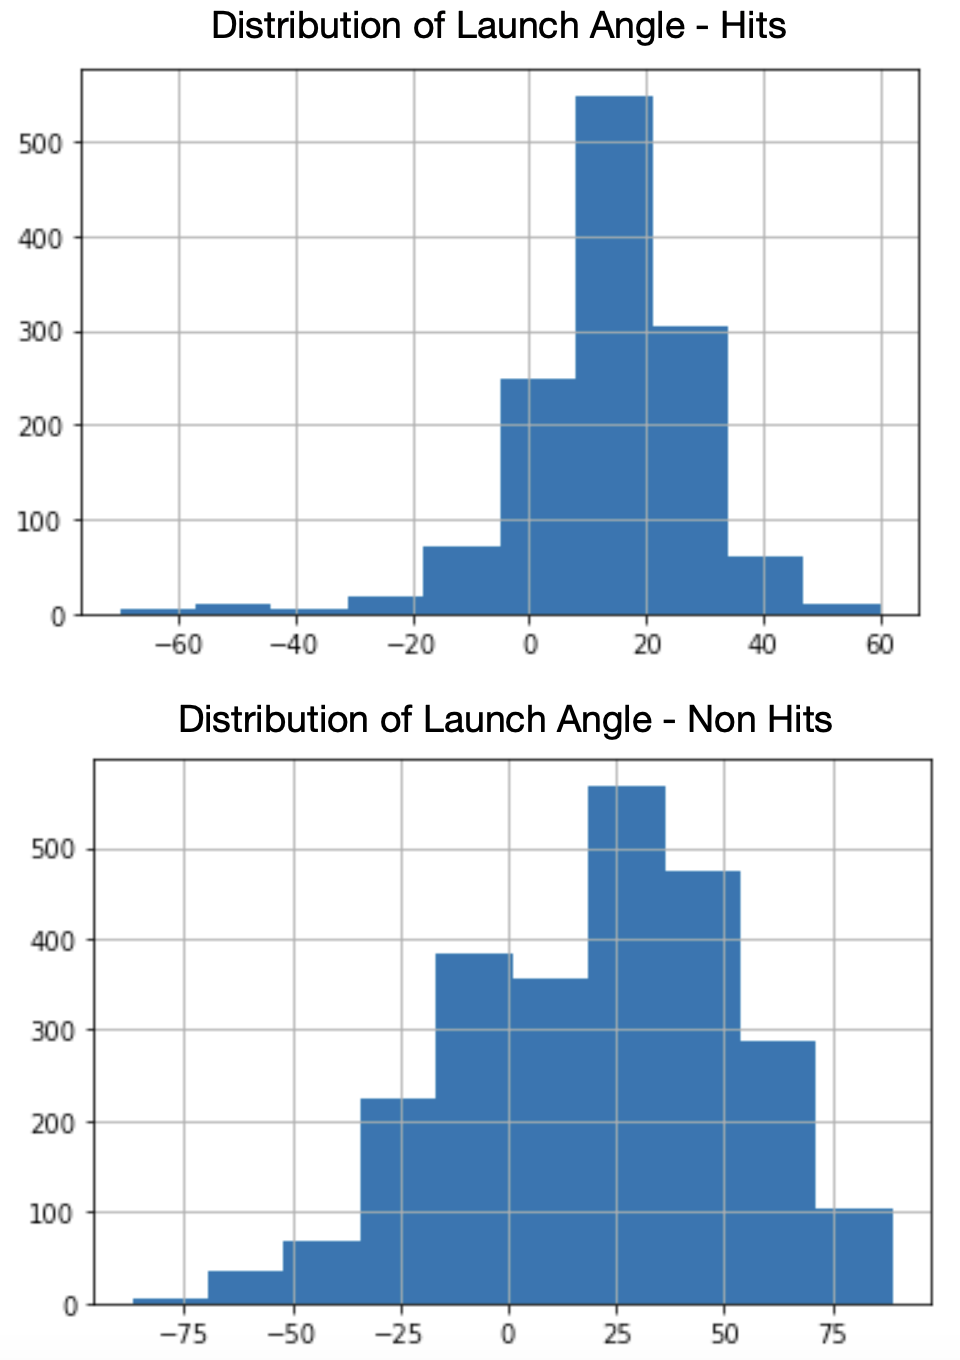
Jolt, the name of the model I’ve built to aid in making this prediction and a tribute to “Joltin” Joe DiMaggio, was built on the concept that the launch angle and launch speed of the hitter matter tremendously. Since we know that certain launch angles are more likely to lead to a hit and that balls hit hard also add to that likelihood, we can look for players who do that type of thing often. To show this in a visualization I randomly sampled a few days’ worth of savant batted ball data for each month of the 2022 season, sub-set that data down to only looking at batted balls from four-seam fastballs, and looked at the distribution of hits versus non-hits:
In this sample of data, batted balls (this does include home runs) ended in hits much more often with launch angles between, roughly, 10 and 20 degrees and that is something we have known for a while now. Balls launched at these angles have a much higher likelihood of being line drives and therefore, more difficult for fielders to get to. Let’s use this information and go back to June 24th. Through games played on the 23rd, there were eight hitters right in that solid average launch angle of 18 degrees bin. Here they are along with their up until that point batting average and June 24th results:
*Among qualified hitters with a 18 degree average launch angle through 6/23/22
Yahtzee! Is it really that easy? Just pick the hitter who has been to the plate a lot and has a level, hit-falling average launch angle? You might think this is basically the same as selecting line-drive hitters, but it’s not. At least, those two measurements aren’t showing the same hitters. Only Will Smith found himself in both the group of players above and in the top 20 qualified hitters by line-drive percentage. The funniest part about this sample of hitters is that the hitter with the highest batting average, Mookie Betts, is one of only two players to not get a hit the following day. This is random of course. But, just for kicks, let’s do it with hitters who had been putting the ball on the ground (5 degrees) too much through June 23rd and look at how they did on the 24th:
*Among qualified hitters with a 5 degree average launch angle through 6/23/22
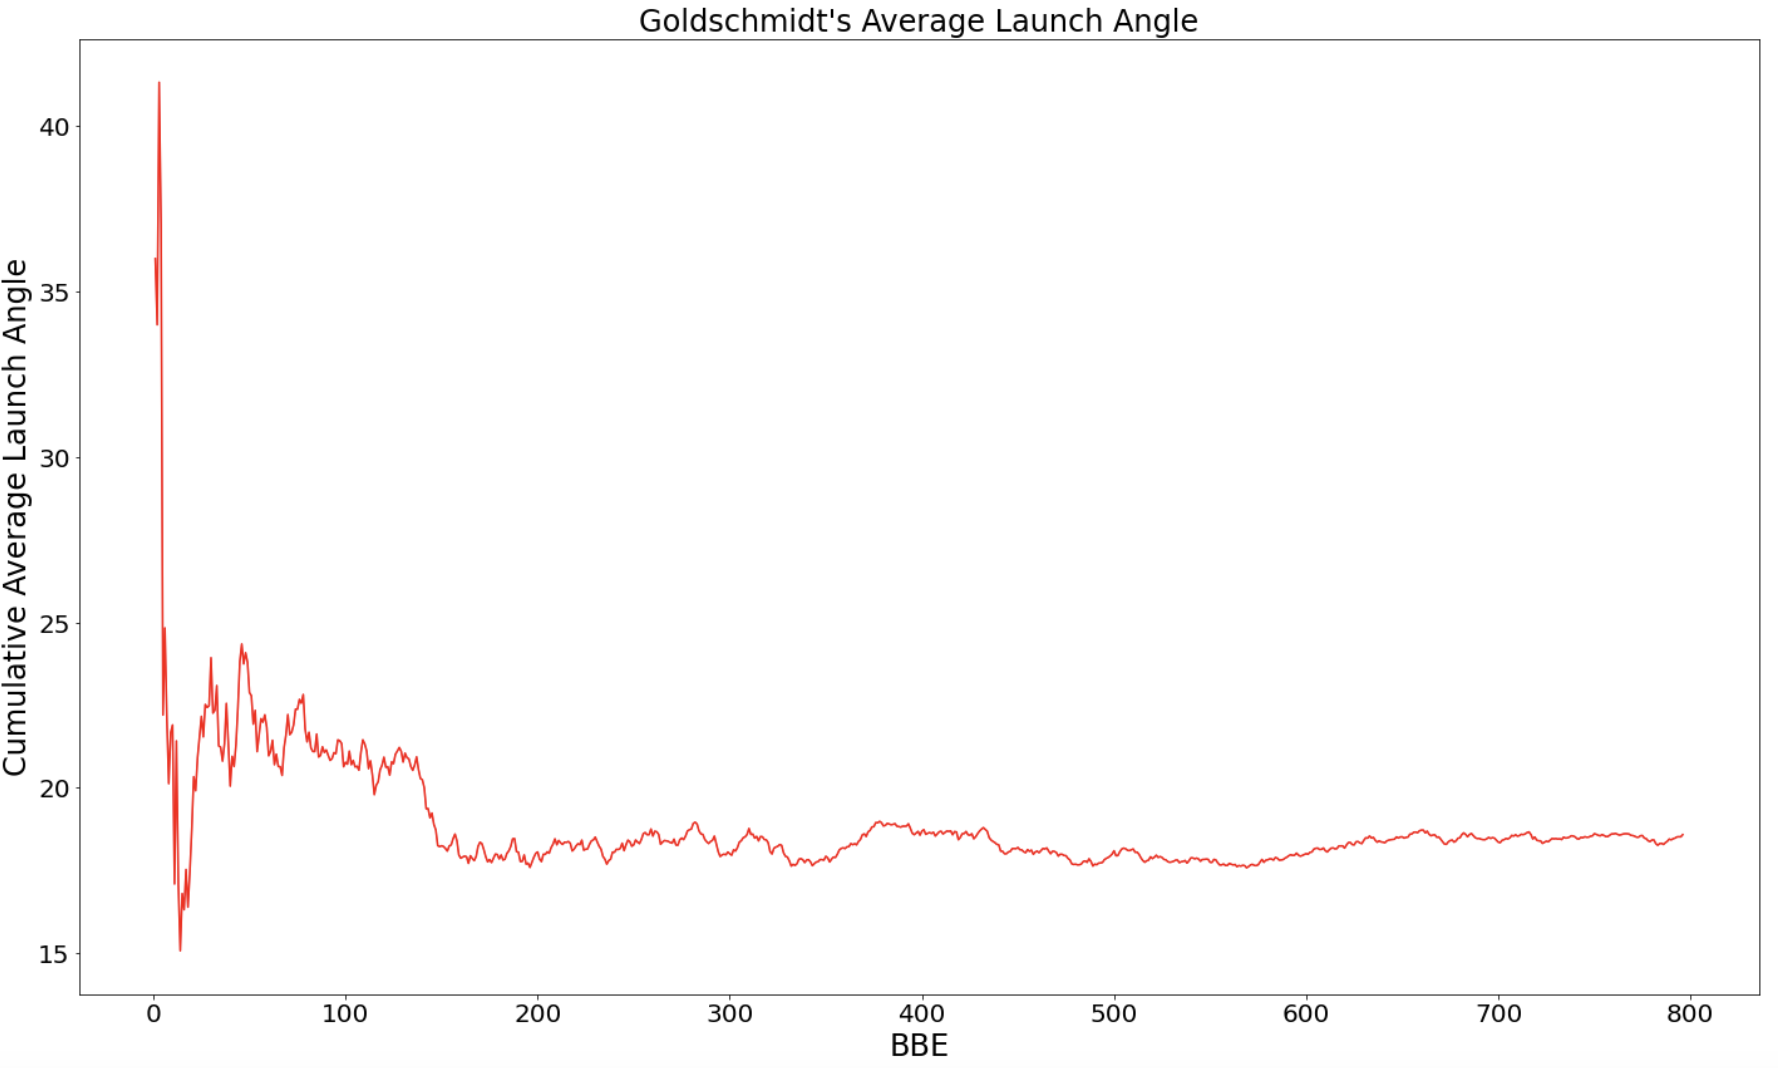
Ok, theory killed? Clearly you can see from the histograms that while a launch angle in the 10 to 20 range falls for a hit more often, there are a lot of other launch angles that fall for hits too. Those same launch angles don’t fall for hits as well. While finding players who have a tight launch angle, Alex Chamberlain style, would be a good strategy, you would likely find yourself choosing the same handful of hitters every day, thus limiting your player pool. Just look at Paul Goldschmidt’s 2022 cumulative average launch angle:
It becomes fairly stable around BBE number 200. Choosing Goldy every day would have been a good strategy in 2022, but for obvious reasons wouldn’t allow you to string together 56 consecutive hits and that’s the name of the game. It would also fail to take into consideration who was throwing the ball, which is arguably 50% (but probably more) of the equation. Jolt’s first iteration sought to find players with good launch angles matching good release points. The thinking was that high release points translate to higher approach angles and that uppercut swings bring the bat through the zone on those particular pitches longer. It’s not a new concept in baseball. Ted Williams’ 1986 book, The Science of Hitting, detailed some of this thinking.
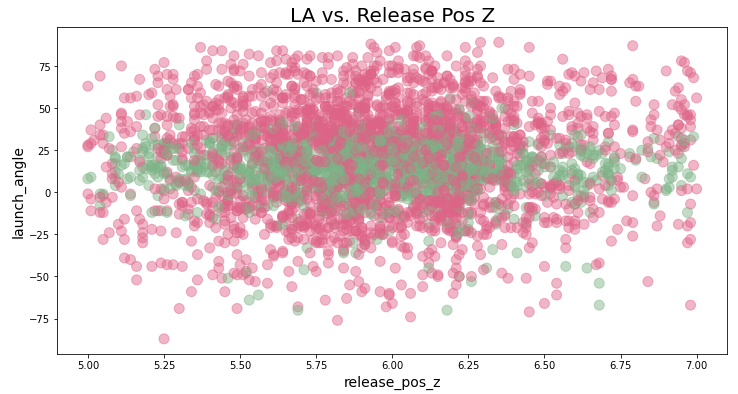
It was even backed up by the model’s validation. Jolt, iteration one, found ‘release_pos_z’, or the “vertical release position of the ball measured in feet from the catcher’s perspective” according to baseball savant, as the fifth most important variable in predicting a hit out of all of statcast’s outputs. Unfortunately, this is much, much more descriptive than it is predictive. A trained model will say that the launch angle of a batted ball and the release point of the pitch help “predict” whether the ball falls for a hit or not. While a release point, especially if you isolate to single pitch like just a fastball, can be predicted, you can’t really predict at which angle the ball will be hit before the batter swings. Here’s an example:
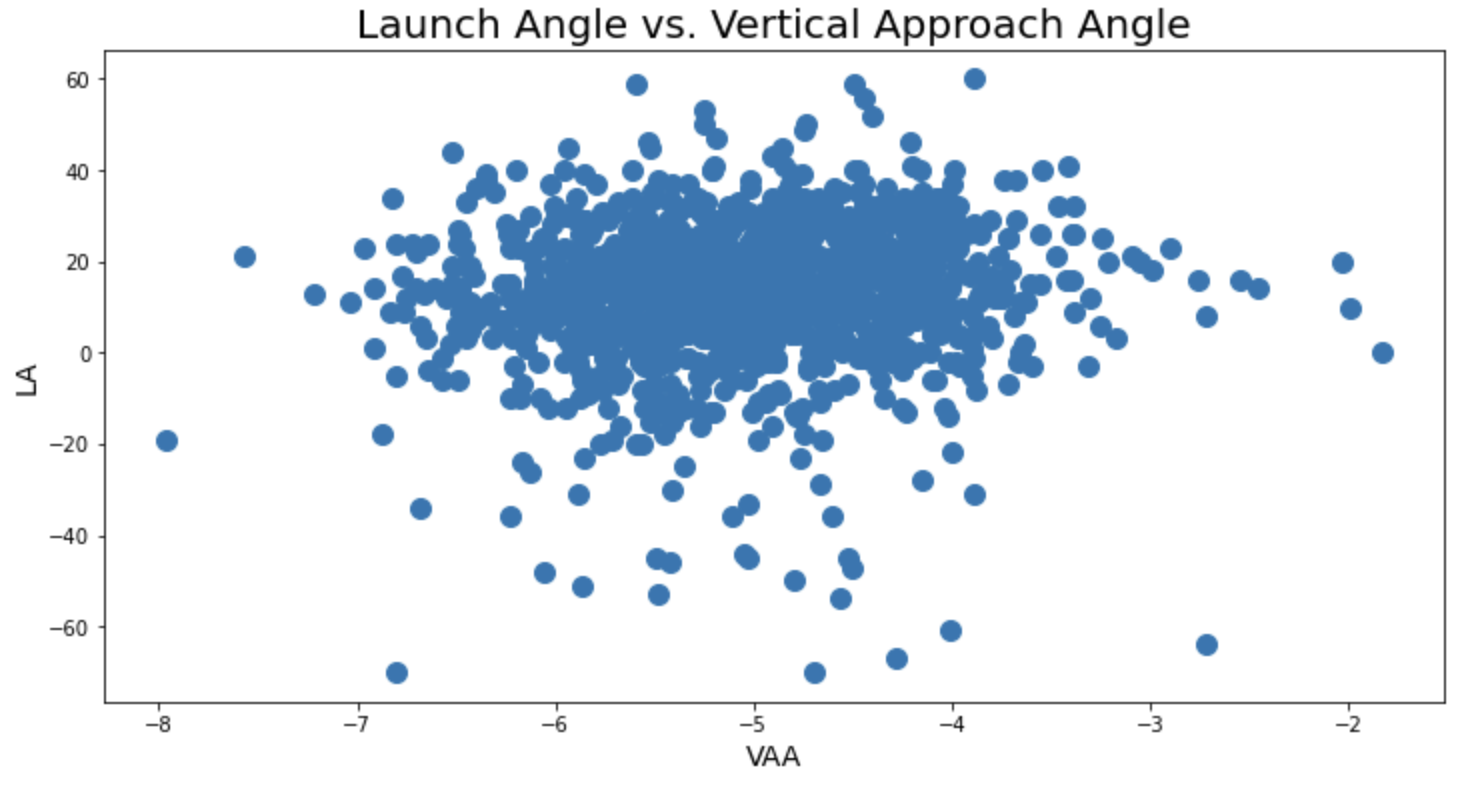
In this image, green represents hits in the data and red represents non-hits. The green band going across the chart tells us just how important the launch angle is, but it doesn’t have a relationship with the release point of the pitch. Any of these release points can match up with any of these launch angles and fall for a hit. It is uncommon for any launch angle above ~70 degrees to fall for a hit, but there may be a few outliers in there. Regardless, matching up a pitcher’s release point with a batter’s launch angle doesn’t seem to provide much detail when analyzing this data. Most of us would completely disagree with the data in this case, but it doesn’t mean that hitters are actively upper-cut swinging on high-released fastballs because I would imagine, that’s friggin’ impossible to do. But maybe it naturally happens? Maybe looking at it from a vertical approach angle (VAA), the angle of the ball as it crosses into the zone, is the better…um…approach? Let’s see:
This graph would tell you that besides the outliers, all VAAs can be hit with all LAs. Again, there is a HUGE discrepency between what we computer baseball nerds see and read and think and what a hitter actually does. If there are any hitters out there who know that tomorrow’s starting pitcher has a very steep vertical approach angle, are they altering their swing or approach to match it? Um…I’ll guess…no. It’s hard enough for them to decide to swing or take. But there must be somethign I’m missing. The launch angle in which a ball that falls for a hit is struck may not necessarily relate to how high the pitcher is releasing the ball, but certainly, some swing types are better against those pitches than others. But what is measuring that? What is measuring the actual swing? There have been some attempts made like the data collected by Swing Graphs, but nothing that I’ve seen is freely available to the public.
A model, whether it has a good R-squared, average-squared error, misclassification rate, or get-a-lot-of-likes-on-twitter rate, doesn’t do a good job of telling us whether a certain launch angle will be more successful against a certain vertical approach angle because it’s just too random and there’s too much noise. It’s also too difficult to create that data before it happens in order to make predictions on it. But, Jolt simply won’t quit. Iterations continue and there remains work to be done to better model tomorrow’s hit likelihood. In fact, MLB does it for its Beat the Streak app. But, no one has found success in just picking the top-recommended hitter each day, have they? Of course, I’m not implying that a model will be the only way to win this contest, in fact, I don’t think one single person will ever be able to win this contest. However, sometimes a simple model coupled with logical thinking and sound judgment is best. Jolt’s next attempt will focus on that. Just look at the table of June 24th’s outcomes at the top of this page and you’ll see, there’s something to just choosing who is hot each day and who works well against the guy standing on the mound.
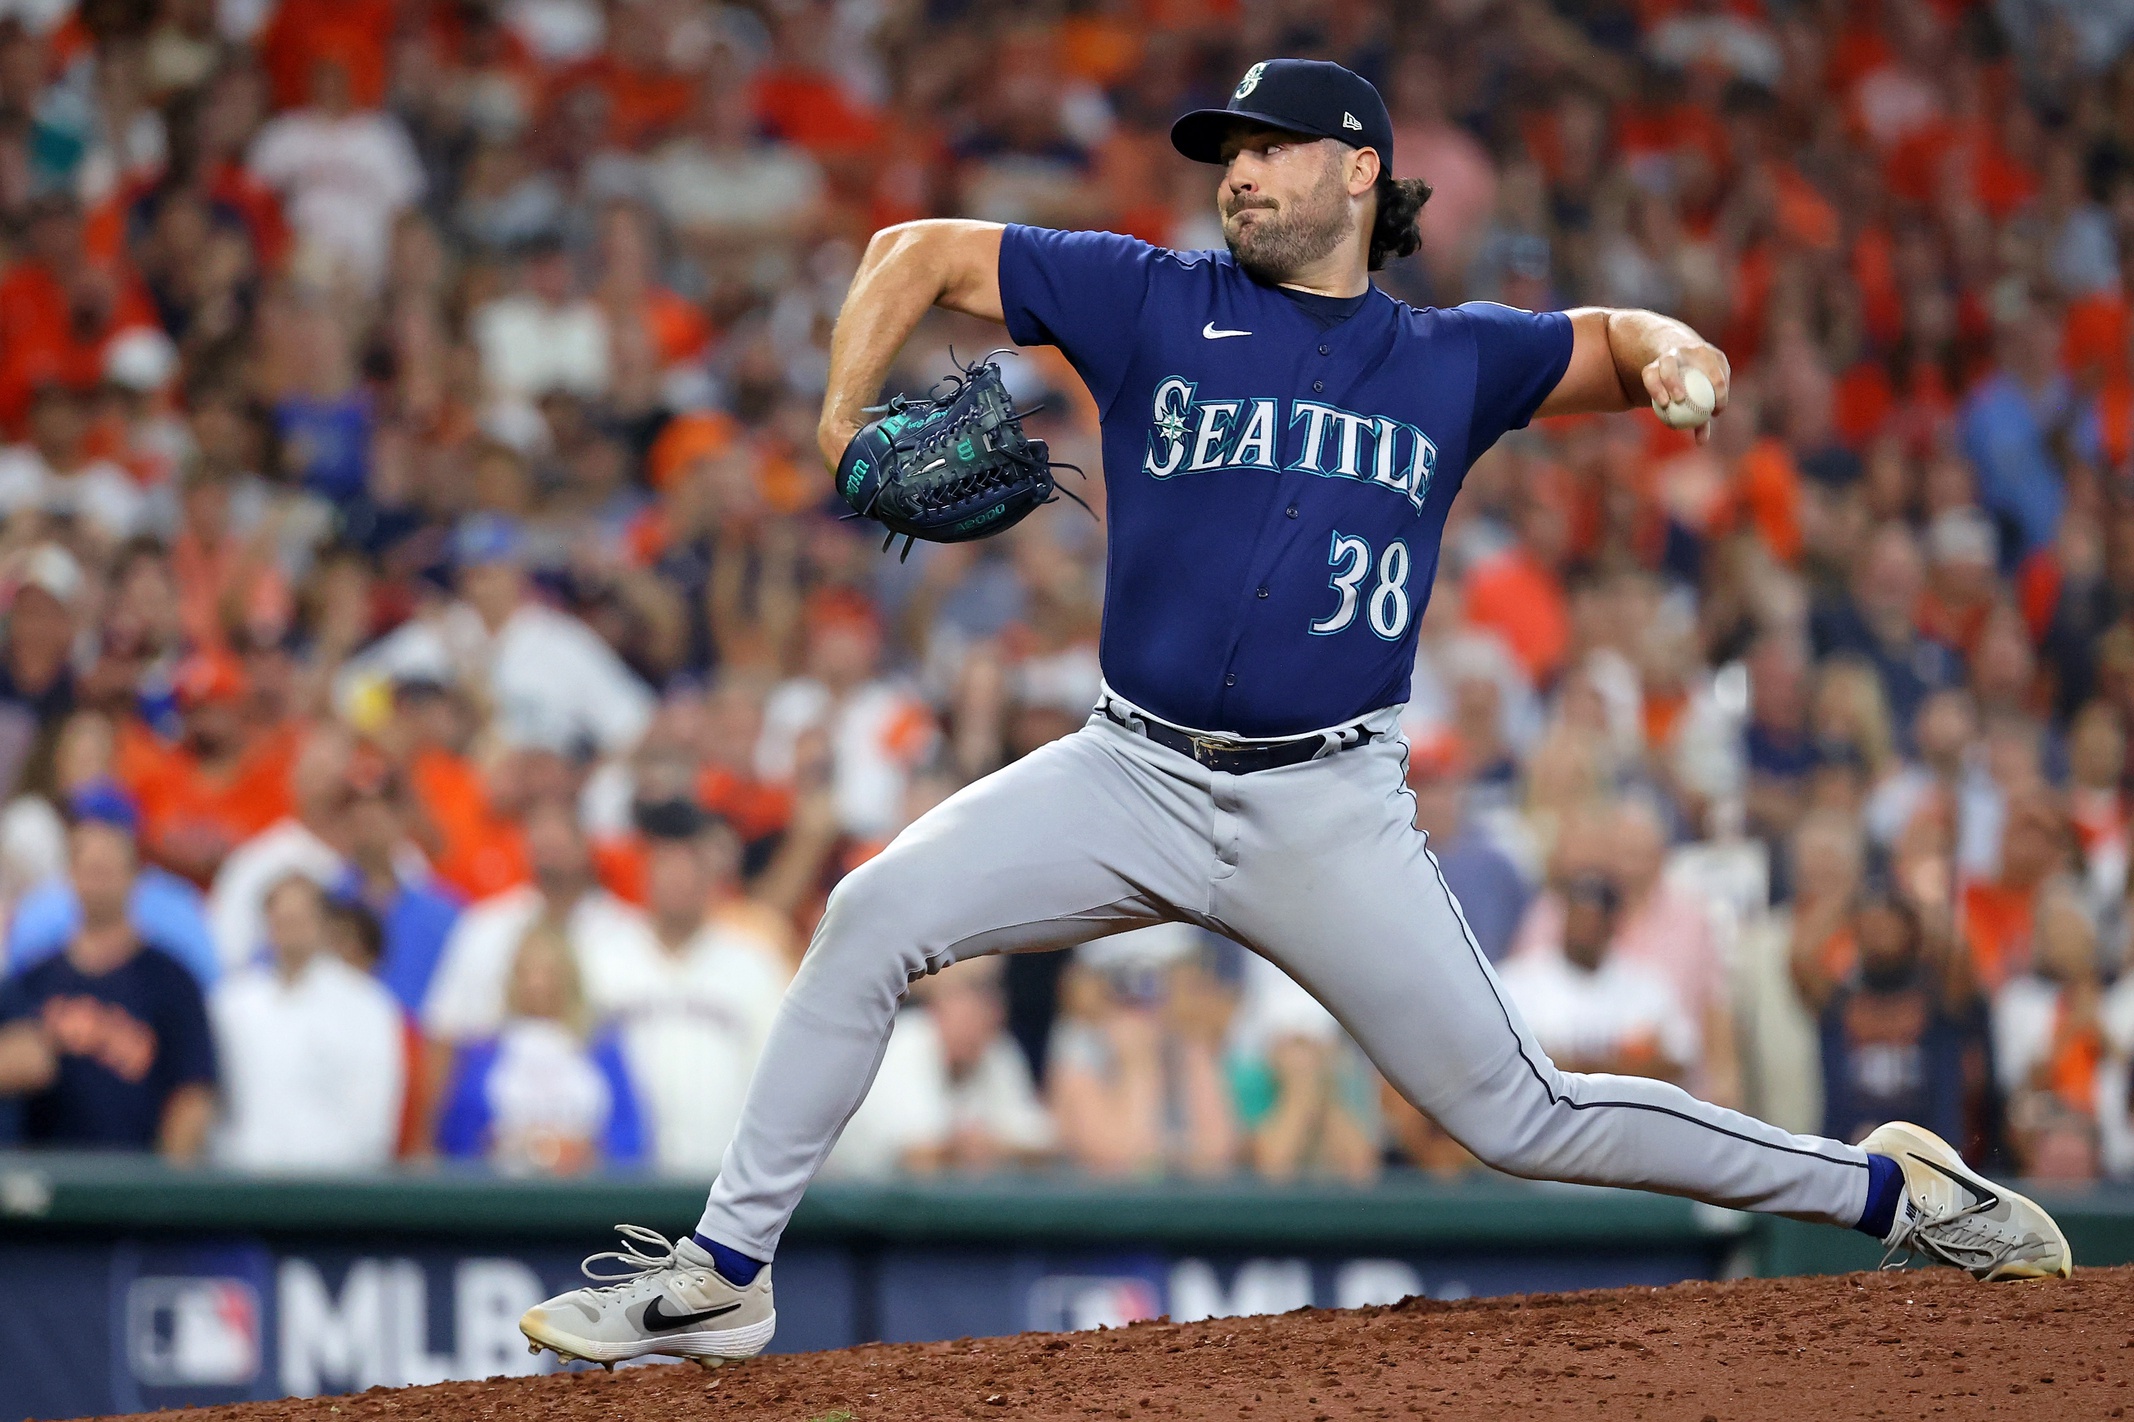
It has always been difficult for me to understand pitcher volatility. Well, the volatility part isn’t hard to understand, actually, it’s very simple. Pitching in the big leagues is incredibly difficult and one tiny little element of a pitcher’s game could be off to make the whole outing unravel. But, what is hard to understand is what little element that is. Did a 1 mph drop on a four-seamer really make it all go south? Or, was it a matter of half an inch of location? Is it even measurable? Like, what if it was just bad gas from the previous night’s chimichanga that threw things off? Do you see where I’m going? I want to know why a pitcher does so well one day and so poorly the next. For my first round of this, I’ll start slow and focus on only one pitch, narrowing the question down to, why does one pitch perform well one day and bad the next? In today’s investigation, I’ll analyze and compare Robbie Ray’s July 3rd 2.6 wSL Pval (Pitch Info) with his July 24th -3.4 wSL pVal. Let’s have some fun. Read the rest of this entry »
How would you define Jeff McNeil as a hitter in just a few words? If you had to place him in his own “group” of hitters, who else would you place him with? Last week, I used a cluster analysis to find a player that might compare to Luis Arraez and in turn, help provide some approach recommendations for increasing his power. This week, I’ll use that same cluster analysis, with just a few tweaks, to determine what combination of Statcast and plate discipline metrics increases roto value on average. Let’s start with a refresher on my process.
The 2022 American League batting title was won with .316. It was the lowest batting average to earn the award in the American League since Carl Yastrzemski hit .301 in 1968. Rod Carew earned the best AL batting average in 1972 with .318 and Tony Gwynn hit .313 in 1988 to earn the NL award. But typically, the batting title is awarded for a higher average. The average batting average of players winning the batting title in both the AL and NL over the past 50 seasons has been .345. Arraez’s .316 average was impressive, but it probably won’t benefit your fantasy team when quite enough when it brings only 8 home runs along with it.
Is there room for more power in Arraez’s approach? Don’t tinker with a good thing is what I immediately think, but then again, will .316 and probably slightly below (Arraez steamer 2022: avg .305), continue to top leaderboards? Furthermore, Arraez is up for arbitration prior to the 2023 season and won’t be a free agent until 2026. He has plenty of room to work for a few extra dollars in the power department. Shoot, he even said he wanted to add power himself when speaking with two of the most powerful in Giancarlo Stanton and Aaron Judge at the All-Star game (0:36):
So, what can he do? How can Luis Arraez add a little more power without changing who he is? I’m not a swing expert, but I did stay at a Holiday Inn last night and I know how to run a clustering model on high-dimensional data. But we’ll get to that in a minute.
Let’s start with who he is. First, he’s a man who does not strike out. He had the lowest K% at 7.1% among qualified hitters in 2022. He also never swings and misses. His 2.5% SwStr% was also the lowest among qualified hitters and lower than the new kid on the block Steven Kwan’s second place 3.1%. Second, he doesn’t steal bases. Four bags in 2022 and two bags in 2021 didn’t accentuate Arraez’s ability to get on base. Lastly, he doesn’t hit for power. His .104 ISO ranked 12th from the bottom among qualified hitters in 2022. From a fantasy perspective, Arraez is not necessarily a one-sided player, but he’s close. He got on base enough times to be driven in to score enough times and both his mR and mAVG returned positive value according to our auction calculator:
Luis Arraez, 2022 YTD Value
Name
PA
mAVG
mRBI
mR
mSB
mHR
PTS
aPOS
Dollars
Luis Arraez
603
$6.93
-$2.79
$3.07
-$1.53
-$3.61
$2.07
$9.51
$12.59
So where does this profile place him amongst his peers? Well, looking at a lot of columns in a spreadsheet can make it difficult to put a single label on a player. There’s just too much to sway your opinion. In order to combat this and help us create a more summarized view of many metrics, I’ll use a Principal Component Analysis (PCA) to “increas[e] the interpretability of data while preserving the maximum amount of information, and enabling the visualization of multidimensional data”. I created two sets of variables, one mostly batted ball, and plate discipline and the other Statcast metrics with a few non-Statcast metrics that more or less define power. Here they are:
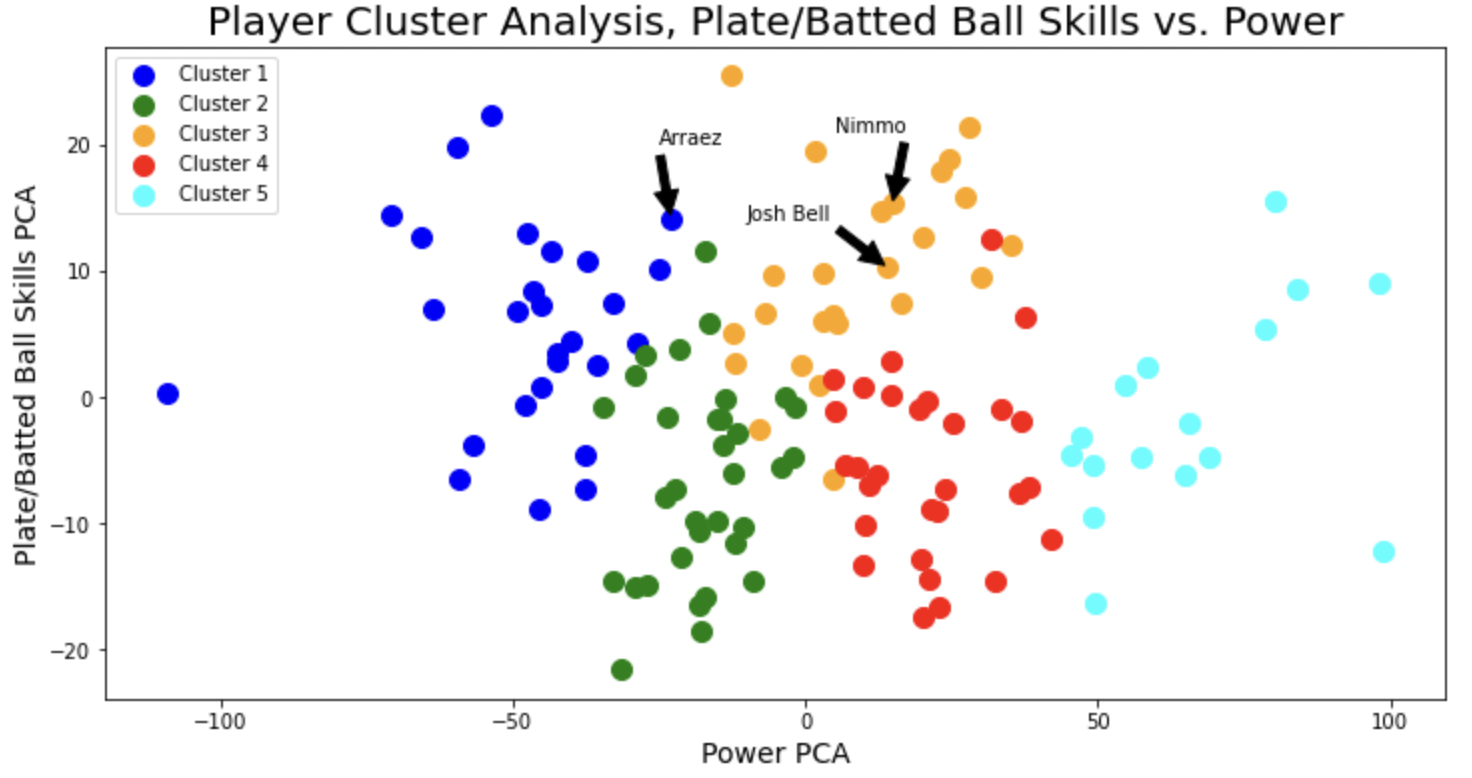
With a PCA I’m able to reduce these lists to two numbers which can then be passed through a k-means cluster analysis, grouping players into nice segments for visualization. Typically, a cluster analysis is used to gather insights on unlabeled data and it is a type of unsupervised learning. In this case, we’re using it to make comparisons we otherwise wouldn’t have:
Arraez finds himself, surprisingly, in the high-power end of cluster 1. To better understand why that is, we can compare his Statcast/power metrics with the averages from cluster 1. In addition, I’ll throw in that player all the way to the left, Tony Kemp, to help us compare Arraez with his cluster-mates:
Cluster 1 Metrics
Name
HR/FB
EV
maxEV
LA
Barrels
Barrel%
HardHit
SLG
xSLG
Tony Kemp
4.3
84.4
103.2
15.0
7
1.6
65
0.334
0.291
Luis Arraez
4.8
88.9
107.3
12.9
18
3.6
153
0.420
0.408
Cluster 1 Average
7.7
86.7
108.8
12.2
17
4.2
126
0.383
0.365
SOURCE: Statcast
Now we have a group for Arraez that makes sense. Next, let’s look at a few players who are higher up on the power scale, but aren’t changing too much in the batted ball/plate discipline area. Here’s our cluster image from before but with two new names identified that might be able to help Arraez inch over to the next cluster:
I am not saying that Luis Arraez should just go up there and try to be more like Josh. But I am using him as an example to determine what makes his profile more powerful. Josh Bell, 6′ 4″ / 255, and Luis Arraez, 5′ 10″ / 175, are different. While I don’t expect Luis Arraez to just suddenly increase his exit velocity, I am certain he has the skills to change his approach. One place to start would be adding more pull.
Shifting into Cluster 3
Name
LD%
GB%
FB%
Pull%
Cent%
Oppo%
Swing%
Contact%
SwStr%
Josh Bell
18.6
50.4
30.9
38.4
36.0
25.7
45.3
80.6
8.8
Brandon Nimmo
17.7
50.5
31.7
32.1
38.5
29.4
43.7
82.6
7.6
Luis Arraez
25.8
41.2
32.9
31.6
37.9
30.6
42.7
94.1
2.5
SOURCE: Statcast
Josh pulls the ball more. Josh also swings and misses more often. But while not swinging and missing is really impressive in this day and age, how valuable is it from both a fantasy perspective and a real-life perspective? Increasing his swinging-strike percentage while also increasing his slugging percentage would benefit everyone involved. Arraez is already hitting the ball with decent slugging results when it’s put inside, though he could improve on high-inside pitches, and all of his 2022 home runs came off pulled balls:
–
–
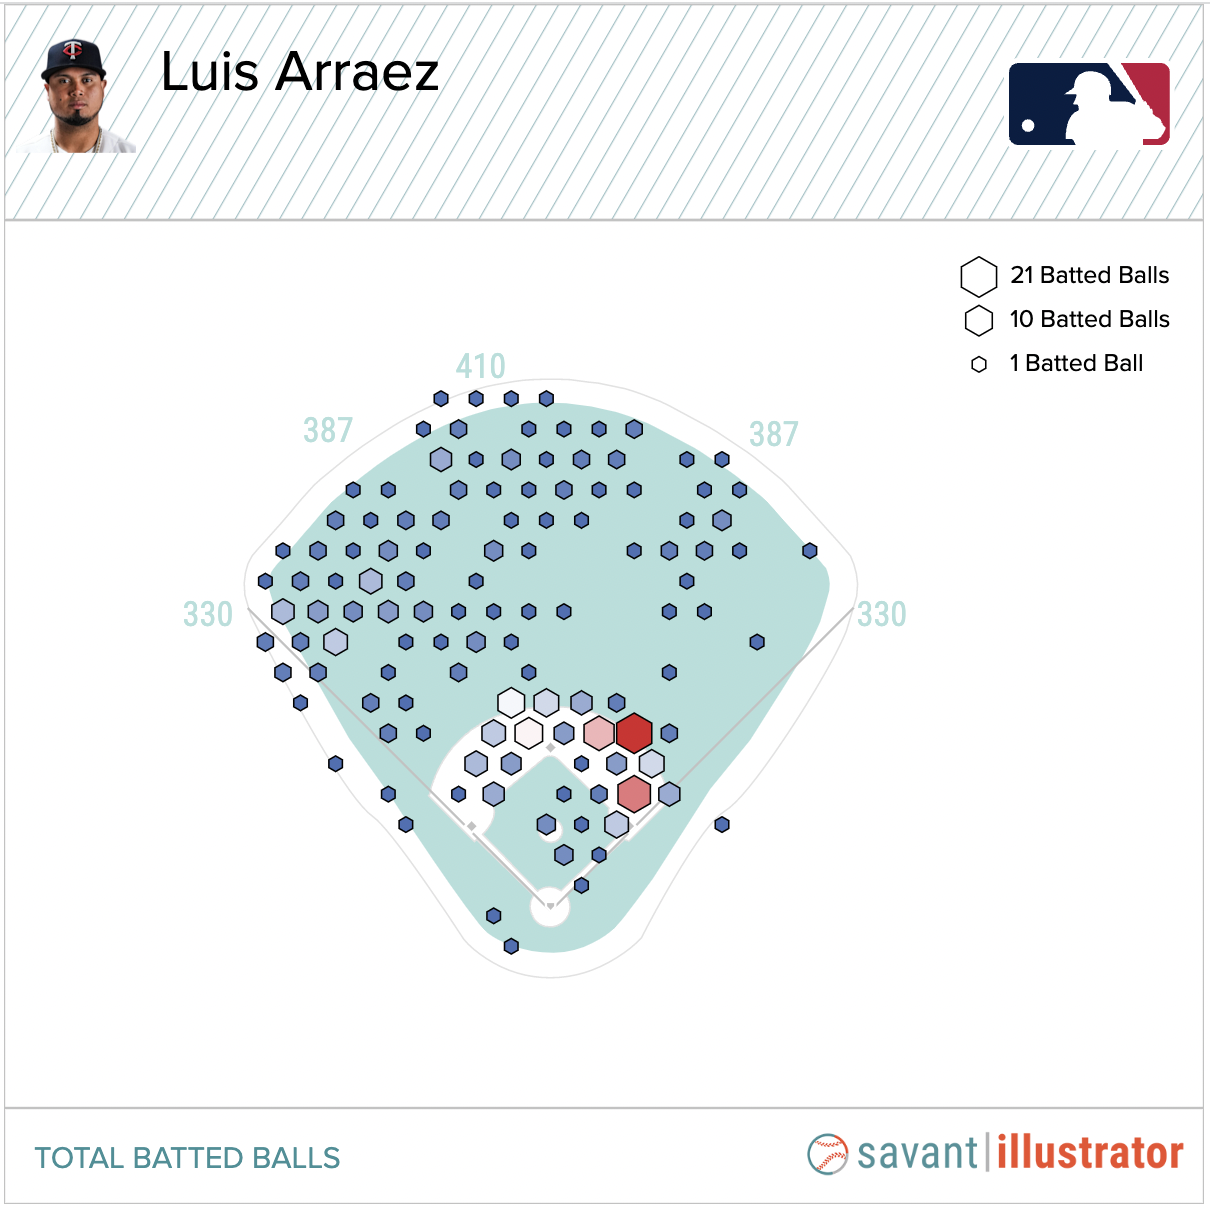
While watching a player who can spray the ball all over the field is fun, Arraez’s numbers aren’t great when going oppo. He slugged .638 when pulling the ball but when he slapped the ball the other way in 2022, he had mediocre results and his slugging percentage was brought down to .364. Just look at how many outs he hit into the opposite direction:
In 2022, Arraez’s HardHit% increased from 27.8% to 30.6% when he pulled the ball. When he was ahead in the count and pulled the ball, it jumped to 32.5%. Given a little more freedom from the worry of striking out, he added more power. But, here’s where things get a little odd. Arraez put the ball in the air more often than Bell and Nimmo in 2022 and his average launch angle was higher as well. If we look at his baseball savant radial chart isolated to singles, doubles and home runs (he only hit one triple in 2022), he clearly knows how to elevate the ball to hit for power:
But, without the exit velocity to take the ball out, he ends up with a lot of fly ball outs. Looking at the table above, he’s putting the ball in the air more often than Nimmo and Bell but with a significantly lower HR/FB rate.
Let’s summarize. Luis Arraez could be more valuable if he hit with a little more power. One way he might add power is to start pulling the ball more and leveling out his swing ever-so-slightly. This may cause him to swing and miss more often, but he can afford it. Arraez earned nearly $13 in 2022 and we should expect that to increase if he can adjust. It may seem nuts, but Luis Arraez needs to start swinging and missing more often.
I’m sure everyone has seen this graphic on Baseball Savant but if not, go take a look.
This may be the most trusted but misleading graphic used in (fantasy) baseball analysis. It was all over Twitter today with the Teoscar Hernández trade to show off his greatness. Read the rest of this entry »
It’s like Dottie said, “Lay off the high ones.” But, it ain’t so easy. Just ask Kit. I feel like I’ve been seeing more swings and misses on pitches up and out of the zone. Here’s an example, courtesy of Pitching Ninja: