Launch Angles, Release Points and Hit Predictability
Through games played on June 23rd, 2022, Luis Arraez held the highest batting average in the MLB at .349. He was just ahead of Paul Goldschmidt (.340), who was in the midst of putting together a career year, and Xander Bogaerts (.335), who was just being Xander Bogaerts. So, if you had chosen a player that you thought was most likely to get a hit the following day, June 24th, any of those three players would have been a safe bet. But, it’s just not that simple, is it? Goldschmidt played the next day but went 0-4. Arraez played and went 0-4. Bogaerts didn’t play. And that really is the challenge in trying to predict something like who will get a hit each day. That’s why there remains a $5.6 Million jackpot on the line.
I’ve written about my ventures in using analytics and a predictive model (Jolt) to help with daily batter hit predictions while playing in the Beat the Streak contest. You can learn more about the contest here, you can listen to a podcast about it during the season and you can sign up to the play game yourself! I won’t write much about the specifics of the contest, but it is the motivation for this research. The general idea is that you choose a player each day that you think will get a hit, if he does, you get a point, if he doesn’t, you go back down to zero. The goal is to reach 56. But, strip away the millions, strip away any contest or fantasy-style game, and what we’re left with is the question of how to best predict the next day’s hitters.
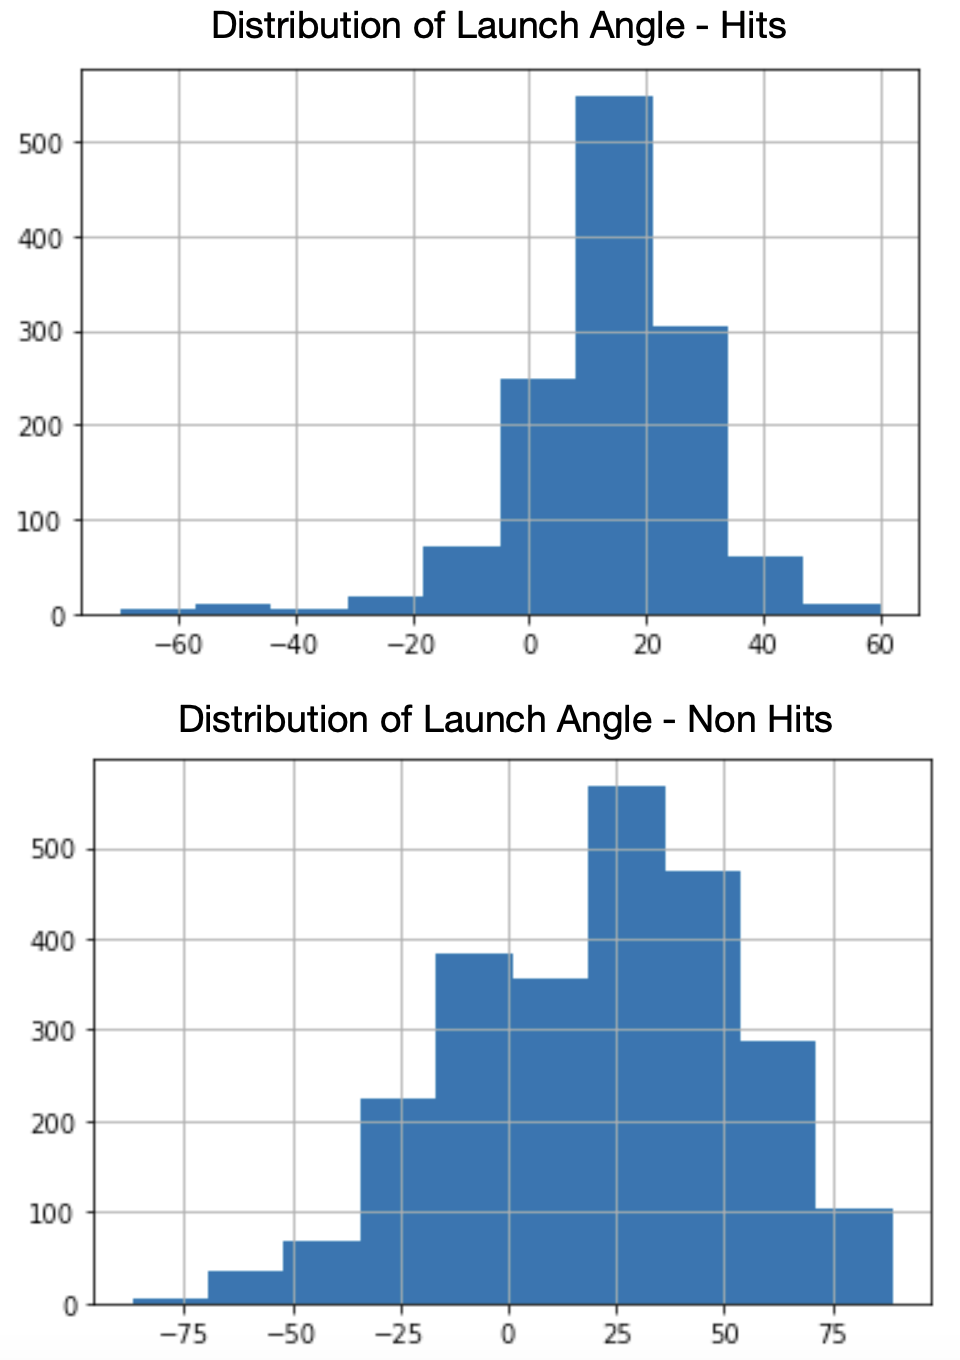
Jolt, the name of the model I’ve built to aid in making this prediction and a tribute to “Joltin” Joe DiMaggio, was built on the concept that the launch angle and launch speed of the hitter matter tremendously. Since we know that certain launch angles are more likely to lead to a hit and that balls hit hard also add to that likelihood, we can look for players who do that type of thing often. To show this in a visualization I randomly sampled a few days’ worth of savant batted ball data for each month of the 2022 season, sub-set that data down to only looking at batted balls from four-seam fastballs, and looked at the distribution of hits versus non-hits:

In this sample of data, batted balls (this does include home runs) ended in hits much more often with launch angles between, roughly, 10 and 20 degrees and that is something we have known for a while now. Balls launched at these angles have a much higher likelihood of being line drives and therefore, more difficult for fielders to get to. Let’s use this information and go back to June 24th. Through games played on the 23rd, there were eight hitters right in that solid average launch angle of 18 degrees bin. Here they are along with their up until that point batting average and June 24th results:
| Name | LA | AVG | 6/24/22 |
|---|---|---|---|
| Mike Yastrzemski | 18.8 | 0.250 | 1-4 |
| Will Smith | 18.8 | 0.256 | 2-5 |
| Justin Turner | 18.8 | 0.220 | 0-4 |
| Ha-Seong Kim | 18.8 | 0.226 | 1-3 |
| Christian Walker | 18.5 | 0.208 | 1-4 |
| Cedric Mullins II | 18.4 | 0.248 | 1-4 |
| Marcus Semien | 18.2 | 0.228 | 2-5 |
| Mookie Betts | 18.1 | 0.273 | 0-0 |
Yahtzee! Is it really that easy? Just pick the hitter who has been to the plate a lot and has a level, hit-falling average launch angle? You might think this is basically the same as selecting line-drive hitters, but it’s not. At least, those two measurements aren’t showing the same hitters. Only Will Smith found himself in both the group of players above and in the top 20 qualified hitters by line-drive percentage. The funniest part about this sample of hitters is that the hitter with the highest batting average, Mookie Betts, is one of only two players to not get a hit the following day. This is random of course. But, just for kicks, let’s do it with hitters who had been putting the ball on the ground (5 degrees) too much through June 23rd and look at how they did on the 24th:
| Name | LA | AVG | 6/24/22 |
|---|---|---|---|
| Yandy Díaz | 5.1 | 0.263 | 0-4 |
| Nicky Lopez | 5.1 | 0.217 | – |
| Vladimir Guerrero Jr. | 5.3 | 0.264 | 2-5 |
| Miguel Cabrera | 5.7 | 0.299 | 1-4 |
| Juan Soto | 5.8 | 0.214 | 1-4 |
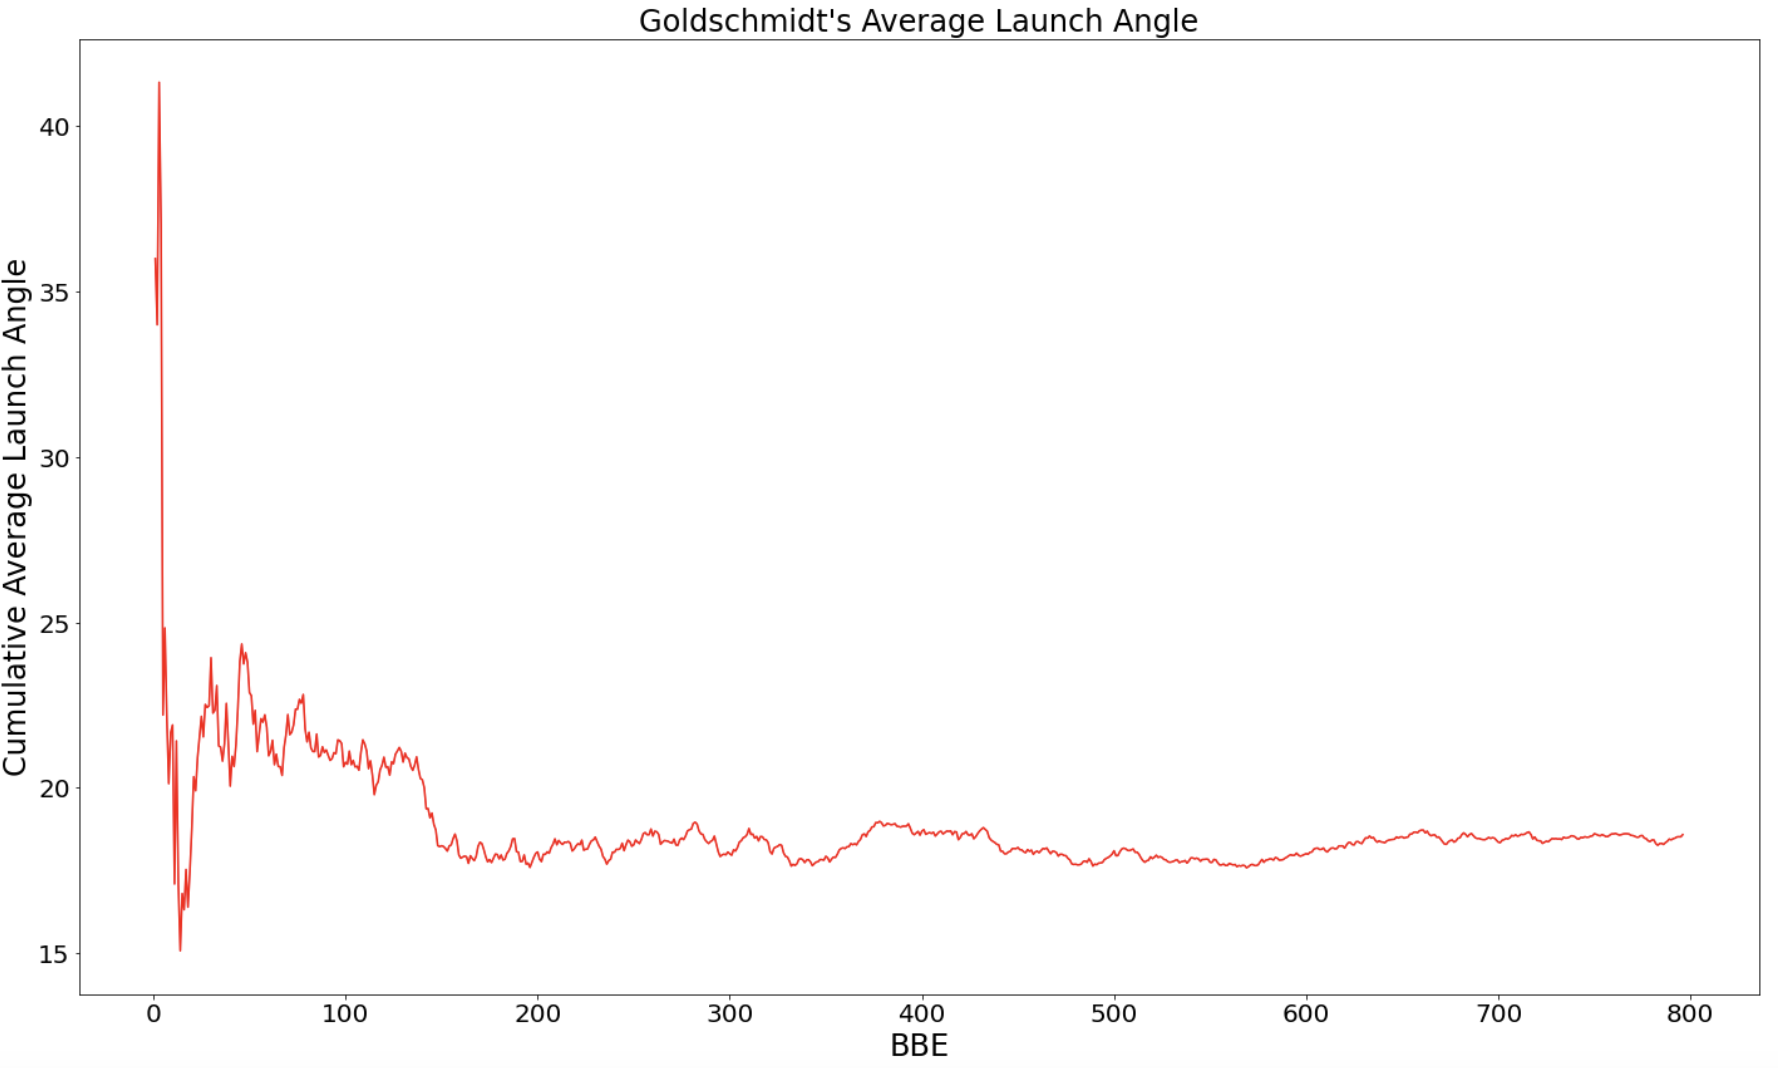
Ok, theory killed? Clearly you can see from the histograms that while a launch angle in the 10 to 20 range falls for a hit more often, there are a lot of other launch angles that fall for hits too. Those same launch angles don’t fall for hits as well. While finding players who have a tight launch angle, Alex Chamberlain style, would be a good strategy, you would likely find yourself choosing the same handful of hitters every day, thus limiting your player pool. Just look at Paul Goldschmidt’s 2022 cumulative average launch angle:

It becomes fairly stable around BBE number 200. Choosing Goldy every day would have been a good strategy in 2022, but for obvious reasons wouldn’t allow you to string together 56 consecutive hits and that’s the name of the game. It would also fail to take into consideration who was throwing the ball, which is arguably 50% (but probably more) of the equation. Jolt’s first iteration sought to find players with good launch angles matching good release points. The thinking was that high release points translate to higher approach angles and that uppercut swings bring the bat through the zone on those particular pitches longer. It’s not a new concept in baseball. Ted Williams’ 1986 book, The Science of Hitting, detailed some of this thinking.
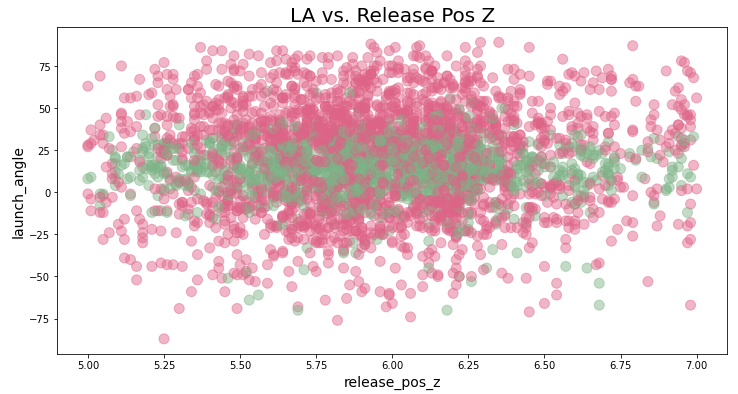
It was even backed up by the model’s validation. Jolt, iteration one, found ‘release_pos_z’, or the “vertical release position of the ball measured in feet from the catcher’s perspective” according to baseball savant, as the fifth most important variable in predicting a hit out of all of statcast’s outputs. Unfortunately, this is much, much more descriptive than it is predictive. A trained model will say that the launch angle of a batted ball and the release point of the pitch help “predict” whether the ball falls for a hit or not. While a release point, especially if you isolate to single pitch like just a fastball, can be predicted, you can’t really predict at which angle the ball will be hit before the batter swings. Here’s an example:

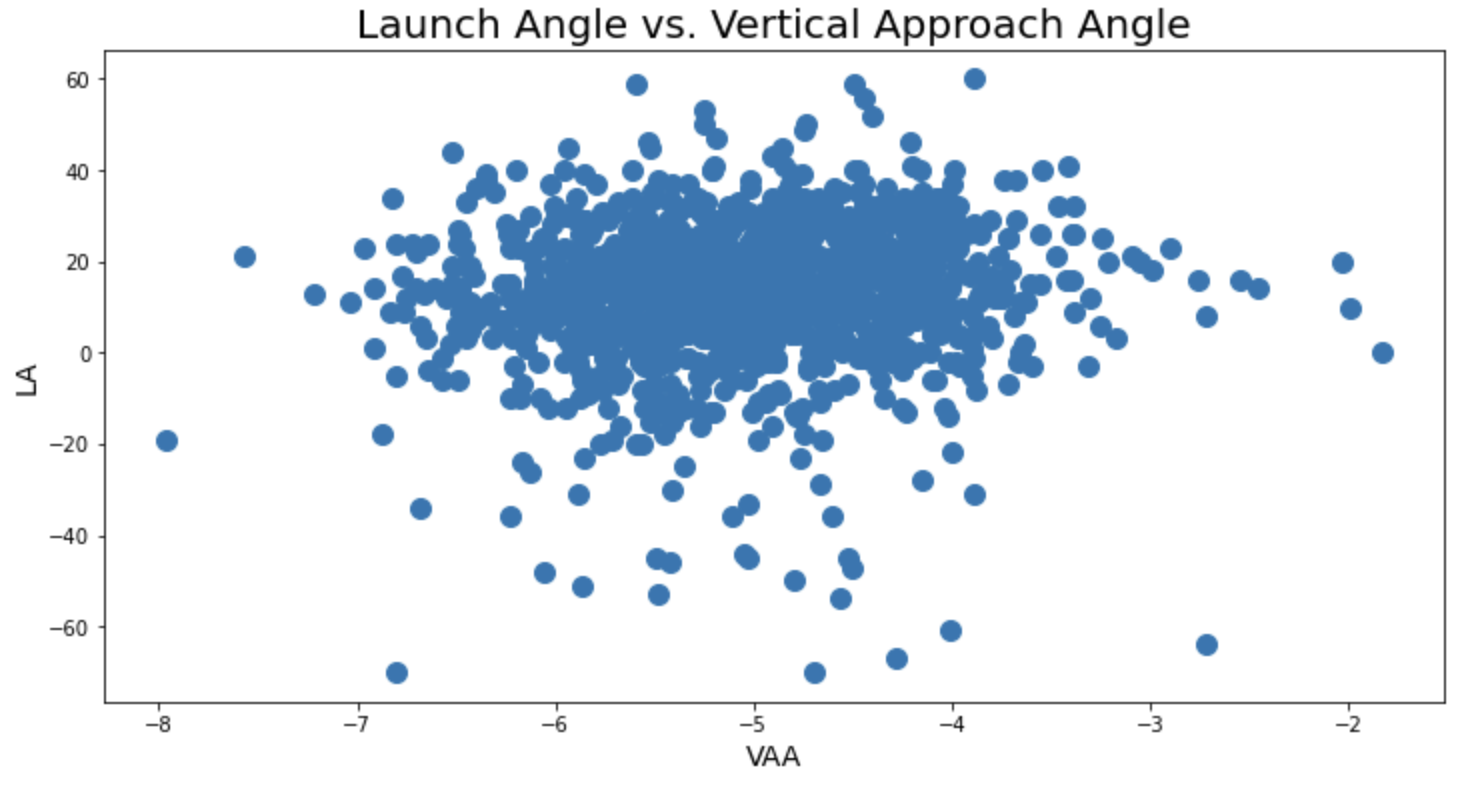
In this image, green represents hits in the data and red represents non-hits. The green band going across the chart tells us just how important the launch angle is, but it doesn’t have a relationship with the release point of the pitch. Any of these release points can match up with any of these launch angles and fall for a hit. It is uncommon for any launch angle above ~70 degrees to fall for a hit, but there may be a few outliers in there. Regardless, matching up a pitcher’s release point with a batter’s launch angle doesn’t seem to provide much detail when analyzing this data. Most of us would completely disagree with the data in this case, but it doesn’t mean that hitters are actively upper-cut swinging on high-released fastballs because I would imagine, that’s friggin’ impossible to do. But maybe it naturally happens? Maybe looking at it from a vertical approach angle (VAA), the angle of the ball as it crosses into the zone, is the better…um…approach? Let’s see:

This graph would tell you that besides the outliers, all VAAs can be hit with all LAs. Again, there is a HUGE discrepency between what we computer baseball nerds see and read and think and what a hitter actually does. If there are any hitters out there who know that tomorrow’s starting pitcher has a very steep vertical approach angle, are they altering their swing or approach to match it? Um…I’ll guess…no. It’s hard enough for them to decide to swing or take. But there must be somethign I’m missing. The launch angle in which a ball that falls for a hit is struck may not necessarily relate to how high the pitcher is releasing the ball, but certainly, some swing types are better against those pitches than others. But what is measuring that? What is measuring the actual swing? There have been some attempts made like the data collected by Swing Graphs, but nothing that I’ve seen is freely available to the public.
A model, whether it has a good R-squared, average-squared error, misclassification rate, or get-a-lot-of-likes-on-twitter rate, doesn’t do a good job of telling us whether a certain launch angle will be more successful against a certain vertical approach angle because it’s just too random and there’s too much noise. It’s also too difficult to create that data before it happens in order to make predictions on it. But, Jolt simply won’t quit. Iterations continue and there remains work to be done to better model tomorrow’s hit likelihood. In fact, MLB does it for its Beat the Streak app. But, no one has found success in just picking the top-recommended hitter each day, have they? Of course, I’m not implying that a model will be the only way to win this contest, in fact, I don’t think one single person will ever be able to win this contest. However, sometimes a simple model coupled with logical thinking and sound judgment is best. Jolt’s next attempt will focus on that. Just look at the table of June 24th’s outcomes at the top of this page and you’ll see, there’s something to just choosing who is hot each day and who works well against the guy standing on the mound.

Wow…now I am convinced of my lack of comprehension… okay, I tried to follow. Interesting, very. If I am nit mistaken your 6-23 data was back to beginning of year. Is that correct? Changes are made all the time, what if you ran then#’s say 10 days in front of 6-23. It is more current and perhaps more relevant to 6-24. I would think some guys are getting to that idea launch angle while others may be trailing dorm how they began year. Make sense? Use your same hitters and tell me what their #’s were in their maybe 30-40 at bats before 6-23.,