Ottoneu Drip: Finding Under-rostered Pitchers: August 29, 2025
The search for pitching help is never ending. Between injuries and ineffectiveness, fantasy players are always on the lookout for pitchers who are performing well who can provide some reinforcements. If you’re in an Ottoneu head-to-head league, the playoffs begin on Monday. Here are five starters who are rostered in less than 60% of all Ottoneu leagues who might be a benefit to your first-round playoff matchup.
| Player | Team | IP | FIP | K-BB% | Stuff+ | Pts/IP | Roster% |
|---|---|---|---|---|---|---|---|
| Justin Verlander | SFG | 32.1 | 2.38 | 20.0% | 112 | 5.28 | 50.46% |
| Luis Morales | ATH | 22.2 | 3.08 | 13.6% | 106 | 6.07 | 43.12% |
| Ian Seymour | TBR | 18.2 | 3.39 | 27.4% | 94 | 5.53 | 30.28% |
| Joey Wentz | ATL | 33.1 | 3.18 | 8.8% | 93 | 5.16 | 19.57% |
| Martín Pérez | CHW | 15.2 | 1.91 | 21.1% | 86 | 7.45 | 11.32% |
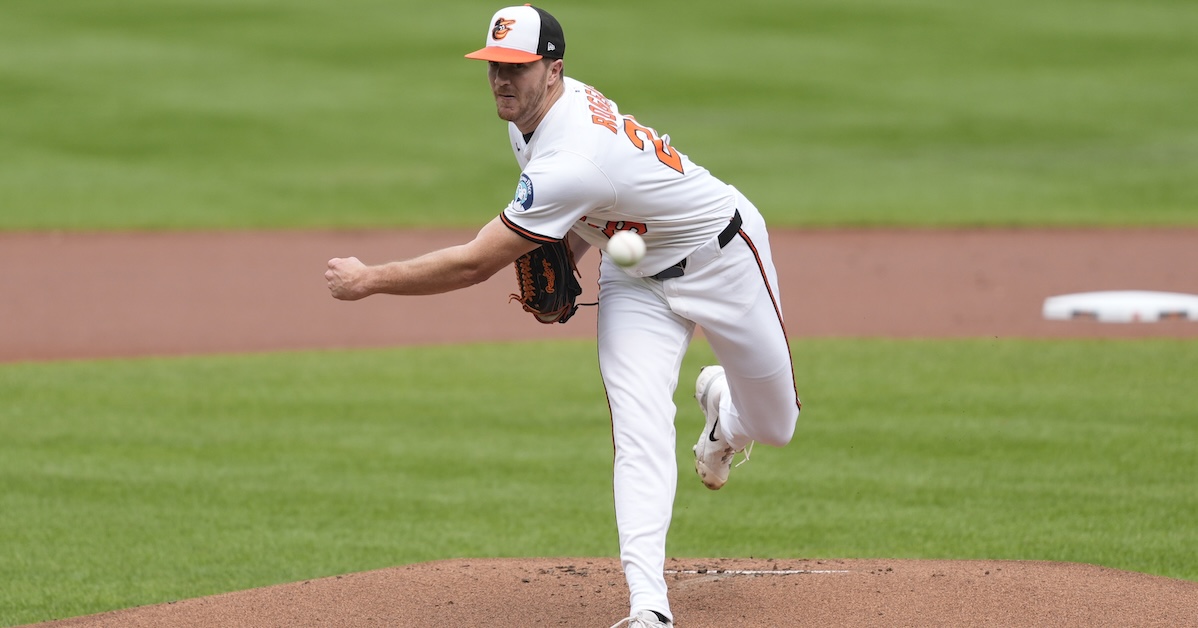
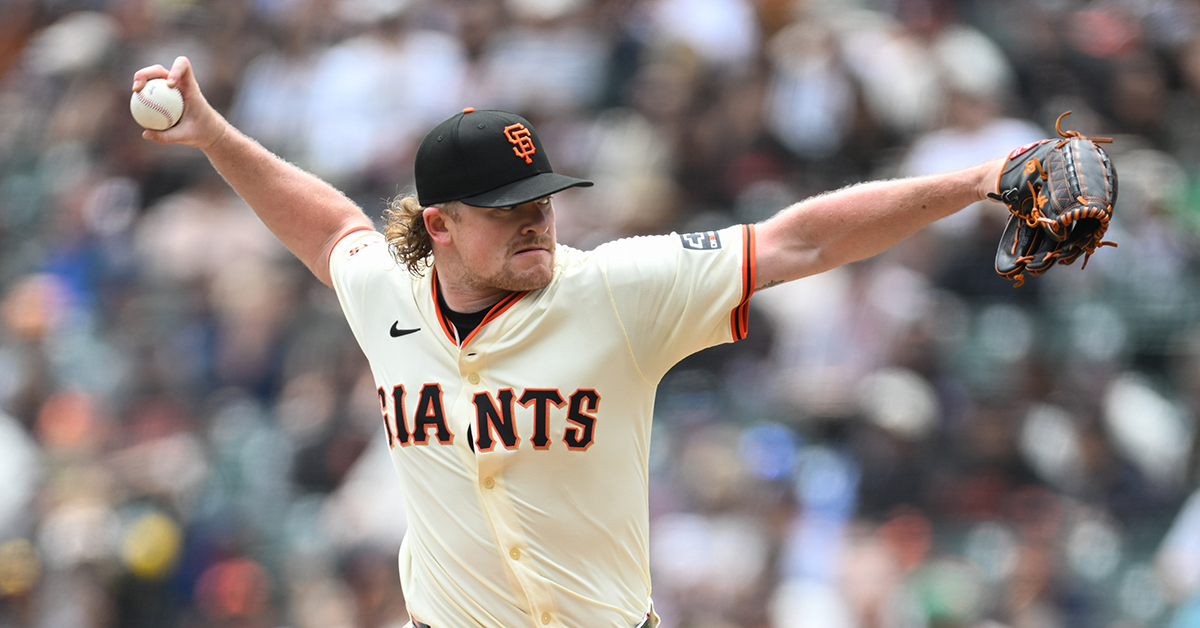
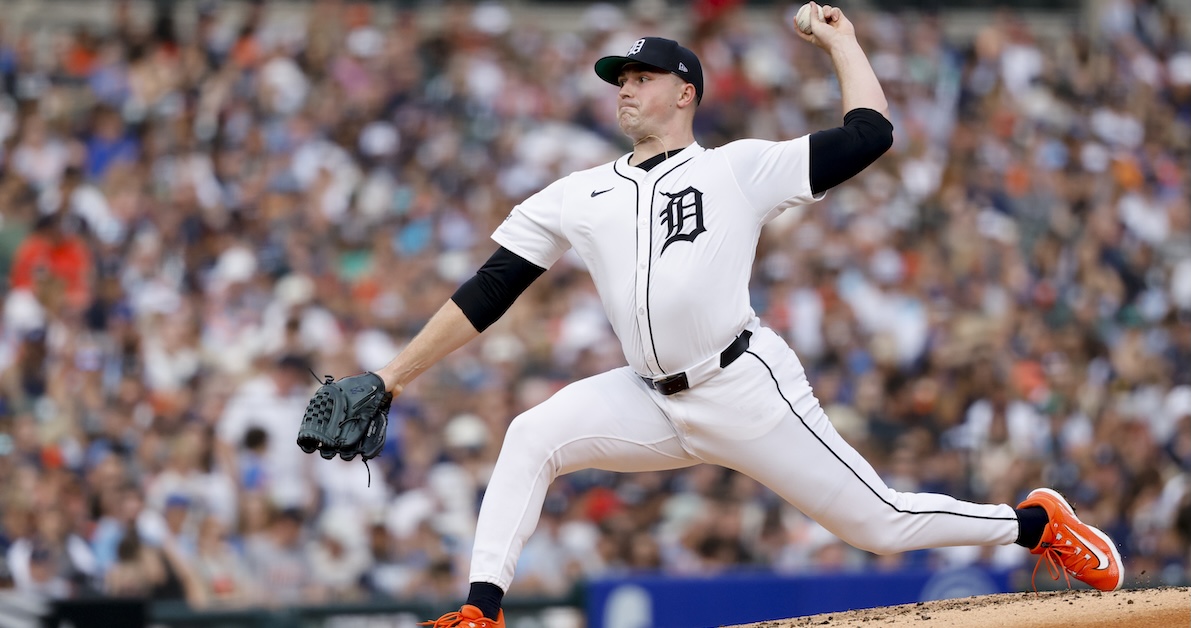
This isn’t the same Justin Verlander who could carry a fantasy pitching staff for much of his career, but don’t be so quick to write off the seemingly ageless veteran. Since the All-Star break, he has a 3.05 FIP thanks to a miniscule home run rate and a pretty good strikeout-to-walk ratio. His ERA during this same period is more than a run higher than his peripherals would indicate, but because Ottoneu uses FIP-based scoring, it’s actually okay that he’s allowing a few more runs than expected, as long as he’s also preventing home runs too. Next week, he avoids the Giants’ series in Colorado and has a nice matchup against the punchless Cardinals in the pitcher-friendly ballpark in St. Louis.
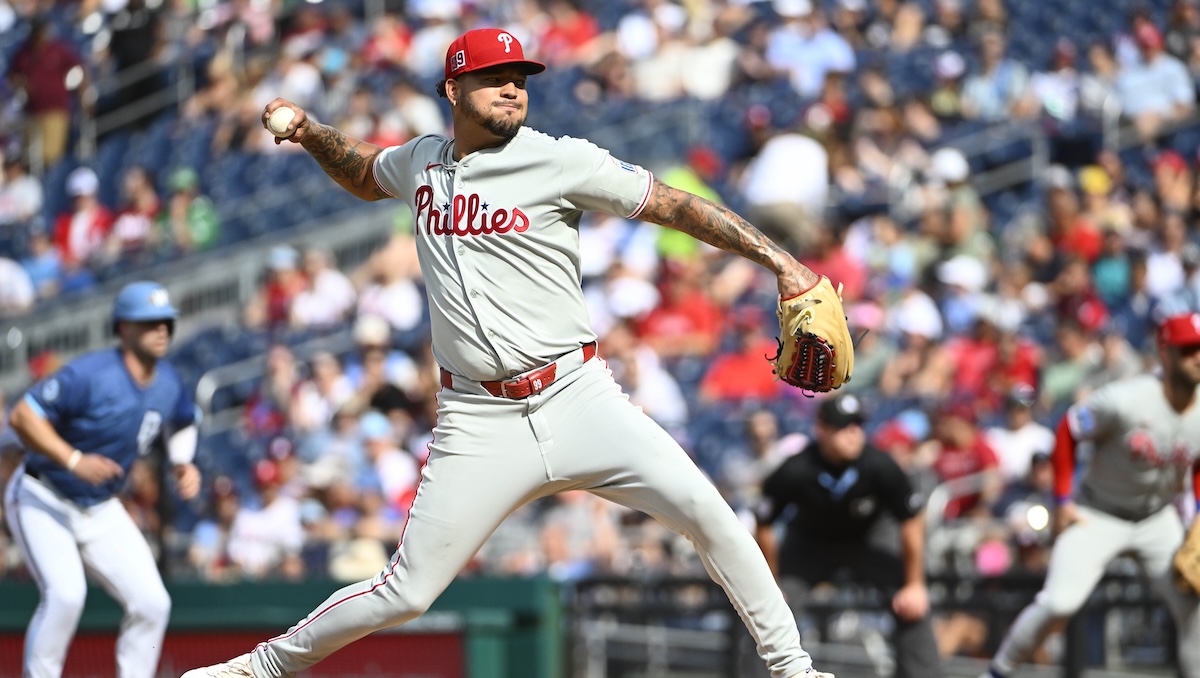
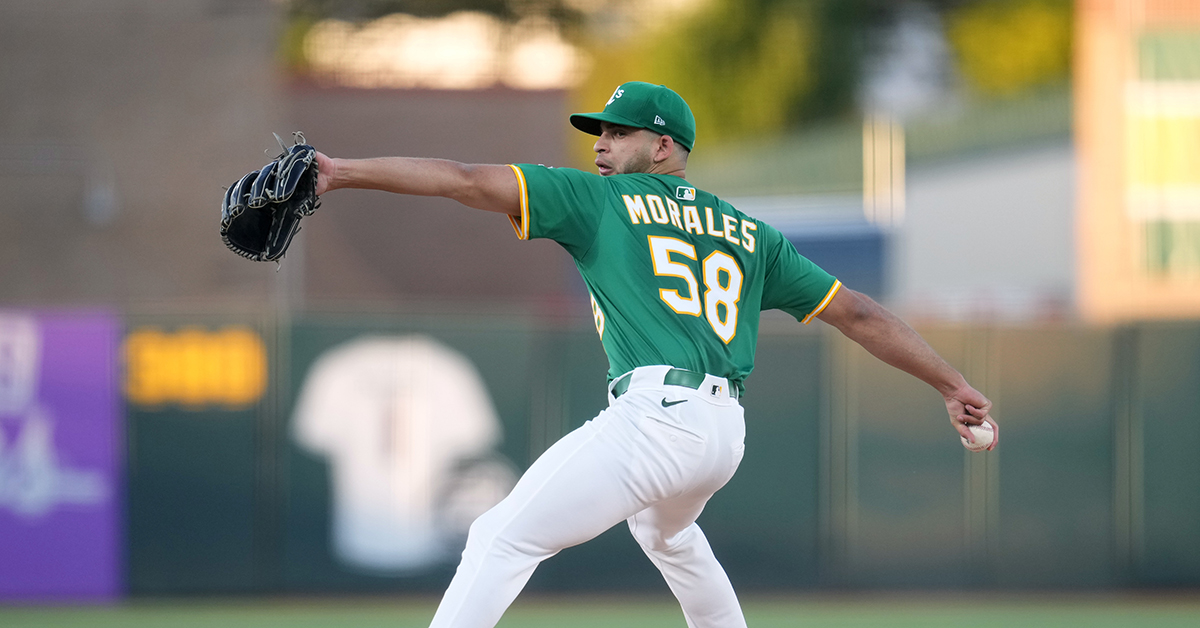
Luis Morales has very quickly established himself in the big leagues after making his debut on August 1. He entered the season as the A’s top pitching prospect, though he’s pretty raw at this stage of his development. He only signed as an international amateur out of Cuba in January 2023 and had an absolutely meteoric rise through the Athletics’ farm system. He’s looked pretty dominant in the majors already; in his last three starts, he’s allowed just two runs total while striking out 18 in 18 innings. He’s got the skills and stuff to be a frontline pitcher for the A’s as he continues to develop. Next week is a nice two-start week against two pretty weak teams (@STL and @LAA) away from the launching pad in Sacramento.
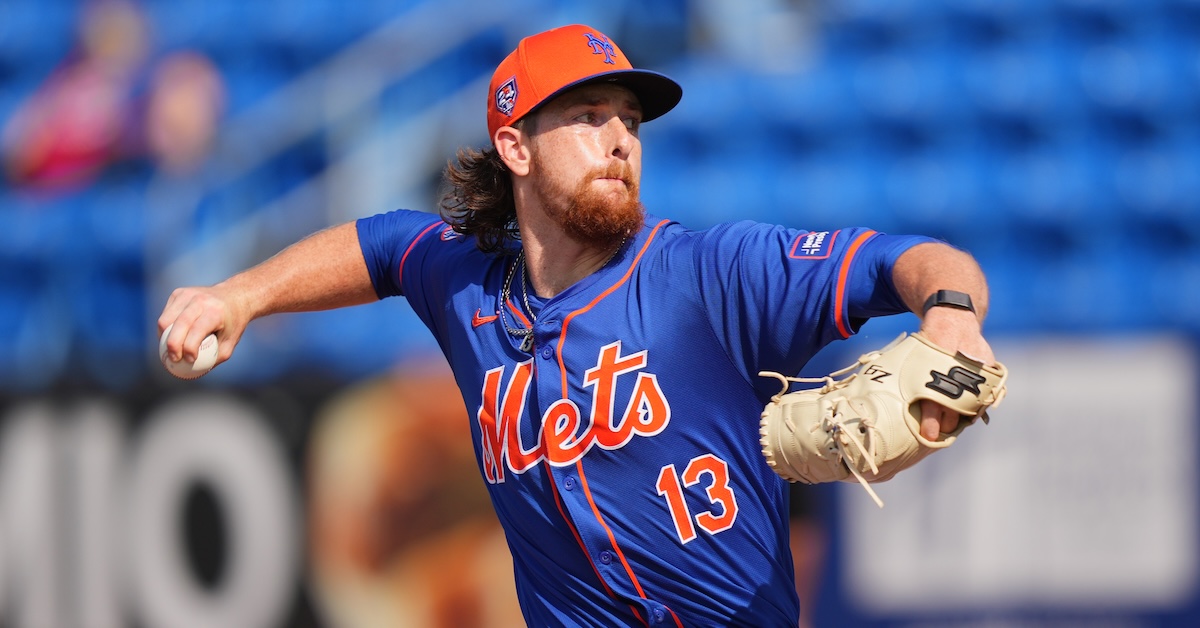
Ian Seymour only recently made the jump to the starting rotation after making 12 appearances out of the Rays bullpen. Lucas Kelly featured him in his Hot Right Now column yesterday, writing:
Much of [Seymour’s] success can be attributed to his changeup. Its 16.0% swinging strike rate has been above average when compared to pitchers who have thrown at least 150 of them this season. With a small sample, Seymour’s fastball is performing better than you might expect, holding an 11.9% swinging strike rate. The pitch has a below-average Stuff+, Location+, and averages 92 MPH.
Some pretty violent mechanics led to some scouting reservations and put a cap on his potential ceiling as a prospect. His one start was excellent — a shutout affair with eight strikeouts in five innings — granted, it came against the Guardians who are the worst hitting team in baseball. Still, he’s lined up to face Cleveland again in his start next week.
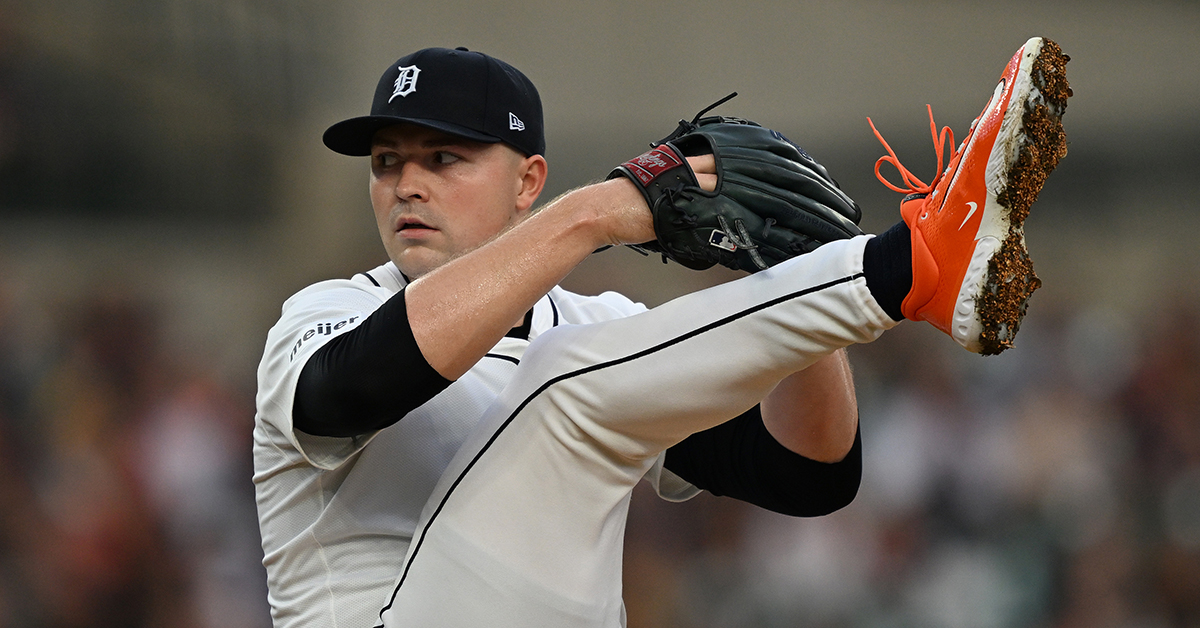
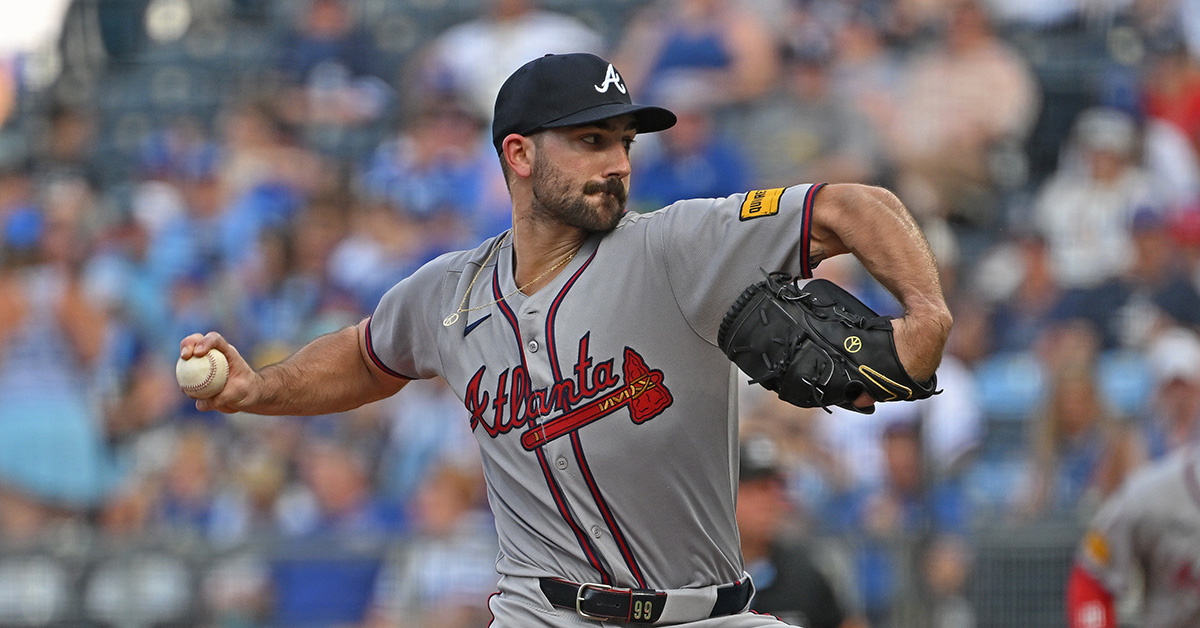
After struggling to establish himself in Detroit to start his career, Joey Wentz has finally found some success in Atlanta, his third organization this year. While the results have been nice (3.43 ERA with the Braves), his peripherals paint a different picture. His FIP in Atlanta is a sparkling 3.03 but that’s almost entirely propped up by a miniscule 4.3% HR/FB rate. His strikeout-to-walk ratio is pretty mediocre and he’s dealt with some command issues in his recent past. You might be able to get away with a good start or two if his home run luck holds, but the foundation doesn’t look very solid.
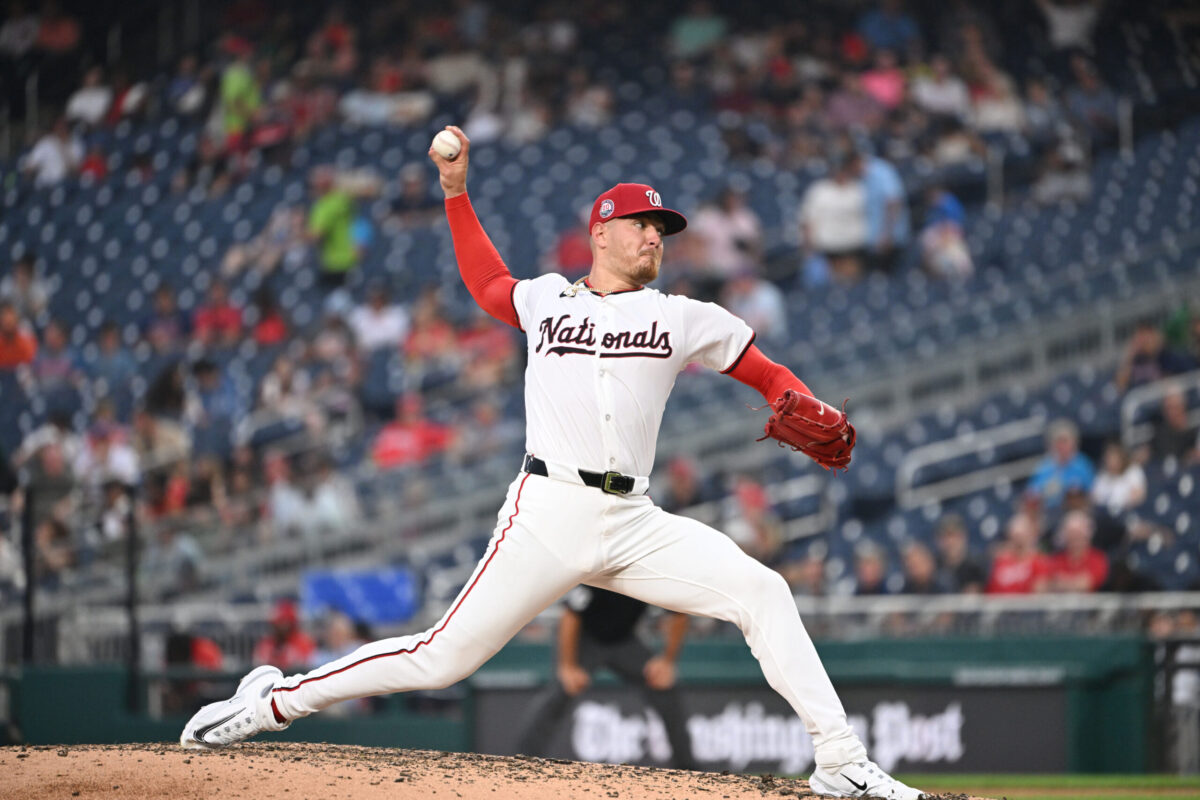
Martín Pérez also got a passing mention in Kelly’s column yesterday, but I wanted to highlight him here too because he’s actually been surprisingly good for the White Sox this year. He’s running the highest strikeout rate of his career at 22.9% and the biggest difference is an emphasis on his cutter as his primary pitch rather than his sinker. His changeup has continued to be an elite weapon, but that pitch mix change has earned him a lot more whiffs than before. The big red flag is that his contact management peripherals all scream for some regression. He’s allowed a 12.9% barrel rate but just one home run this year and his xERA, xFIP, and SIERA are all more than a full run higher than his FIP. His start against the Yankees on Sunday might help you determine if you’d want to stream him next week for his start against the Tigers in Detroit.

