Archive for Spring Training Notes

Just A Spring Fling? Take Caution Before Falling In Love With These Spring Time Mashers

Kim Klement Neitzel-USA TODAY Sports

There are a few players who are showing off this spring. First, the Orioles need to make room for Colton Cowser. This dude is slashing .478/.586/1.000 with four home runs and a spring training leading (qualified hitters) wRC+ of 307. How about Miguel Andujar? He has also hit four home runs and has 13 hits in 32 at-bats, good for a .406 batting average. Unlike most of the hitters who have high batting averages this spring, Oneil Cruz has a very low BABIP, .182. That, compared to Cowser’s .583 BABIP is night and day different. Yet, Cruz is still hitting for a very impressive slash line of .300/.440/.900.

Read the rest of this entry »


Taking Spring Training a Little too Seriously: Hitter Edition

This article looks at the predictive power of spring training statistics last year for hitters. It applies learnings from last year to highlight a few movers and shakers so far this spring (based on spring games through 3/13).

Read the rest of this entry »


Notes From A Spring Training Weekend: Orioles/Yankees

The terminals at Baltimore-Washington International, BWI, were packed with Orioles fans excited to escape the last grip of Maryland’s cold winter weather, heading to Florida for live baseball once again. The unusual sight of sandals and sun hats standing in lines to get on planes can be off-putting, yet invigorating. Spring Training brings that little bit of hope to baseball fans that summer will actually come again, hard as it may be to believe.

“Are you going to the game tomorrow?”, asked a short older woman as I climbed over her to get to what seemed like the last seat on the plane.

“Yea, I’m going Saturday and Sunday.” This statement was greeted with a quick sideways look followed by a “good for you” sort of expression.

“We’re only going tomorrow. I’m so excited! I can’t wait to see that Jackson Holliday!”

My nice neighbor would have to join me at the game on Sunday if she wanted to see Baltimore’s golden boy, as he was given the day off on Saturday against the Yankees.

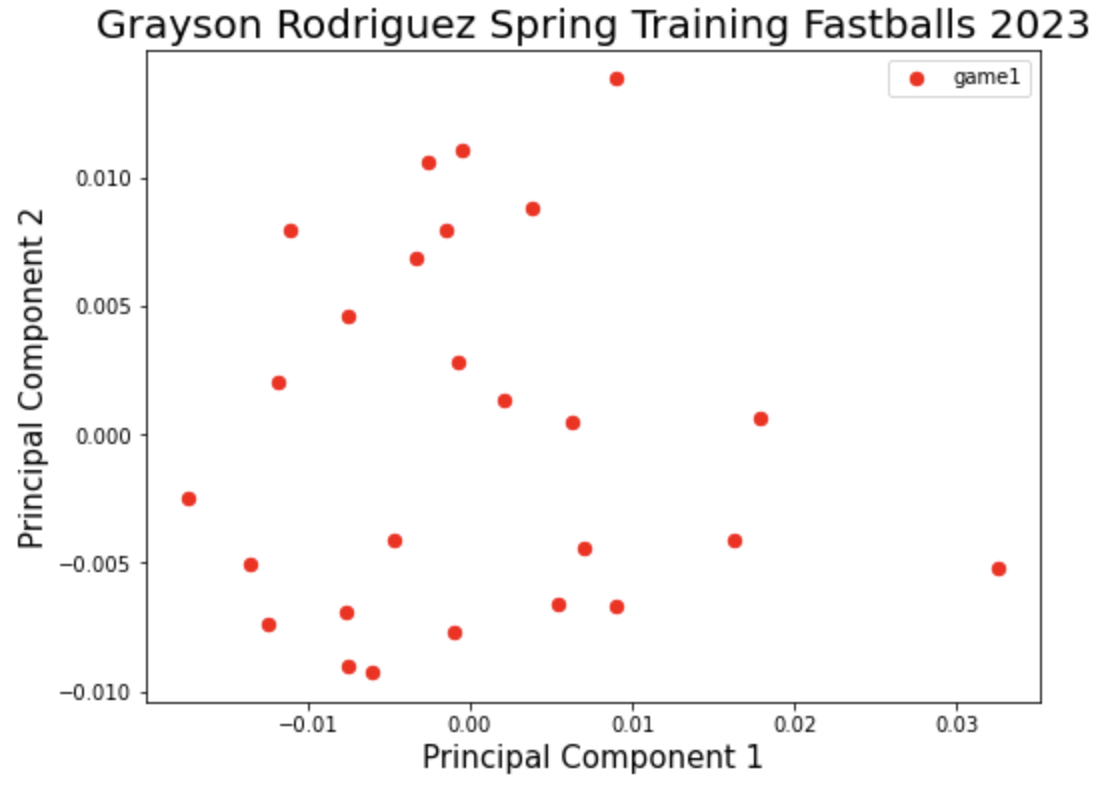
Cole Irvin would take the bump for the O’s and Marcus Stroman for the Yankees at Ed Smith Stadium on Saturday, March 2nd. Irvin was coming off an impressive first start where he threw two innings and faced only six batters. It was reported that his velocity was up:

It was a good sign from the lefty who is fighting for a roster spot, though a setback to John Means‘ recovery from Tommy John surgery and a possibly detrimental injury to Kyle Bradish’s elbow has given Irvin a better chance. The pop of the catcher’s mitt from the bullpen as Irvin warmed up seemed to have a little something extra this spring. Then again, it could have been the months without the sound that made it extra crisp.

The first pitch Irvin threw was to Yankee shortstop Anthony Volpe and he swung away, lining a sharp single into right-center field. The Yankees are hoping Volpe will be able to get on base more often in 2024 as he struggled to do so with a .209/.283/.383 line in his rookie season. It seems that the reported tweaks he’s made to his swing are already showing some improvement.

As he stood on first base, the more attuned fans in attendance wondered out loud if Volpe, who stole 24 bases in 2023, would pick up where he left off and take second. He danced and shuffled off first base enough to make Irvin consider a throw over. Perhaps the goading worked to Volpe’s advantage and, to some extent, Alex Verdugo’s, as Irvin missed inside and hit Verdugo placing runners on first and second. Irvin was able to get out of the inning without a run-scoring. He finished the game having thrown three innings, giving up three hits, a walk, and no runs. There’s certainly room in the O’s starting rotation and even more so for a left-handed pitcher. But Julio Teheran came in after Irvin and threw one solid inning with a strike-out, so there’s still a competition happening in the O’s camp.

Here are the fringe Orioles starters and their ratio projections:

Orioles Fringe Starter Projections
Name G GS IP K/9 BB/9 ERA K/BB HR/9
Tyler Wells 38 11 88 8.4 2.7 4.3 3.1 1.5
Cole Irvin 34 8 75 6.9 2.0 4.4 3.4 1.3
Julio Teheran 8 8 43 6.5 2.6 4.9 2.5 1.6
Projected by ATC

It seems most likely that Teheran will make the team as a long-reliever in the bullpen. Otherwise, the O’s pen showed promising signs from Dillon Tate, the 29-year-old righty who missed all of 2023 with an arm injury, and Nick Vespi, the 28-year-old lefty. Both relievers threw one inning, struck out one, and kept the Yankees off the bases. Though he did not come into the game, I could see last year’s breakout reliever Yennier Cano working out on an Orioles backfield. Cano has some fantasy promise in a season where the O’s will be without Félix Bautista (Tommy John) and while Craig Kimbrel is certainly a lock to be the closer, Cano is the next man up. One more notable appearance came from the 27-year-old Wandisson Charles. Back when he was a prospect with the Oakland Athletics, Eric Longenhagen and Kevin Goldstein wrote about Charles:

[S]itting in the 95-98 range with his fastball. He still lacks consistent feel for location and a good secondary pitch, but his sheer arm strength merits inclusion [on this prospect list].

The part about his “physical presence [resembling] that of an NFL edge rusher” certainly rang true, as did the part about his lack of control. Charles threw one inning gave up a hit, walked a batter, and struck out a batter.

On the offensive side of seven Orioles runs came the following notes:

Kyle Stowers hit a shallow home run to right field in his only at-bat in the game. Stowers is one of the many Orioles who should now be getting consistent major league playing time, yet is blocked by established outfielders. This is a good thing for the Orioles, a bad thing for players who want to play but are blocked, and an even worse thing for fantasy players who want their keepers to accumulate stats. Ok, maybe it’s more frustrating for the actual players. Stowers dealt with an injury early in the season in 2023 but ended the year with a AAA slash line of .245/.364/.511 in 233 plate appearances. The 30 plate appearances he earned at the big league level in 2023 garnered a dismissible .067/.152/.067.

Coby Mayo went hitless in three at-bats. He is certainly an imposing figure at third base and should be given, at least, a cup of coffee this season. He, like Stowers, has certainly outgrown AA (.307/.424/.603) and moved closer to outgrowing AAA (.267/.393/.512) in 2023.

-Fantasy managers should not sleep on Austin Hays and he let them know with a no-doubt home run to right field. He’s projected to be a mainstay in the Orioles outfield and to hit, by most projection systems, just shy of 20 home runs. The wall in left field will have something to say about Hays’ home run potential in 2024, but with health, he could put together a full season of good production.

Though the O’s fans were out in droves, Ed Smith Stadium was half-filled with New Yorkers interested in what Stroman would offer in the upcoming year. He would face Cedric Mullins, Adley Rutschman, and Ryan Mountcastle in the top of the first and would get each out on a ball in play. Marcus Stroman has an NFBC ADP in the 280s and projects to be a mid-rotation starter for the Yankees. Going into his 10th major league season, his projection has a lot of data to build off of:

Marcus Stroman, 2024 Projection
Name W ERA GS IP SO K/9 BB/9
Marcus Stroman 10 3.99 27 151 128 7.6 2.9
*Projection by ATC

Stroman hit 200 innings pitched twice in his career but hasn’t gotten over 150 in his last two seasons. He threw four innings and gave up only two hits while striking out three. Trent Grisham is only projected for 365 at-bats, but he looked as good as ever playing center field. With his defensive ability and the likelihood of his needing to fill in for injured players, some fantasy managers may be interested in rostering Grisham in deep leagues, yet the ATC projected slash line of .222/.321/.405 may not be too appealing.

After looking at the Yankees box score from the previous day, it was clear that the Yankee big dogs would be on the golf course on Saturday. All of Juan Soto, DJ LeMahieu, Aaron Judge, Anthony Rizzo, and Giancarlo Stanton were in the lineup the day before I arrived. But that provided a good opportunity to see some of the young talent the Yankees have in their system. Players like Caleb Durbin (3B, age 24), Ben Rice (C/1B, age 25), and Brandon Lockridge (OF, age 26) all had productive at-bats. As is likely to happen in Spring Training, the lineups became filled with AAA and AA players, all looking to make an impression on someone. Yankee hitters got on the board with three late runs, but couldn’t catch up to the young O’s and the seven runs they put on the board.

As odd as it is to see players walking out of the dugout and towards the clubhouse in the middle of the game, having gotten their work in for the day, there’s a sense of ease that comes with knowing the slog of the season hasn’t kicked off just yet. Your fantasy team hasn’t begun collecting stats, it may not even have all of its roster spots filled yet. But, checking in on roster situations and young prospect production is something that can give you more of an edge during a draft.


A Pitch Mechanics Consistency Data Experiment

The second word in the “music to many people’s ears” term, Spring Training, is an important one to consider. Pro ball players are training. They are preparing for the season. What types of things are they working on? Beat writers report out every year that pitchers are tinkering with new grips, different release points, varying arm slots, diets, cleats, the list is endless. This is assumed to be even more evident in pitchers. As they ramp up to game-ready status, what exactly are they ramping up and can it be quantified by a writer with only so much publicly available data at his fingertips? Away we go in answering that question together.

With statcast data available in spring training ballparks, we can access pitch-level data from the good folks at baseball savant. God bless them. There are a few metrics that measure what I would consider pitcher mechanics and here they are:

[‘release_speed’, ‘release_pos_x’, ‘release_pos_z’, ‘effective_speed’, ‘release_spin_rate’, ‘release_extension’,’spin_axis’]

These seven variables are incredibly manageable from a data perspective when compared to some of the more advanced biomechanical data teams and private company analysts are working with today. However, it can be really difficult to notice patterns from game to game just by looking at a spreadsheet:

Max Scherzer Statcast Data – 3/3/23
release_ release_ release_ effective_ release_ release_ spin_
speed pos_x pos_z speed spin_rate extension axis
94.1 -3.28 5.38 94.1 2269 6.3 229
93.2 -3.09 5.56 92.9 2213 6.2 221
93.7 -3.19 5.41 93.2 2384 6.0 226
92.9 -3.11 5.41 92.8 2317 6.2 224
93.2 -3.07 5.6 93.1 2223 6.2 219
*The header row was separated into two for viewing purposes.

Yes, you could look at this and make general assumptions. But, what if we want to visualize this? What if we wanted to hyper-analyze this so that the only people who really know what the heck is going on are the ones who are too busy playing the game in hyperspace? Bring in principal component analysis!

I’ve used this technique for a few articles here on FanGraphs. In this case, a principal component is being created based on multi-dimensional data, like the spreadsheet above with numerous columns, to create a new column. It cuts through the data and builds new “axes of variation” to better explain multiple data points. A more simplistic way of explaining this is that it’s taking multiple columns in the spreadsheet and condensing them into one. If we then create two of those new, condensed data columns, or principal components, then we can create a visualization. If this is too much data talk for you, hopefully, it gets better as I bring in the baseball.

Let’s start with the young, yet-to-debut major league pitcher, Grayson Rodriguez. How do the metrics above look, game by game as he ramps up for a season in which he expects to debut? I’ll create two principal components to help summarize a dataset similar to the table above and I’ll plot them on the x and y axis of a scatter plot, like this:

Gray-Rod Game 1 PCA Scatter

What we see is two variables, principal components one and two, explaining all the variables listed at the top of this article for one Gray-Rod Spring Training game’s worth of fastballs. It’s not very exciting. But, bring in a second game’s worth of fastballs to the visual and the excitement levels go through-the-roof!

Gray-Rod Game 1 and Game 2 PCA Scatter

…Ok, maybe it’s not that much more exciting. But, at least we can now see a little more of a story starting to develop. Ideally, since these variables are mostly repeatable we should see the blue and red dots sit closer together. What’s up with that game 2 outlier at the top of the second plot? We can compare that pitch with the averages of the other pitches in that game to analyze it further:

Data Point Evaluation
release_ release_ release_ effective_ release_ release_ spin_ PC PC
speed pos_x pos_z speed spin_rate extension axis 1 2
Data Point in Question 98.2 -2.27 6.14 100.3 2077.0 7.3 207.0 -0.00 0.02
Averages of Outing 97.9 -2.14 6.11 99.8 2021.1 7.4 208.4 -0.00 -0.00

It seems that this pitch had a higher release, effective speed, and release spin rate. Is this significant? I really have no idea. It could just be noise. I would love to know if Rodriguez would have noticed any difference after that pitch was thrown. Would he have admitted that he really wanted to get that guy out? Let’s go to the video to see what the situation was:

…Oh, wait. We can’t because MASN doesn’t want to film in sunny Florida. Luckily, we can still look at the savant video-less page here. On a 2-0 count against Spencer Torkelson, maybe Gray-Rod reared back and put a little extra mustard into making sure he didn’t get to 3-0. We’ll likely never know.

How might this compare with a pitcher who is more established? Let’s conduct this same analysis on two of Max Scherzer’s spring outings this season and compare:

Scherzer Game 1 and Game 2 PCA Scatter

Scherzer shows a little tighter spread between all of his pitches and lacks the clear outliers showcased by Rodriguez. The more interesting part to me is that the pitches get closer together from game one to game two. Could that mean anything? Could he be getting ramped up and more consistent, more repeatable?

Now the ultimate question in baseball analytics, how can we actually use this to win? I believe checking in on pitcher components throughout the season may be able to help us identify fatigued players who need rest in order to get their components back into a form that is more in line with areas of succes. This would require measuring the game by game spread or variation of the points. If that number is larger, is that a measurement of inconsistency? If it is lower, does it correlate with success? This analysis really brings up more questions than it answers, as per usual:

What if we changed the colors of the data points in the visualization to reflect individual start game scores?

Are tighter pitches (less spread among single games point locations) better?

What could be done with more data? Can this analysis be applied to biomechanical data?

How does it apply to non-fastballs? Do certain pitchers struggle with repeated motion on certain pitches and not others?

If this post is a thread in that old spring training baseball jersey you pulled out of the closet for your trip to Florida, then let’s start pulling until there’s nothing left and you’ve gotta borrow sunscreen from the shirtless guy next to you. My hope is that with a little more time and research, I’ll be able to utilize this analysis to detect in-season struggles by starting pitchers.


Clarke Schmidt Had A Good Inning

The first inning of any spring training game should come with tempered expectations, but I always find myself like the kid in the bleachers whose parents thought it would be a good idea to just get the ice cream out of the way before the first pitch is thrown. With a chocolate-smeared face and wide eyes, I find myself taking in every pitch as if I’ll never see another game again. So, maybe that’s why my reaction to Clarke Schmidt’s first inning against the Phillies motivated me to write about the Yankee righty, or maybe, he’s a pitcher that should be on your radar in keeper and dynasty leagues. Let me preface this article with the mutual understanding that I am not a prospects guy, I’m just a kid watching from the bleachers taking in the sunshine with chocolate on my face, excited to see baseball again.

Read the rest of this entry »


Beat the Shift Podcast – Spring Training Episode w/ Matt Williams – Part II

The Spring Training Episode of the Beat the Shift Podcast – a baseball podcast for fantasy baseball players.

Guest: Matt Williams

Injury Guru’s Trivia of the Week

Strategy Section

  • What can we learn from this year’s Spring training?
    • How will 2022 be different?
  • How will the start of the 2022 season differ from a typical season?
  • Using middle relievers in fantasy baseball early on in the 2022 season.
  • The return of 9-inning doubleheaders.
  • Fantasy leagues – Drafting in 2022
    • Should we push off drafting our 2022 fantasy teams until after the season starts?
    • Drafting early in the morning.

Read the rest of this entry »


New Exit Velocity Highs

Maximum Exit velocity is starting to get noticed more and more as the best single stat to measure a hitter’s raw power. While quite a bit has been written on it, the subject’s money quote is from Rob Arthur:

For every mile per hour above 108, a hitter is projected to gain about 6 points of OPS relative to their predicted number.

With several new Florida Spring Training ballparks getting publicly available Trackman, I sifted through all the games and found any players who set a new over 108 mph Exit Velocity high compared to the previous two seasons. Twenty-two players have seen improvement. Most of them had a limited number of plate appearances, so setting a new high should be expected. There are a few regulars who could see an improvement in 2021.

Alejandro Kirk
Combined PA: 25
2019 Max EV: NA
2020 Max EV: 107.4
Combined Max: 107.4
2021 Max EV: 110.3

Kirk has displayed power in the past and this jump is probably setting a baseline versus an actual power increase.

Read the rest of this entry »


5 Spring Training Hitter Performances I Care About

It’s easy to dismiss Spring Training stats. Heck, I used to vehemently deny they had ANY value. They are small samples against a wide variety of competition so how valuable can they truly be to what’s about to take place in the upcoming season? Pretty valuable it seems, if you’re looking at the right ones. Many studies have been conducted on spring stats and they have found that certain stats are indeed useful. The consensus is that strikeouts, walks, power, and stolen bases can be meaningful. With that in mind, here are five stats that stood out to me from the Cactus and Grapefruit Leagues.

Jung Ho Kang: .548 ISO in 45 PA

Kang is back in the States and grabbed hold of the 3B job with a massive spring. His .548 ISO was an MLB-best among the 250 players with at least 41 PA. Of his 10 hits, seven left the yard and two others were doubles. He did fan 18 times (40%) so he seemed to sell out for the power and maybe he ups his 21% K rate, but I’d gladly take a 25-27% K rate if he’s going to chase down 30+ HRs.

Read the rest of this entry »


American League Lineup Analysis

After just going over the National League lineups, it’s time for the American league. Again, my analysis was to focus on the lineups used, not manager speak.

Note: This article was submitted late on Wednesday for editing so the second Oakland-Seattle lineups were not available to analyze.

Baltimore

Read the rest of this entry »


Spring Traning Notes: Perez, Junis, Betances, & Others

Velocity Readings

● I’m continuing to track all fastball velocities on this spreadsheet which is updated when I feel like it.

● Martin Perez’s made a few changes to his delivery and as a side effect, his fastball is up a couple of ticks.

Pérez said he’s using his hips more in his delivery after working with new pitching coach Wes Johnson and his knowledge of biomechanics. Though Pérez insists he’s not necessarily focused on adding velocity, his fastball showed consistent velocity around 95 mph for the second straight start — up from an average of 92.8 mph last season, per Statcast.

“Before, I just used my arms,” Pérez said. “Now, I’m using all my body, and you guys can see the results. I don’t miss inside anymore. One or two, but before, I missed — like I was trying to use all of my upper body. Now, I just stay on the line and just throw the ball in front of my eyes.”

It could be an improvement in his results with his fastball getting the following results at different velocities.

MPH: SwStr%
90: 3.7%
91: 3.9%
92: 3.5%
93: 5.5%
94: 4.9%
95: 7.4%
96: 10.1%

Read the rest of this entry »