Relief Pitcher 2026 Fantasy Rankings

Closers are probably the most exciting, frustrating position to deal with from a fantasy perspective. No other position is as fundamentally shaped by managerial discretion. No other position sees player value fluctuate so wildly. Last year, baseball’s most dominant closer, Mason Miller, lost his job to Robert Suarez at the trade deadline, for reasons wholly unrelated to performance–Suárez simply had performed admirably as closer, and the Padres preferred not to mess with their bullpen hierarchy, even if Miller was their best reliever. This offseason, Suárez himself appears to have already lost his closing job for reasons unrelated to performance, as he has opted for a setup role with the Braves.
This article ranks the closers for saves-only leagues for 2026. These rankings will be updated roughly once a week to reflect the latest happenings. The rankings will shift based on trades, free agent signings, team news, rumors, new projections, sufficiently persuasive reader feedback, and my own arbitrary whims. The list will grow longer as the offseason progresses.
Changelog
- 3/19/2026
- This will be the final update for 2026. There was no major movement, but I made some small tweaks. Good luck this season; May thy closer’s knife neither chip nor shatter.
- I lowered Carlos Estévez to tier four. Even though his velocity will likely rebound somewhat during the regular season, his projections are underwhelming enough where it’s hard to justify going any higher.
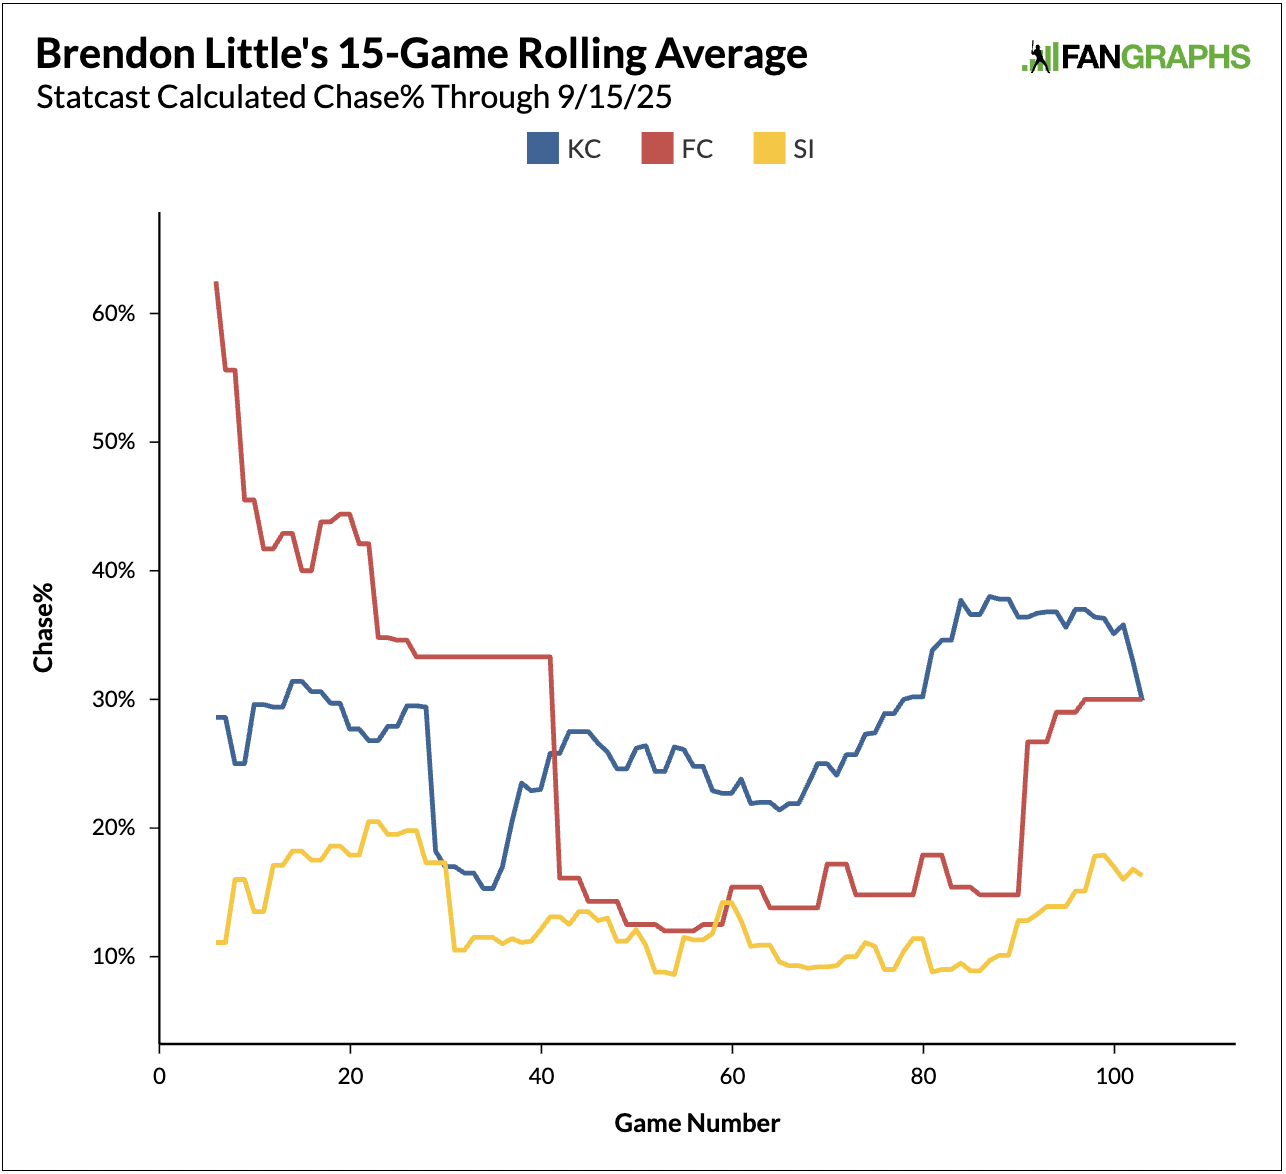
- Clayton Beeter has looked great this spring. His velocity is down slightly, but his K% minus BB% is 36%.
- Robert Garcia has had a dominant spring training, with normal velocity and a 42% K% minus BB%.
- The messy Brewers situation did not resolve itself during spring training. Trevor Megill still looks likely to be dealt in-season, but it would not surprise me if he receives the bulk of save opportunities until then.
- This will be the final update for 2026. There was no major movement, but I made some small tweaks. Good luck this season; May thy closer’s knife neither chip nor shatter.
- 3/14/2026
- One team reporter views Jojo Romero as likely closer to start the season, while another sees the situation as unresolved.
- Riley O’Brien was predominantly used as closer ahead of Jojo Romero over the final three weeks of the 2025 season, but the situation appears dicier entering 2026. Romero remains a midseason trade candidate, but nothing appears imminent. O’Brien has struggled in his tiny spring training sample. I have bumped Romero just ahead of O’Brien in this update, but it’s close to a toss-up for me.
- The Twins closing situation remains indecipherable.
- Taylor Rogers is still my top pick here, but it’s a messy situation with no clear favorite among the obvious candidates.
- Josh Hader will begin the season on the injured list, though he emerged from his first spring bullpen feeling good.
- On the whole, this is positive news as it looks like Hader will only miss a few weeks to start the year. In the meantime, Bryan Abreu will serve as a temporary top-tier closer.
- Robert Stephenson experiences health setback, Kirby Yates viewed as top candidate to close to start the year.
- With Stephenson out, Yates looks like a good bet to close for the Angels–at least until Ben Joyce proves he is fully recovered from shoulder surgery.
- One team reporter views Jojo Romero as likely closer to start the season, while another sees the situation as unresolved.
- 3/7/2026
- Carlos Estévez’s velocity is down this spring.
- It is common for closers to show diminished velocity early on in spring training, but Estévez’s average fastball is coming in six miles per hour slower than last year. He enters the season with great job security, but also arguably the worst rate stat projections of any closer, including Victor Vodnik.
- Robert Stephenson reached 95 MPH in his first spring session against live hitters.
- His average fastball velocity was 96 MPH in 2025, so he’s not far off where he was the last time we saw him healthy. He plans to be ready for opening day, further muddling an already cloudy Angels bullpen picture.
- Josh Hader to throw bullpen next week.
- Hader continues to progress in his recovery from biceps inflammation and the team has not yet ruled him out for opening day. He’s heavily discounted in drafts right now given his uncertain health. If the reports on next week’s bullpen session are positive, he could be well worth the gamble, though not for the faint of heart.
- Carlos Estévez’s velocity is down this spring.
- 2/24/2026
- Paul Sewald signs with Diamondbacks.
- Sewald jumps to the top of the closing hierachy in Arizona given his experience and recent team comments. However, Kevin Ginkel and Ryan Thompson are not far behind him if he stumbles.
- Edwin Uceta shelved with shoulder impingement.
- It doesn’t appear to be a long-term concern, but it could cause him to miss Opening Day, giving Griffin Jax and Garrett Cleavinger a leg up in the Rays closing competition.
- Trevor Megill trade winds continue to swirl.
- Megill continues to be discussed in trade talks. For now, the Brewers suggest Abner Uribe and Megill could share the closing job.
- An update on Josh Hader’s health.
- Hader is playing light catch as he recovers from biceps inflammation. It doesn’t appear to be a long-term concern, but he looks increasingly likely to miss Opening Day.
- Paul Sewald signs with Diamondbacks.
- 2/12/2026
- Updated ADP data from NFBC Draft Champions to NFBC Online Championships.
- Athletics sign Scott Barlow.
- Barlow has the most closing experience on the team and his projections are passable. Mark Leiter Jr. has slightly better projections and signed for a slightly bigger contract ($3 million versus $2 million), so this one is close to a toss up–but right now I lean toward the guy with a lengthier track record of closing.
- Josh Hader is behind schedule.
- He was dealing with biceps tendinitis and returned to throwing yesterday. He believes it’s a minor concern that won’t impact his availability this year, but it’s enough to ding him a few spots in the rankings, and to bump Bryan Abreu up a few spots.
- Kevin Ginkel is healthy, Andrew Saalfrank will miss the year after undergoing shoulder surgery, and A.J. Puk could return from elbow surgery before All-Star break.
- Puk is not worth stashing for two months in standard FAAB leagues, but when he returns he is a good bet to reclaim closing duties from Kevin Ginkel, or whomever else has the job. With Saalfrank going down, Ginkel looks like a solid bet for saves to start the year.
- Robert Stephenson dealt with multiple arm injuries this offseason, but is ostensibly healthy now.
- Robert Garcia and Chris Martin named as lead candidates for saves for the Rangers.
- Texas did not give Martin many save opportunities last season even though he was as dominant as ever, so Garcia is still my preferred pick here–but Martin is also worth drafting later on.
- Jordan Hicks traded to White Sox.
- Per general manager Chris Getz, “I think the White Sox are at the best if he’s at his best in the bullpen.” Hicks still projects well in a bullpen role and could eventually compete for saves if Seranthony Domínguez falters.
- Liam Hendriks signs minor-league contract with Twins.
- Hendriks is coming off a rough couple of seasons but has legendary closing pedigree, while the Twins lack a clear closer. Monitor his chances of making the team this spring and consider him as a late dart throw in your drafts.
- 2/2/2026
- White Sox sign Seranthony Domínguez.
- He joins tier three as he is expected to close. Jordan Leasure and Grant Taylor each take a hit in the ranks. Along with David Robertson, who has now announced his retirement, Domínguez was the last big domino to fall among free agent relievers. There are still a few interesting names left unsigned, like Michael Kopech, but none are a particularly good bet to usurp an incumbent closer regardless of where they end up. That means future movement in the ranks will be driven by trades, injuries, and commentary from the teams themselves.
- White Sox sign Seranthony Domínguez.
- 1/23/2026
- Twins sign Taylor Rogers.
- Rogers immediately jumps to the top of the bullpen hierarchy in Minnesota given his past closing experience and the paucity of strong alternatives in the Twins bullpen. His ERA projections are nothing special, sitting in the high-threes across across most projections, but he’s a solid bet to open the season as closer.
- Diamondbacks sign Jonathan Loáisiga to a minor-league contract.
- Per Steamer and OOPSY, Loáisiga has the best projections of any healthy D-backs reliever, but he will probably have to work his way up the closer hierarchy as his contract is of the minor league variety. If he looks like a good bet to make the MLB roster this spring, I may need to move him up.
- Royals moving in the fences at Kauffman Stadium.
- Moving in the fences will likely increase homers, decrease doubles and triples, and boost scoring overall. Carlos Estévez’s rank falls a few spots as his rate stat projections take a hit (note: the park changes are already reflected in OOPSY).
- Twins sign Taylor Rogers.
- 1/8/2026
- Angels sign Kirby Yates.
- Given his extensive closing experience and Robert Stephenson’s trouble staying healthy, Yates vaults to the top of the Angels hierarchy for me, joining the third tier, while Stephenson drops down to tier four.
- Noteworthy OOPSY projections.
- This year’s OOPSY projections should be published at some point in the next 24 hours, joining other published FanGraphs projections, Steamer, THE BAT, and (partially) ZiPS. Focusing on ERA projections, here are some relievers OOPSY is bullish on relative to the other systems: Andrés Muñoz (2.51), Griffin Jax (2.68), and Trevor Megill (2.93). OOPSY’s optimism on Muñoz is likely park-related, as it makes use of Statcast park factors that view T-Mobile as more pitcher-friendly relative to FanGraphs park factors. OOPSY’s Jax projection suggests he is one of baseball’s best relievers; he is no lock to lead the closing committee for Tampa, but he has huge upside if he is able to win a large share of the job. Megill’s projection would make him a worthy closer for many MLB teams, but OOPSY is even higher on Abner Uribe. In any case, the Brewers closer situation remains one of the most difficult to parse this offseason.
- Closer Monkey and RosterResource – Closer Depth Charts disagreements.
- Closer Monkey and RosterResource are two indispensable sources for understanding bullpen hierarchies and saves situations. They tend to agree more than they disagree, with the two sources currently listing the same name at the top of the hierarchy for 26 of 30 teams. There are four teams where they disagree: the Rays, the Brewers, the Diamondbacks, and the Athletics. I currently side with Closer Monkey on three of those four, also preferring Griffin Jax, Kevin Ginkel, and Mark Leiter Jr. to lead their respective hierarchies, while I am aligned with RosterResource on Abner Uribe over Trevor Megill for now–in large part because I think Megill will be traded to a situation where he may not close. Additionally, I deviate from both sources only on two teams: I have Kirby Yates leading the Angels hierarchy, while both still prefer Robert Stephenson; I also have Kody Funderbunk leading the Twins hierarchy, although that situation is so volatile that I’d guess that their 2026 saves leader is someone that’s entirely off the radar at this point. In any case, from a fantasy perspective, the teams with disagreement are the most interesting–and volatile.
- Angels sign Kirby Yates.
- 12/28/2025
- Marlins sign Pete Fairbanks.
- It’s a great landing spot for Fairbanks as he should be the sole closing option in Miami. Accordingly, Calvin Faucher and Ronny Henriquez have been removed from the ranks. Henriquez would have been removed even if he were healthy as a result of the Fairbanks signing, but it was also announced that he is slated to miss the 2026 season after undergoing UCL reconstruction surgery.
- Kenley Jansen is not guaranteed the closing job.
- It is still difficult to imagine him not handling most save opportunities given his track record but at this point in his career his projections are less than stellar. I added Will Vest to the backend of the ranks as he has much better projections and was used ahead of Kyle Finnegan to close out games at the end of the 2025 season.
- The White Sox sign Sean Newcomb.
- Newcomb will be given the chance to start, but he is still a nice late sleeper option for saves as he is more experienced than Jordan Leasure or Grant Taylor, plus he is coming off a strong 2025 season out of the pen.
- Diamondbacks are expected to sign a closing option to fill the role until Justin Martinez and A.J. Puk are ready to return in late 2026.
- The only issue here is there aren’t a ton of great bullpen options left in free agency. Per RosterResource’s Free Agent Tracker, some remaining arms that might compete for closer are Michael Kopech, Paul Sewald, and Seranthony Dominguez.
- Marlins sign Pete Fairbanks.
- 12/18/2025 – First Release
Ranking Methodology
- ADP is based on 30-day rolling NFBC Draft Champions Leagues.
- $ Values are based on standard 5×5 12-team saves league using the FanGraphs Depth Charts and these Auction Calculator settings. They default to a player’s most valuable position, so if the first base list includes a catcher, it will show that player’s value at catcher.
- ADP and $ Values are updated as of the last update date on this post.
- 5-game eligibility was used for these lists to cast the widest net.
Closers You Can Count On
| Rank | Name | Team | Pos | Change | ADP | $ |
|---|---|---|---|---|---|---|
| 1 | Mason Miller | SDP | RP | – | 29 | $19 |
| 2 | Edwin Díaz | LAD | RP | – | 33 | $16 |
| 3 | Jhoan Duran | PHI | RP | – | 42 | $16 |
| 4 | Andrés Muñoz | SEA | RP | – | 41 | $12 |
| 5 | Cade Smith | CLE | RP | – | 40 | $16 |
| 6 | Devin Williams | NYM | RP | – | 61 | $12 |
| 7 | Aroldis Chapman | BOS | RP | – | 63 | $12 |
| 8 | David Bednar | NYY | RP | – | 64 | $12 |
Next Best For The Ninth
| Rank | Name | Team | Pos | Change | ADP | $ |
|---|---|---|---|---|---|---|
| 9 | Ryan Helsley | BAL | RP | – | 86 | $7 |
| 10 | Daniel Palencia | CHC | RP | – | 101 | $8 |
| 11 | Pete Fairbanks | MIA | RP | – | 112 | $6 |
| 12 | Jeff Hoffman | TOR | RP | – | 102 | $8 |
| 13 | Ryan Walker | SFG | RP | – | 154 | $9 |
| 14 | Raisel Iglesias | ATL | RP | – | 102 | $8 |
Flawed Saves Heroes
| Rank | Name | Team | Pos | Change | ADP | $ |
|---|---|---|---|---|---|---|
| 15 | Emilio Pagán | CIN | RP | – | 113 | $3 |
| 16 | Josh Hader | HOU | RP | – | 122 | $12 |
| 17 | Abner Uribe | MIL | RP | – | 161 | $7 |
| 18 | Griffin Jax | TBR | RP | – | 151 | $10 |
| 19 | Seranthony Domínguez | CHW | RP | – | 197 | $1 |
| 20 | Kenley Jansen | DET | RP | – | 137 | $2 |
| 21 | Dennis Santana | PIT | RP | – | 149 | $4 |
| 22 | Trevor Megill | MIL | RP | – | 141 | $5 |
Closer Dart Throws
| Rank | Name | Team | Pos | Change | ADP | $ |
|---|---|---|---|---|---|---|
| 23 | Clayton Beeter | WSN | RP | – | 316 | -$2 |
| 24 | Robert Garcia | TEX | RP | – | 237 | $5 |
| 25 | Kirby Yates | LAA | RP | – | 279 | -$2 |
| 26 | JoJo Romero | STL | RP | – | 459 | $1 |
| 27 | Carlos Estévez | KCR | RP | – | 109 | $2 |
| 28 | Victor Vodnik | COL | RP | – | 482 | -$4 |
| 29 | Bryan Abreu | HOU | RP | – | 188 | $5 |
| 30 | Riley O’Brien | STL | RP | – | 254 | -$2 |
| 31 | Mark Leiter Jr. | ATH | RP | – | 721 | -$2 |
| 32 | Paul Sewald | ARI | RP | – | 496 | -$3 |
| 33 | Garrett Cleavinger | TBR | RP | – | 522 | $5 |
| 34 | Taylor Rogers | MIN | RP | – | 414 | -$1 |
| 35 | Chris Martin | TEX | RP | – | 681 | $0 |
| 36 | Robert Suarez | ATL | RP | – | 209 | $2 |
| 37 | Lucas Erceg | KCR | RP | – | 579 | -$2 |
Deep League Fliers
| Rank | Name | Team | Pos | Change | ADP | $ |
|---|---|---|---|---|---|---|
| 38 | Ben Joyce | LAA | RP | – | 737 | -$1 |
| 39 | Cole Henry | WSN | RP | – | 729 | -$10 |
| 40 | Cole Sands | MIN | RP | – | 733 | -$3 |
| 41 | Kevin Ginkel | ARI | RP | – | 492 | -$2 |
| 42 | Ryan Thompson | ARI | RP | – | -$5 | |
| 43 | Jordan Romano | LAA | RP | – | 744 | -$4 |
| 44 | Scott Barlow | ATH | RP | – | -$8 | |
| 45 | Liam Hendriks | MIN | RP | – | 744 | |
| 46 | Gregory Soto | PIT | RP | – | 740 | -$4 |
| 47 | Will Vest | DET | RP | – | 516 | $1 |
| 48 | Bryan Baker | TBR | RP | – | -$2 | |
| 49 | Edwin Uceta | TBR | RP | – | 543 | $2 |
| 50 | Matt Strahm | KCR | RP | – | 725 | $0 |
| 51 | Grant Taylor | CHW | RP | – | 494 | $3 |
| 52 | Drew Pomeranz | LAA | RP | – | 736 | -$4 |
| 53 | Adrian Morejon | SDP | RP | – | 732 | $2 |
| 54 | Jeremiah Estrada | SDP | RP | – | 601 | $3 |
| 55 | Camilo Doval | NYY | RP | – | 684 | -$2 |
| 56 | Garrett Whitlock | BOS | RP | – | 646 | $3 |
| 57 | Jose A. Ferrer | SEA | RP | – | $1 | |
| 58 | Matt Brash | SEA | RP | – | 740 | $1 |
| 59 | Jonathan Loáisiga |
ARI | RP | – | -$5 | |
| 60 | Hogan Harris | ATH | RP | – | 674 | -$6 |
| 61 | Ryne Stanek | STL | RP | – | -$5 |
Full Rankings Without Tiers
| Rank | Name | Team | Pos | Change | ADP | $ |
|---|---|---|---|---|---|---|
| 1 | Mason Miller | SDP | RP | – | 29 | $19 |
| 2 | Edwin Díaz | LAD | RP | – | 33 | $16 |
| 3 | Jhoan Duran | PHI | RP | – | 42 | $16 |
| 4 | Andrés Muñoz | SEA | RP | – | 41 | $12 |
| 5 | Cade Smith | CLE | RP | – | 40 | $16 |
| 6 | Devin Williams | NYM | RP | – | 61 | $12 |
| 7 | Aroldis Chapman | BOS | RP | – | 63 | $12 |
| 8 | David Bednar | NYY | RP | – | 64 | $12 |
| 9 | Ryan Helsley | BAL | RP | – | 86 | $7 |
| 10 | Daniel Palencia | CHC | RP | – | 101 | $8 |
| 11 | Pete Fairbanks | MIA | RP | – | 112 | $6 |
| 12 | Jeff Hoffman | TOR | RP | – | 102 | $8 |
| 13 | Ryan Walker | SFG | RP | – | 154 | $9 |
| 14 | Raisel Iglesias | ATL | RP | – | 102 | $8 |
| 15 | Emilio Pagán | CIN | RP | – | 113 | $3 |
| 16 | Josh Hader | HOU | RP | – | 122 | $12 |
| 17 | Abner Uribe | MIL | RP | – | 161 | $7 |
| 18 | Griffin Jax | TBR | RP | – | 151 | $10 |
| 19 | Seranthony Domínguez | CHW | RP | – | 197 | $1 |
| 20 | Kenley Jansen | DET | RP | – | 137 | $2 |
| 21 | Dennis Santana | PIT | RP | – | 149 | $4 |
| 22 | Trevor Megill | MIL | RP | – | 141 | $5 |
| 23 | Clayton Beeter | WSN | RP | – | 316 | -$2 |
| 24 | Robert Garcia | TEX | RP | – | 237 | $5 |
| 25 | Kirby Yates | LAA | RP | – | 279 | -$2 |
| 26 | JoJo Romero | STL | RP | – | 459 | $1 |
| 27 | Carlos Estévez | KCR | RP | – | 109 | $2 |
| 28 | Victor Vodnik | COL | RP | – | 482 | -$4 |
| 29 | Bryan Abreu | HOU | RP | – | 188 | $5 |
| 30 | Riley O’Brien | STL | RP | – | 254 | -$2 |
| 31 | Mark Leiter Jr. | ATH | RP | – | 721 | -$2 |
| 32 | Paul Sewald | ARI | RP | – | 496 | -$3 |
| 33 | Garrett Cleavinger | TBR | RP | – | 522 | $5 |
| 34 | Taylor Rogers | MIN | RP | – | 414 | -$1 |
| 35 | Chris Martin | TEX | RP | – | 681 | $0 |
| 36 | Robert Suarez | ATL | RP | – | 209 | $2 |
| 37 | Lucas Erceg | KCR | RP | – | 579 | -$2 |
| 38 | Ben Joyce | LAA | RP | – | 737 | -$1 |
| 39 | Cole Henry | WSN | RP | – | 729 | -$10 |
| 40 | Cole Sands | MIN | RP | – | 733 | -$3 |
| 41 | Kevin Ginkel | ARI | RP | – | 492 | -$2 |
| 42 | Ryan Thompson | ARI | RP | – | -$5 | |
| 43 | Jordan Romano | LAA | RP | – | 744 | -$4 |
| 44 | Scott Barlow | ATH | RP | – | -$8 | |
| 45 | Liam Hendriks | MIN | RP | – | 744 | |
| 46 | Gregory Soto | PIT | RP | – | 740 | -$4 |
| 47 | Will Vest | DET | RP | – | 516 | $1 |
| 48 | Bryan Baker | TBR | RP | – | -$2 | |
| 49 | Edwin Uceta | TBR | RP | – | 543 | $2 |
| 50 | Matt Strahm | KCR | RP | – | 725 | $0 |
| 51 | Grant Taylor | CHW | RP | – | 494 | $3 |
| 52 | Drew Pomeranz | LAA | RP | – | 736 | -$4 |
| 53 | Adrian Morejon | SDP | RP | – | 732 | $2 |
| 54 | Jeremiah Estrada | SDP | RP | – | 601 | $3 |
| 55 | Camilo Doval | NYY | RP | – | 684 | -$2 |
| 56 | Garrett Whitlock | BOS | RP | – | 646 | $3 |
| 57 | Jose A. Ferrer | SEA | RP | – | $1 | |
| 58 | Matt Brash | SEA | RP | – | 740 | $1 |
| 59 | Jonathan Loáisiga |
ARI | RP | – | -$5 | |
| 60 | Hogan Harris | ATH | RP | – | 674 | -$6 |
| 61 | Ryne Stanek | STL | RP | – | -$5 |