
ERA Equivalent WHIP (or Why Yusei Kikuchi is Unrosterable)

Every week, I look through my rostered pitchers noting the worst ones and churn them out next week. This week, the Yusei Kikuchi stood out. Someone with a 3.06 ERA and his ERA estimators around 4.50. It was his ERA estimators throwing red flags, but I have other pitchers worse. It was his 1.52 WHIP, third worst among qualified starters behind Kyle Freeland (1.63) and Jack Kochanowicz (1.56). With WHIP being its own Roto category, it has as much weight as ERA but ERA is the mentioned multiple times more often than WHIP. I’m just going to create a simple WHIP to ERA conversion to put both on the same scale.
To get the conversion equation, I used the overall rankings for the NFBC’s Main Event (15 team) and Online Championship (12 team). With them, I ranked the WHIP and ERA values separately. I removed the the first and last 10% of values because the change for them isn’t linear.
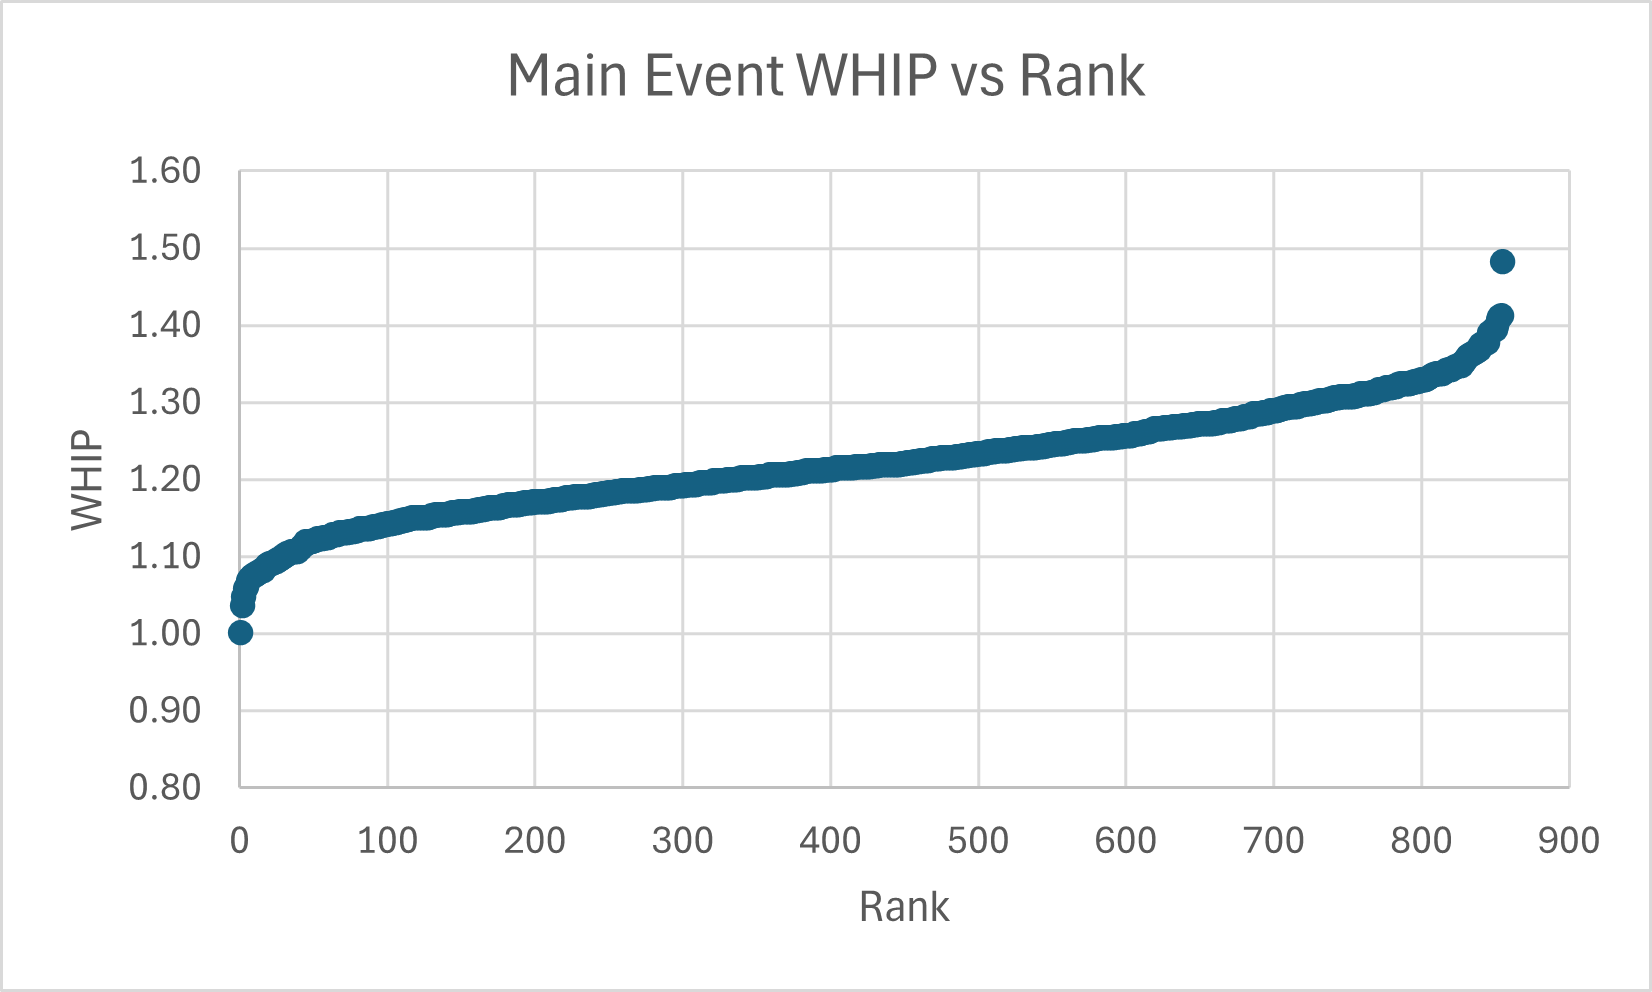
With the tails removed and plotted the best remaining WHIP with the best remaining ERA. I did that for each one. Here are the plotted results.
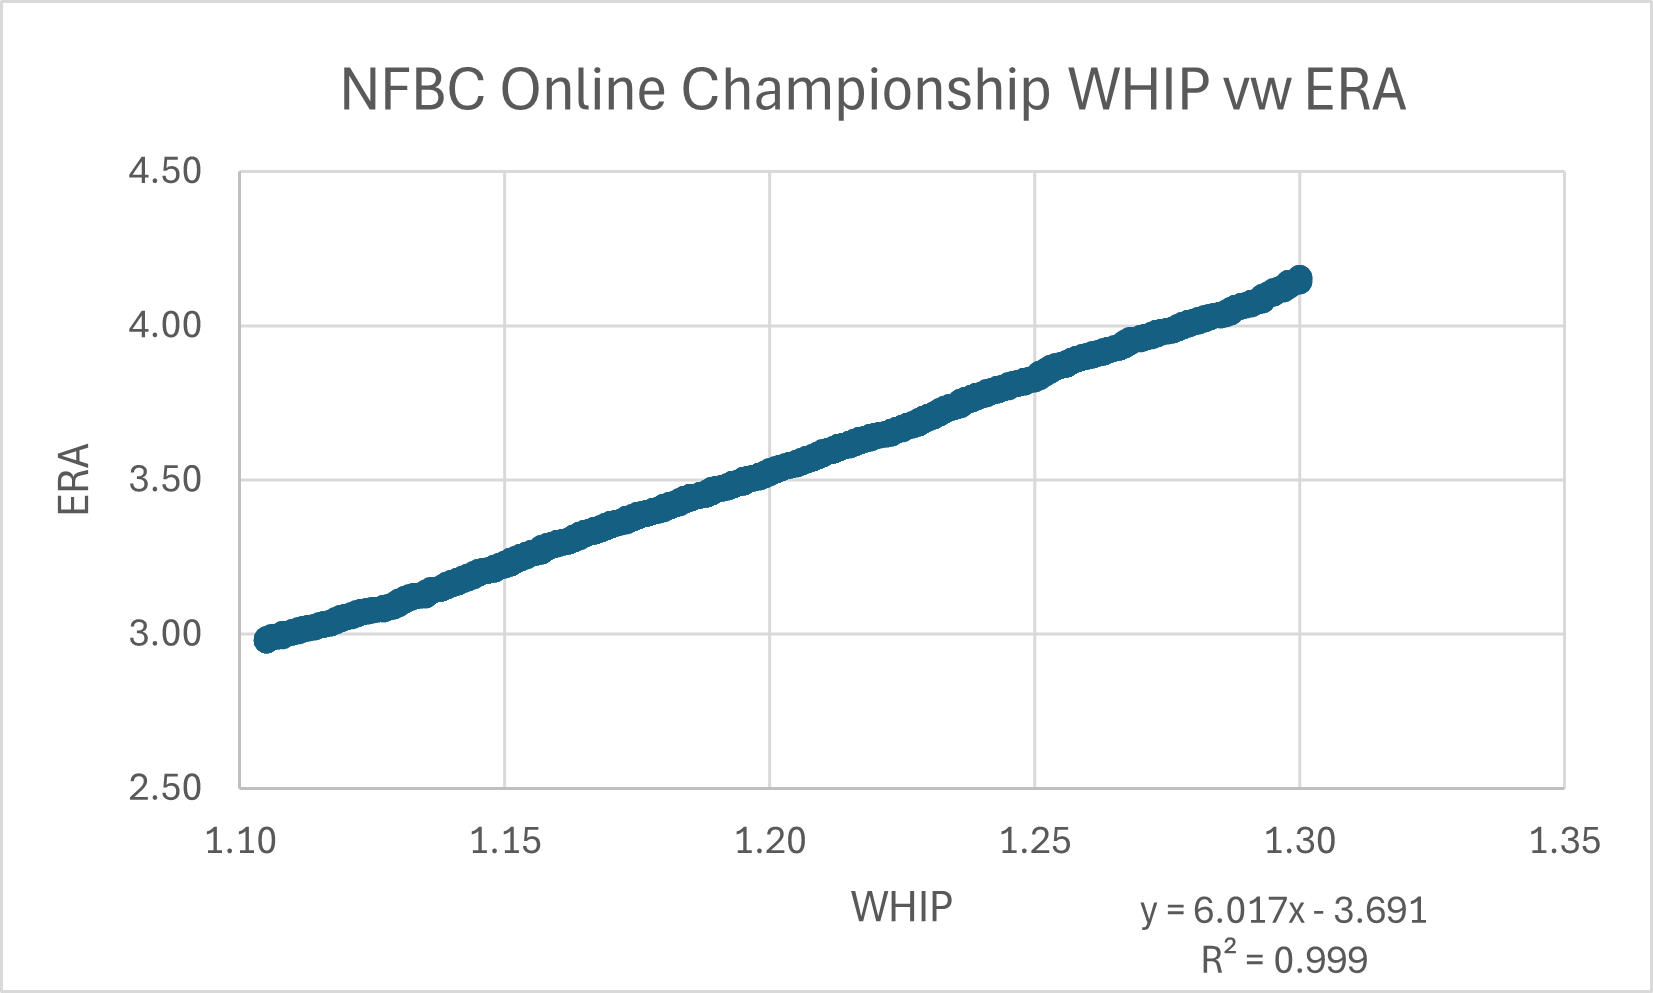

The correlation is nearly perfect, so the correlation equations can be used to convert a WHIP to an ERA equivalent. Here is conversion table.
| WHIP | ME Eqiv ERA | OC Eqiv ERA |
|---|---|---|
| 0.70 | 0.48 | 0.52 |
| 0.80 | 1.09 | 1.12 |
| 0.90 | 1.70 | 1.72 |
| 1.00 | 2.31 | 2.33 |
| 1.10 | 2.92 | 2.93 |
| 1.20 | 3.53 | 3.53 |
| 1.30 | 4.14 | 4.13 |
| 1.40 | 4.75 | 4.73 |
| 1.50 | 5.36 | 5.33 |
| 1.60 | 5.97 | 5.94 |
| 1.70 | 6.58 | 6.54 |
| 1.80 | 7.19 | 7.14 |
| 1.90 | 7.80 | 7.74 |
| 2.00 | 8.41 | 8.34 |
The results for the two league types are close so I’ll only use the Main Event information going forward. Besides the above table, I have created a public Google Sheet (copy by going to File -> Make a Copy) where a WHIP can be entered and an equivalent ERA is spit out.
Kikuchi’s 1.52 WHIP would be equivalent to a ~5.50 ERA. No one is starting/rostering a pitcher with a 5.50 ERA this deep into the season. The high WHIP can’t be ignored and I’m likely to move on where I can find decent options.
Besides Kikuchi, Here are the qualified pitchers who have a WHIP that does as much ratio damage as a 4.50 or worse ERA.
| Name | ERA | WHIP | equivalent ERA | NFBC Main Event Roster% |
|---|---|---|---|---|
| Kyle Freeland | 5.72 | 1.63 | 6.15 | 4% |
| Jack Kochanowicz | 5.34 | 1.56 | 5.72 | 4% |
| Yusei Kikuchi | 3.06 | 1.52 | 5.48 | 98% |
| José Soriano | 3.41 | 1.51 | 5.42 | 98% |
| Randy Vásquez | 3.99 | 1.47 | 5.18 | 42% |
| Gavin Williams | 3.79 | 1.45 | 5.05 | 100% |
| Luis L. Ortiz | 4.40 | 1.43 | 4.93 | 91% |
| Max Meyer | 4.73 | 1.42 | 4.87 | 100% |
| Sean Burke | 4.20 | 1.42 | 4.87 | 28% |
| Jonathan Cannon | 4.66 | 1.40 | 4.75 | 21% |
| Michael Lorenzen | 4.33 | 1.40 | 4.75 | 98% |
| Zac Gallen | 5.54 | 1.40 | 4.75 | 100% |
| Dean Kremer | 4.70 | 1.39 | 4.69 | 81% |
| Jeffrey Springs | 4.72 | 1.38 | 4.63 | 97% |
| Shane Baz | 4.92 | 1.38 | 4.63 | 100% |
| Andre Pallante | 4.23 | 1.36 | 4.50 | 86% |
| Chris Bassitt | 3.80 | 1.36 | 4.50 | 97% |
Gavin Williams and José Soriano have been devastating managers’ in the WHIP category but it doesn’t seem as bad with sub-4.00 ERA.
WHIP is probably one of the most misunderstood categories and hopefully I made it easier to understand an expectable value.
Jeff, one of the authors of the fantasy baseball guide,The Process, writes for RotoGraphs, The Hardball Times, Rotowire, Baseball America, and BaseballHQ. He has been nominated for two SABR Analytics Research Award for Contemporary Analysis and won it in 2013 in tandem with Bill Petti. He has won four FSWA Awards including on for his Mining the News series. He's won Tout Wars three times, LABR twice, and got his first NFBC Main Event win in 2021. Follow him on Twitter @jeffwzimmerman.
Excellent way to illustrate how WHIP is greatly overlooked. Made me go look at my team. He isn’t qualified but Roupp’s 1.38 is far less helpful than his 3.18 ERA.
Agreed. On Roupp watch the trend lines as his recent WHIP from May 1 on is 0.95, 1.75, 1.17, 1.17, 1.00, and 1.00. One bad blowup in Detroit but fairly strong performance otherwise against mostly good teams. He has walked at least two batters in each of the last 4 and that’s his big issue (most of his early year blowups were 3 walk+ affairs).
I think he likely delivers better than 1.38 going forward because I like his talent.
One other thing I’ll note. My leagues are mainly points leagues so WHIP is not directly relevant but correlates to value. It is the most volatile and most tightly bunched ratio stat by a fair amount. For example in a 12 team league I play the standard deviation is 0.05 with only three teams more than 1 standard deviation away from average in either direction. The margins get really fine so blow ups can really impact this stat
Fair point and FWIW, I have no intention of dumping Roupp since I like him as a young guy on the rise.
I like this – nice writeup! Can you do a companion piece showing potential “buy low” candidates with high ERAs but low WHIP?
Fantastic idea!
I see Bailey Ober just missed the cut, but he has been terrible. 3.48/1.35/7.26 for the year and 3.09/1.37/7.33 the last month.
Ober is an interesting example that may illustrate the limits of this approach. Historically he has posted excellent WHIPs in comparison to merely okay ERAs. This year it’s the reverse. His K rate has dipped but his WHIP is mostly elevated because of a BABIP that’s 45 points above his career norm. Going forward projections still have him as a WHIP asset, dropping Ober because of the damage he’s done to your WHIP would be foolhardy.
Twins did him a solid today skipping him out of Sacramento w/his HR issues
great article Jeff, as always. Did you notice that if, for example, the WHIP-derived ERA is above the actual ERA, there is a tendency for the actual WHIP to regress (or, of course, the actual ERA to increase)? or do you think that some pitchers just deviate long-term (maybe high K guys like Ortiz, which helps offset the WHIP damage) and you pick your poison?
Certainly Kodai Senga is a guy I expect to deviate long term. The perfect ghost fork looks like it might be a high heater and ends up a few inches below the zone. But nobody can hit it. That’s a formula for low ERA and high WHIP.
Walks and hits turn into earned runs, but not vice-versa.
Which is my way of saying that I don’t think I would use an ERA-related number to identify guys that may be in the running for WHIP improvement.
I have Kikuchi and Bassitt… I see why I’m bottom 3 in WHIP. Great article, making adjustments going forward.
Brilliant, brilliant, brilliant. Just missing the cut on your unrosterables (including his 12R blowup last week): Jesus Luzardo. Yikes! Worth watching carefully moving forward…
Didn’t help himself today!
Yeah Luzardo was the guy who jumped out at me… so the red flags were there even before some portion of his sudden implosion
Fantastic content. *quietly adds Christopher Sanchez to the trade block*
Helpful article. I agree that WHIP is not emphasized nearly as much as ERA in fantasy analysis even though it is just as important. However, I do have a small gripe. You wrote “No one is starting/rostering a pitcher with a 5.50 ERA this deep into the season.” But aren’t you the one who says to ignore in-season ERA because it’s not a good predictor? Ben Brown has a 5.7 ERA and I would be comfortable starting/ rostering him with a 20.5 K-BB% and 3.18 SIERA.
Ideally in evaluating a pitchers WHIP we would have some sort of skills-based WHIP estimator that removes/ regresses some of the extreme BABIPs pitchers have allowed. Or you could just look at a pitcher’s WHIP projections going forward – Kikuchi’s are pretty bad.
How’d you manage to guess all the names on my AL-only pitching staff? Good call out and great idea to simplify things Jeff.
This is super cool! Trying to understand the tails from your first graph where the relationship isn’t linear. Does that mean that very low or very high WHIPs lead to even lower or higher ERAs than you get by linear regression?
Robbie Ray wants royalties for this article.