WARNING: If you are reading this article, some or most the exact values are out of date. The pitch quality models seem to go through at least a yearly adjustment so I can’t verify if all the numbers will hold up. With that caveat, it’s useful to have an overall idea of what each one means.
Last week, I was looking into Joey Lucchesi and I created this convoluted mess of a table.
Joey Lucchesi’s Pitch Modeling Stats
| Model |
SI |
CU/CH |
FF/FC |
Stuff |
Overall |
| Bot |
52 |
46 |
37 |
43 |
49 |
| Stuff+ |
89 |
91 |
72 |
86 |
98 |
| pERA (AAA) |
5.54 |
-0.44 |
4.79 |
2.74 |
3.14 |
| pERA (AAA comps) |
4.72 |
2.89 |
4.23 |
– |
– |
To start off with, having three different metrics using three different scales is confusing. Not as obvious was that I didn’t know exact what the two “Stuff” metric were exactly measuring. I had some idea listening to their creators and others using them. I decided to take a step back and put some perspective on the two pitch quality models so others and myself could correctly reference them and know what other metrics they corelate to.
Note: When I mention stuff metrics, I’m just referring to the Stuff values for Stuff+ and Pitching Bot. I know it can be confusing, especially with one system having the name Stuff+.
Two start out with, this article won’t answer two questions. First, I’m not looking into the predictiveness of the stats. While I have done some work on it, I feel that should be its own article. Second, I’m just looking at the combined values, not the individual pitches. Again, a separate article for another day.
Here at FanGraphs, we introduced the pitch modeling metrics over a month ago introducing PitchingBot and Stuff+ with separate writeups.
Here is a short description of each from the original articles.
PitchingBot
In short, PitchingBot takes inputs such as pitcher handedness, batter handedness, strike zone height, count, velocity, spin rate, movement, release point, extension, and location to determine the quality of a pitch, as well as its possible outcomes. Those outcomes are then aggregated and normalized on a 20-80 scouting scale, which is what is displayed on the leaderboards.
Stuff+
Stuff+ only looks at the physical characteristics of a pitch, including but not limited to: release point, velocity, vertical and horizontal movement, and spin rate.
…
Stuff+, Location+, and Pitching+ are all on the familiar “+” scale (like wRC+), with 100 being average.
While both supply a reason behind their values, it sucks that they each have their own scale. Personally, I have my pERA values and similar pitches on an ERA scale so there is readily recognizable reference.
The first item of business was to put put both of the metrics on an ERA scale. By lining up the values from 2021 and 2022 (min 40 IP) with the pitcher’s actual ERA, the following two formulas were created.
-
- PitchingBot values to an equivalent ERA (r-squared of .992): 22.697*e^(-.035*Bot Metric)
- Stuff+ values to an equivalent ERA (r-squared of .996): 49.19*e^(-.025*Stuff+ Metric)
With the two formulas, here is a quick reference table for stuff values and the ERA equivalent.
Conversion Table for ERA to “Stuff” Equivalents
| ERA Equivalent |
BotPlus |
Stuff+ |
| 1.50 |
78 |
135 |
| 2.00 |
69 |
124 |
| 2.50 |
63 |
115 |
| 3.00 |
58 |
108 |
| 3.50 |
53 |
101 |
| 4.00 |
50 |
96 |
| 4.50 |
46 |
92 |
| 5.00 |
43 |
87 |
| 5.50 |
41 |
83 |
| 6.00 |
40 |
80 |
For an example, say a pitcher has a Stuff+ of exactly 100. We would expect the hitter to have an BotStuff around 52 and an ERA around 3.60.
The next step I did was bucket the three metrics for each PitchingBot (stuff, command, and overall) and Stuff+ (Stuff+, Location+, and Pitching+) and then compare them to other pitching metrics. To start with, here is a limited comparison (limited table size) with all the values in this Google Doc.
Pitching Bot
Comparison of PitchingBot’s Stuff to Other Metrics
| Range |
botOvr |
botStf |
botCmd |
Pitching+ |
Stuff+ |
Location+ |
ERA |
K/9 |
BB/9 |
WHIP |
HR/9 |
| >70 |
62 |
72 |
49 |
106 |
125 |
98 |
3.05 |
11.9 |
3.9 |
1.13 |
0.8 |
| 65-70 |
62 |
67 |
53 |
106 |
120 |
100 |
3.01 |
11.1 |
3.3 |
1.12 |
0.8 |
| 60-65 |
58 |
62 |
52 |
104 |
113 |
99 |
3.30 |
10.5 |
3.5 |
1.17 |
0.9 |
| 55-60 |
56 |
57 |
53 |
102 |
107 |
100 |
3.62 |
9.8 |
3.3 |
1.20 |
1.0 |
| 50-55 |
54 |
52 |
53 |
101 |
102 |
100 |
3.81 |
9.0 |
3.2 |
1.25 |
1.1 |
| 45-50 |
52 |
47 |
54 |
99 |
97 |
101 |
4.16 |
8.4 |
3.1 |
1.28 |
1.2 |
| 40-45 |
49 |
42 |
53 |
97 |
91 |
100 |
4.63 |
7.7 |
3.1 |
1.35 |
1.4 |
| <40 |
46 |
36 |
54 |
96 |
86 |
101 |
4.60 |
6.7 |
2.9 |
1.36 |
1.3 |
Comparison of PitchingBot’s Command to Other Metrics
| Range |
botOvr |
botStf |
botCmd |
Pitching+ |
Stuff+ |
Location+ |
ERA |
K/9 |
BB/9 |
WHIP |
HR/9 |
| >70 |
62 |
44 |
70 |
101 |
88 |
108 |
4.06 |
9.4 |
1.4 |
1.11 |
0.9 |
| 65-70 |
64 |
50 |
66 |
105 |
104 |
107 |
3.75 |
8.8 |
2.0 |
1.16 |
1.1 |
| 60-65 |
59 |
50 |
62 |
104 |
101 |
104 |
3.59 |
9.0 |
2.3 |
1.16 |
1.2 |
| 55-60 |
56 |
50 |
57 |
102 |
101 |
102 |
3.85 |
8.7 |
2.7 |
1.21 |
1.1 |
| 50-55 |
53 |
52 |
52 |
101 |
103 |
100 |
3.83 |
9.1 |
3.3 |
1.26 |
1.1 |
| 45-50 |
49 |
51 |
47 |
98 |
99 |
97 |
4.37 |
8.7 |
3.9 |
1.36 |
1.1 |
| 40-45 |
46 |
53 |
42 |
97 |
102 |
95 |
4.28 |
9.3 |
4.5 |
1.35 |
1.1 |
| <40 |
43 |
56 |
35 |
96 |
104 |
92 |
4.11 |
9.6 |
4.6 |
1.37 |
1.0 |
Comparison of PitchingBot’s Overall to Other Metrics
| Range |
botOvr |
botStf |
botCmd |
Pitching+ |
Stuff+ |
Location+ |
ERA |
K/9 |
BB/9 |
WHIP |
HR/9 |
| >70 |
72 |
69 |
61 |
112 |
128 |
105 |
2.39 |
11.9 |
2.2 |
0.95 |
0.8 |
| 65-70 |
67 |
62 |
61 |
109 |
118 |
104 |
3.07 |
10.7 |
2.4 |
1.05 |
1.0 |
| 60-65 |
61 |
58 |
58 |
105 |
110 |
103 |
3.41 |
10.2 |
2.7 |
1.13 |
1.0 |
| 55-60 |
57 |
54 |
56 |
102 |
104 |
101 |
3.59 |
9.3 |
3.0 |
1.21 |
1.0 |
| 50-55 |
52 |
49 |
53 |
100 |
99 |
100 |
4.05 |
8.5 |
3.2 |
1.29 |
1.2 |
| 45-50 |
47 |
45 |
50 |
97 |
93 |
99 |
4.40 |
8.1 |
3.6 |
1.34 |
1.2 |
| 40-45 |
42 |
44 |
45 |
95 |
92 |
97 |
4.87 |
7.8 |
4.0 |
1.43 |
1.3 |
| <40 |
37 |
47 |
38 |
93 |
94 |
93 |
4.84 |
8.6 |
4.8 |
1.43 |
1.2 |
Stuff+
Comparison of Stuff+’s Stuff+ to Other Metrics
| Range |
Pitching+ |
Stuff+ |
Location+ |
botOvr |
botStf |
botCmd |
ERA |
K/9 |
BB/9 |
WHIP |
HR/9 |
| >130 |
111 |
137 |
102 |
65 |
68 |
54 |
2.38 |
12.5 |
2.6 |
0.92 |
0.9 |
| 125-130 |
107 |
127 |
100 |
61 |
65 |
52 |
2.97 |
12.0 |
3.4 |
1.12 |
1.0 |
| 120-125 |
106 |
121 |
99 |
61 |
65 |
52 |
3.02 |
10.2 |
3.3 |
1.12 |
0.7 |
| 115-120 |
106 |
117 |
101 |
60 |
62 |
54 |
3.24 |
10.8 |
3.3 |
1.14 |
0.9 |
| 110-115 |
104 |
112 |
100 |
58 |
57 |
54 |
3.25 |
10.0 |
3.2 |
1.16 |
1.0 |
| 105-110 |
102 |
107 |
100 |
54 |
54 |
52 |
3.63 |
9.5 |
3.2 |
1.20 |
1.0 |
| 100-105 |
100 |
102 |
100 |
52 |
51 |
52 |
3.87 |
9.1 |
3.4 |
1.25 |
1.1 |
| 95-100 |
99 |
97 |
100 |
52 |
49 |
53 |
4.17 |
8.4 |
3.2 |
1.30 |
1.2 |
| 90-95 |
98 |
92 |
100 |
49 |
45 |
53 |
4.49 |
8.0 |
3.2 |
1.33 |
1.3 |
| 85-90 |
96 |
87 |
100 |
49 |
44 |
53 |
4.78 |
7.4 |
3.3 |
1.41 |
1.3 |
| 80-85 |
95 |
82 |
100 |
48 |
41 |
53 |
4.64 |
6.9 |
2.9 |
1.38 |
1.4 |
| 75-80 |
94 |
78 |
101 |
46 |
38 |
54 |
4.64 |
6.8 |
3.0 |
1.39 |
1.3 |
| <75 |
92 |
70 |
101 |
46 |
37 |
55 |
5.97 |
6.0 |
2.9 |
1.54 |
1.6 |
Comparison of Stuff+’s Command+ to Other Metrics
| Range |
Pitching+ |
Stuff+ |
Location+ |
botOvr |
botStf |
botCmd |
ERA |
K/9 |
BB/9 |
WHIP |
HR/9 |
| 105-110 |
105 |
104 |
106 |
61 |
50 |
63 |
3.49 |
8.9 |
2.0 |
1.13 |
1.1 |
| 100-105 |
102 |
101 |
102 |
55 |
50 |
56 |
3.83 |
8.9 |
2.8 |
1.22 |
1.1 |
| 95-100 |
98 |
100 |
97 |
50 |
52 |
48 |
4.14 |
8.8 |
3.8 |
1.32 |
1.1 |
| 90-95 |
96 |
104 |
93 |
45 |
57 |
41 |
4.44 |
9.9 |
5.1 |
1.44 |
1.0 |
| 85-90 |
95 |
106 |
87 |
41 |
63 |
33 |
4.32 |
11.3 |
5.3 |
1.26 |
0.8 |
Comparison of Stuff+’s Pitching+ to Other Metrics
| Range |
Pitching+ |
Stuff+ |
Location+ |
botOvr |
botStf |
botCmd |
ERA |
K/9 |
BB/9 |
WHIP |
HR/9 |
| >115 |
116 |
140 |
105 |
72 |
69 |
60 |
2.35 |
12.3 |
1.7 |
0.83 |
0.9 |
| 110-115 |
111 |
125 |
104 |
67 |
64 |
59 |
2.84 |
11.3 |
2.4 |
1.00 |
0.9 |
| 105-110 |
107 |
114 |
102 |
61 |
58 |
57 |
3.16 |
10.2 |
2.7 |
1.10 |
1.0 |
| 100-105 |
102 |
104 |
101 |
55 |
53 |
54 |
3.65 |
9.2 |
3.1 |
1.22 |
1.0 |
| 95-100 |
97 |
94 |
99 |
49 |
47 |
51 |
4.30 |
8.2 |
3.5 |
1.33 |
1.2 |
| <95 |
93 |
87 |
96 |
43 |
44 |
46 |
5.38 |
7.5 |
4.1 |
1.51 |
1.4 |
Looking over the information, both of the “Stuff” values seems to generally catch what each is trying to describe. The stuff values corelate to strikeouts and the command/location grades point walk rate.
After reading through the definitions of how the batted ball data is collected, I expected the Bot values to have a larger variance in the StatCast values (linked spreadsheet). That concept wasn’t the case and there ended up being almost not correlation to any of the measures to actually limiting hard contact. With hard contact not being predictive, I was surprised when I got to WHIP.
How much WHIP changed in the two “Stuff” models was almost too good to be true. In both cases, the walk rate increased as a pitcher’s stuff got better, but the hit suppression was so large that the WHIP declined.
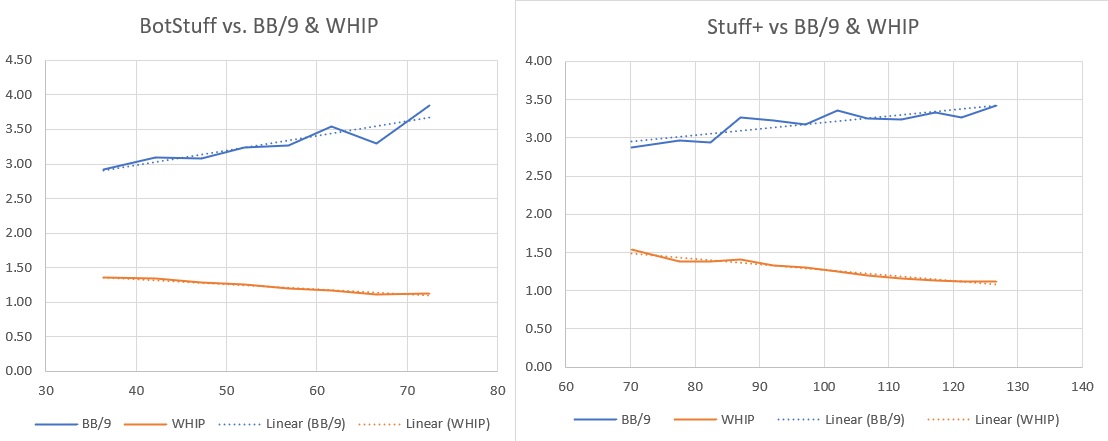
The ability to detect hit suppression is on another scale than has ever been measured. It’s almost too good to be true.
Overall, I see two major issues with the stuff metrics:
- The formulas behind the values is a black box so there is no way to back check the results. Also, the calculations are constantly changing so it’s tough to know which formula is being used. It’ll be impossible to incorporate the information if it keeps changing
- The pitch model metrics are trained off of just the 2021 and 2022 data. Of course the data is going to almost lineup perfectly for now. It’ll be interesting to see how they hold up this season and three to four seasons down the road.
The next step for me will be to dive into the small sample of 2023 data. Does the near perfect accountability of all batted ball outcomes continue based on just pitch metrics or were the metrics correlated too close to the actual results I’m examining.
I did get a few questions answered but working through these Pitch Quality Models but I generated a ton more. As I get time, I’ll keep diving into the subject to see what is usable going forward.