Archive for Meta Analysis

Intentional Walk Decline: Let MLB Teams Do the Scouting

Fiddle Farts. I’ve been diving deep into my to-do list hoping for a study to verify nothing. This study was not a quick-and-easy one. I’m surprised how much can be gleaned from a small drop in a hitter’s intentional base-on-balls (IBB).

When examining intentional walks, it’s not like canoeing across a calm flat lake with no dangers. Instead, it’s more of a white water rafting with no rest or the end in sight.

Two types of hitters normally see a drop in intentional walks, great hitters on the decline and the eighth hitter in National League parks. Of the 776 intentional walks last season, 410 came from the third (104), fourth (123), and eighth (183) spots in the lineup. It’s a player pool of just the once best and now worst hitters in the league.
Read the rest of this entry »

Batted Ball Analysis: Marte, Bell, Davis, & Ramirez

Yesterday, I introduced Hard Hit Launch Angle (HHLA) and Average Hard Hit Difference (AHHD) after reading a report from Driveline Baseball. After working my way through much of the boring but necessary background information, I’m now going to dive into some players to help explain some of their changes in production. In several cases, nothing was obvious with previous stats, but the two new measures helped a ton to explain some changes. Here is an examination of four hitters who broke out or busted last season.

For the analysis, I’m debuting new comparison graphs. They are monthly StatCast data is plotted against:

  • Average Launch Angle
  • Average Exit Velocity
  • Max Exit Velocity
  • Hard Hit Launch Angle: The average launch angle for all batted balls hit over 98 mph.
  • Average Hard Hit Difference: The difference between the HHLA and the angle for the sub-98 mph hits. From yesterday’s research, hitters start to see a production decline at a 0 AHHD and it accelerates around -4.4 AHHD. Basically, the batter is trying to get too much loft and his batted balls are going for weak flyouts.

I’m plotting the best-fit curves using the LOWESS (LOcally WEighted Scatter-plot Smoother) method. The curves use the nearest data points to create a best-fit line. Additionally, I’ve weighted the curve by the monthly batted balls. These values are represented by the dot size in each graph.

Read the rest of this entry »


A Batter’s Hard Hit Angle: Introduction

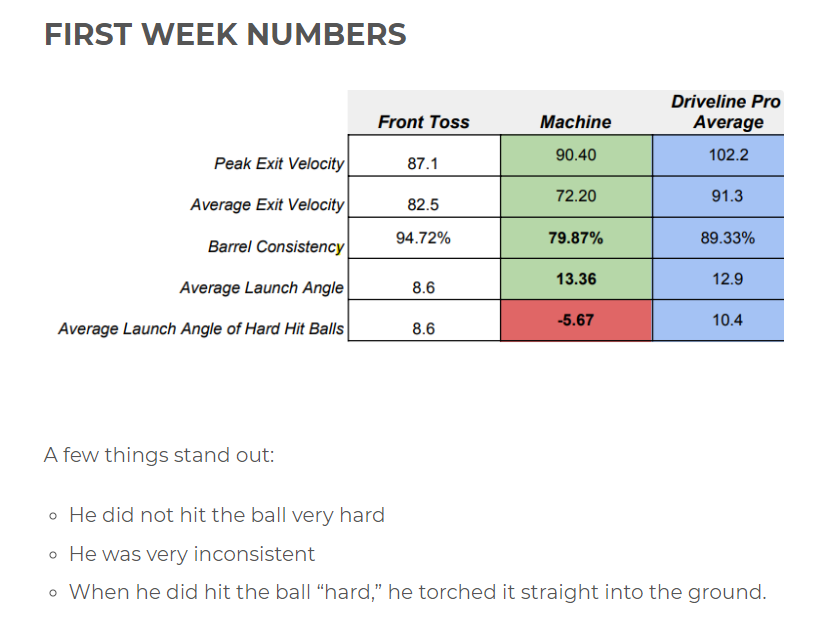
I had no idea who Dylan Moser was. In all respects to Dylan and his family, I still don’t. When I saw an article about him come through my feed, I was interested in how Tanner Stokey described Driveline Baseball’s evaluation of Moser. While Driveline has its own advocates and critics, it pushes the research bounds so I wanted to see what they considered important about Mr. Moser. Immediately, I saw this little nugget.

The “Average Hit Angle of Hard Hit Balls” caught my eye and I’ve been investigating its implications ever since.

Determining and finding the effectiveness of a hitter’s launch angle spread has been investigated several times in the past. Andrew Perpetua pointed out the importance of High Line Drives (a close cousin to Barrels) and how too much of an uppercut can hurt a player’s production. Alex Chamberlain and Brock Hammit both found a link between the standard deviation in launch angle and increased production.
Read the rest of this entry »


Prospect Scouting & Stats — Pitcher CB – Present

We continue our look at prospect pitch grades, this time moving along to the curveball. Now, I present to you the top 7 pitchers in Curveball – Present (CP) grade, as sorted first by grade, and then by FV. I only included pitchers with a 60 grade CP and at least a 45+ FV grade.

Read the rest of this entry »


Prospect Scouting & Stats — Pitcher SL – Present

Yesterday was the start of our look at prospect pitcher individual pitch grades, as I began with the fastball. Today, let’s move on to the slider. Now, I present to you the top 8 pitchers in Slider – Present (SP) grade, as sorted first by grade, and then by FV.

Read the rest of this entry »


Prospect Scouting & Stats — Pitcher Pitch Grades & Strikeout Rate Part 2

Yesterday I began diving into prospect pitch grades and strikeout rate. Today, I’m going to share correlations with some additional pieces of data we might want to use to help project a prospect’s strikeout potential.

Read the rest of this entry »


Prospect Scouting & Stats — Pitcher Pitch Grades & Strikeout Rate

After concluding our look at hitter prospect scouting grades and stats, it’s time to flip on over to pitchers. I’ll begin by looking at the pitch type grades, strikeout rates, and SwStk% marks. First, let’s see how these pitch grades correlate with those two metrics.

Read the rest of this entry »


Prospect Scouting & Stats — Hitter Hit Tool

For the last week and a half, I have looked at prospect scouting power grades and stats. Today, we move along to prospect scouting hit tool grades. While power grades are pretty clearly meant to forecast a prospect’s Major League ISO and/or HR/FB rates, it’s not entirely obvious to me what a Hit grade is meant to tell us.

Is it indicative of underlying skills relating to hitting ability, such as walk/strikeout rates, along with BABIP, or is it more of the ultimate result of those skills, such as batting average and/or on base percentage? From perusing through Kiley McDaniel’s old articles back in 2014 explaining the scouting grades, it seems like OBP is the intent, but I’m not 100% sure. Either way, let’s dive into the correlations between the present and future hit grades with the various underlying hitting talent skills and results.

Read the rest of this entry »


Prospect Scouting & Stats — Hitter Raw Power – Present

Today I continue the Prospect Scouting & Stats series, sticking with hitter power, but moving to raw power grades. We’ll start with raw power in the present (RPP) and then tomorrow will look at raw power in the future. Let’s discuss the 17 hitters that earned an RPP grade of at least 70. As a reminder, the table is sorted by RPP and then FV.

Read the rest of this entry »


Prospect Scouting & Stats — Hitter Game Power – Future

Yesterday, I listed and discussed the 20 prospects who earned a Game Power – Present (GPP) grade of at least 50. Today, I shift the future and will list and discuss 19 prospects who earned a Game Power – Future (GPF) grade of at least 60 and earned an FV of at least 50. Since the number of 60+ GPF players was 39, I wanted to narrow down the least to make it a similar size as the GPP list.

Read the rest of this entry »