Archive for Injuries

Pitcher IL Chances … Again

I had no plans to write or investigate pitcher injuries again. I’ve done it several times in the past with similar results. Since I needed the same information to investigate if an often injured pitcher ages faster as I did with hitters, I had the data available so why not take another stab at projecting pitcher injury risks with a few different inputs.

For a refresher, here are some of my previous findings:

The small data difference is that instead of limiting the IL days to the previous one to three seasons, I’m just using the accumulated days. Also, I tracking the number of times the pitcher went on the IL for an arm, elbow, or shoulder injury. The two different factors are joined by fastball velocity, Zone%, and age to see what leads to injuries the next season.

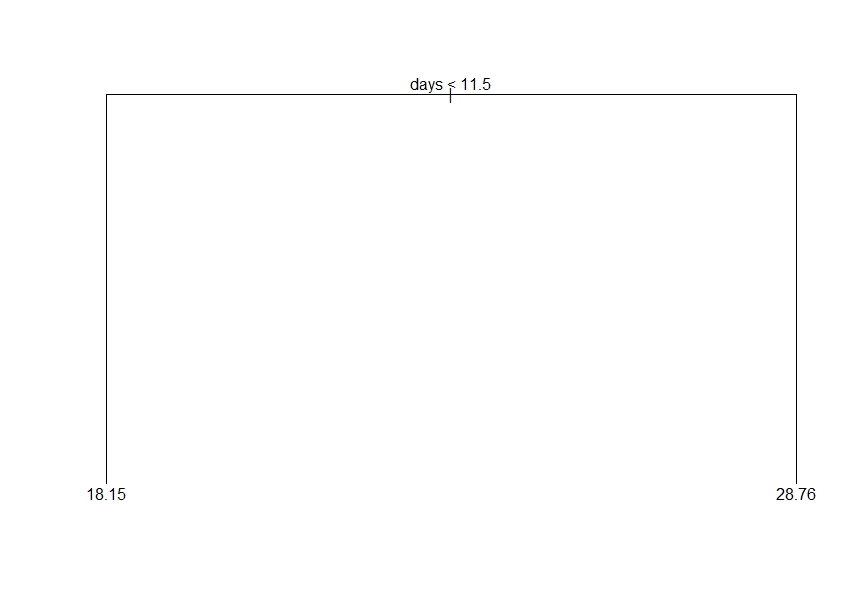
I took all the data from all the pitchers and ran it through a Trees analysis and got the following chart.

This image sums up pitcher injuries perfectly. The best predictor of future injuries is past injuries. And just because a pitcher had never been on the IL, on average, they will still spend ~18 days on it. It’s just re-enforcing common sense backed up by study after study.

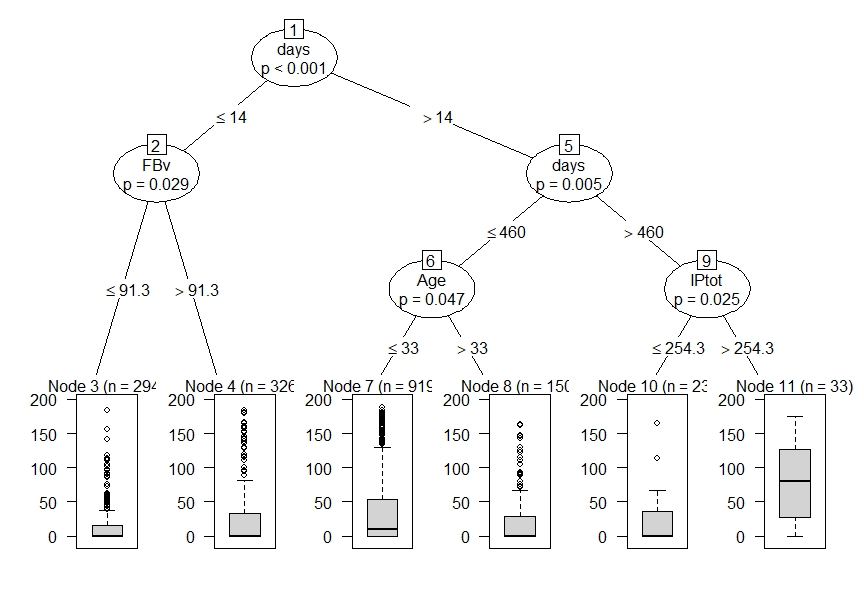
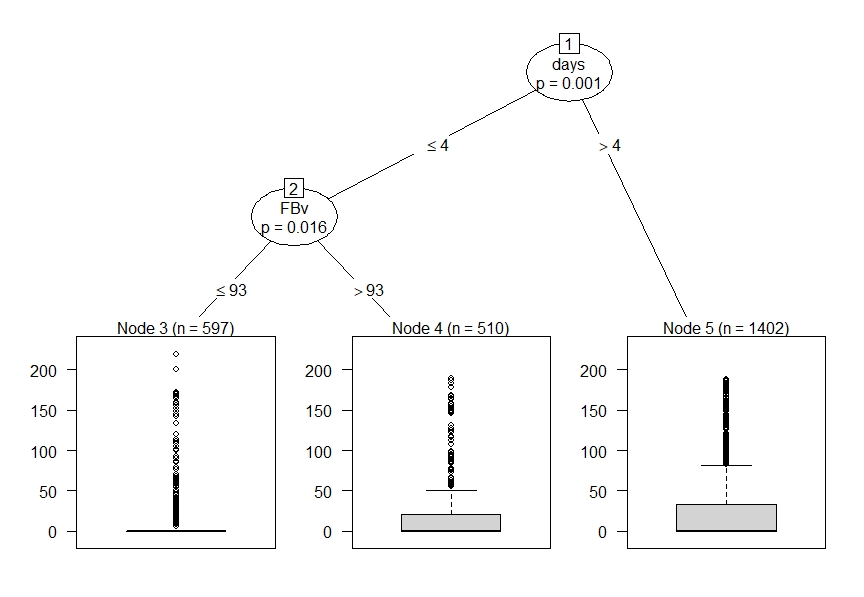
From my previous work, the injury rates between starters and relievers (i.e. starters who can’t stay healthy) are drastically different. For that reason, I ran the analysis splitting out starters (GS/G >= .5) from relievers (GS/G < .5). Here are the two decision trees.

Starters

Relievers

We have some further division taking place fastball velocity on both, a further out 460-day threshold for starters, and age requirement. I’m not a huge fan of the multi-branched tree with many variables. I’m all for keeping it simple. Using the above variables, I cut and diced the data into several possible combinations and came up with the following divisions.

Pitcher IL Chances
Starters Relievers
Category Avg IL Days IL Chances Count Avg IL Days IL Chances Count
0 IL, <= 93 mph 17 28% 463 13 22% 728
0 IL, > 93 mph 28 45% 141 20 32% 628
> 0 IL, <= 93 mph 31 49% 857 23 37% 832
> 0 IL, > 93 mph 34 57% 268 27 43% 668
> 460 days 55 63% 59

Again, the rates are similar to my previous findings. The only changes are the pitch velocity groupings and that rough over-460 IL day group who average two months on the IL a year. For me, I focus on starters and will designate the starters into three risk groups:

  • Low: No IL, low velo.
  • Medium: No IL, high velo, and some IL, low velo.
  • High: Some IL, high velo, and high IL.

Not all injuries can be avoided, but the injury downside is just another factor to consider when setting each pitcher’s fantasy value.

And what’s a study without the players to consider for the upcoming season. Here are the historic IL days and fastball velocity for any pitcher with 10 starts last season.

2020 Starters Group by Historic IL Days & Fastball Velocity
Name Age 2019 IP Combined IL Days FBv
Ryan Yarbrough 28 141 0 88.2
Nick Margevicius 24 57 0 88.3
Alex Young 26 83 0 89.3
Trevor Richards 27 135 0 90.9
Adam Plutko 28 109 0 91.1
Dillon Peters 27 72 0 91.1
Dario Agrazal 25 73 0 91.2
Jose Quintana 31 171 0 91.4
Asher Wojciechowski 31 82 0 91.6
Jaime Barria 23 82 0 91.7
Jose Suarez 22 81 0 91.8
Merrill Kelly 켈리 31 183 0 91.9
Matthew Boyd 29 185 0 92.0
Tanner Roark 33 165 0 92.1
Ariel Jurado 24 122 0 92.4
Yusei Kikuchi 29 161 0 92.5
Aaron Civale 25 57 0 92.6
Peter Lambert 23 89 0 92.7
Jose Berrios 26 200 0 92.8
Zac Gallen 24 80 0 92.9
David Hess 26 80 0 93.0
Shane Bieber 25 214 0 93.1
Brad Keller 24 165 0 93.4
Miles Mikolas 31 184 0 93.6
Brendan McKay 24 49 0 93.7
Dakota Hudson 25 174 0 93.7
Chris Paddack 24 140 0 93.9
Jack Flaherty 24 196 0 93.9
Zach Plesac 25 115 0 94.0
Tyler Beede 27 117 0 94.3
Adrian Houser 27 111 0 94.4
Cal Quantrill 25 103 0 94.5
Mitch Keller 24 48 0 95.4
Sandy Alcantara 24 197 0 95.6
Luis Castillo 27 190 0 96.5
Dylan Cease 24 73 0 96.5
Kyle Hendricks 30 177 66 86.9
Mike Leake 32 197 51 88.4
Dallas Keuchel 32 112 63 88.4
Zach Davies 27 159 120 88.5
Marco Gonzales 28 203 15 88.9
CC Sabathia 39 107 364 89.2
Gio Gonzalez 34 87 80 89.3
Jerad Eickhoff 29 58 284 89.5
Felix Hernandez 34 71 313 89.6
Julio Teheran 29 174 28 89.7
Zack Greinke 36 208 188 90.0
Jhoulys Chacin 32 103 300 90.0
Joey Lucchesi 27 163 36 90.2
Jon Lester 36 171 162 90.3
Mike Fiers 35 184 11 90.4
Clayton Kershaw 32 178 217 90.4
Clayton Richard 36 45 370 90.4
Rick Porcello 31 174 27 90.5
Wade Miley 33 167 83 90.5
Jordan Zimmermann 34 112 289 90.5
Anibal Sanchez 36 166 427 90.5
Dereck Rodriguez 28 99 7 90.6
Elieser Hernandez 25 82 53 90.6
Daniel Norris 27 144 357 90.8
Dylan Bundy 27 161 30 91.2
Drew Smyly 31 114 355 91.2
Trevor Williams 28 145 33 91.3
J.A. Happ 37 161 263 91.3
Madison Bumgarner 30 207 153 91.4
Ross Detwiler 34 69 165 91.4
Cole Hamels 36 141 182 91.4
Tyler Skaggs 28 79 430 91.4
Jakob Junis 27 175 13 91.5
Jordan Yamamoto 24 78 27 91.5
Masahiro Tanaka 31 182 157 91.5
Jacob Waguespack 26 78 35 91.6
Caleb Smith 28 153 117 91.6
John Means 27 155 24 91.8
Eric Lauer 25 149 30 91.9
Kyle Freeland 27 104 51 91.9
Jeff Samardzija 35 181 139 91.9
Patrick Corbin 30 202 272 91.9
Steven Brault 28 113 31 92.0
Aaron Brooks 30 110 183 92.0
David Price 34 107 199 92.0
Kenta Maeda 32 153 37 92.1
Chi Chi Gonzalez 28 63 182 92.2
Brad Peacock 32 91 257 92.2
Erick Fedde 27 78 88 92.3
Joe Musgrove 27 170 76 92.4
Robbie Ray 28 174 94 92.4
Ivan Nova 33 187 299 92.4
Danny Duffy 31 130 414 92.4
Mike Soroka 22 174 129 92.5
Jake Arrieta 34 135 140 92.5
Marcus Stroman 29 184 217 92.5
Andrew Heaney 29 95 419 92.5
Shaun Anderson 25 96 16 92.6
Jordan Lyles 29 141 252 92.6
Mike Minor 32 208 397 92.6
Trent Thornton 26 154 11 92.9
Jake Odorizzi 30 159 75 92.9
Aaron Nola 27 202 143 92.9
Eduardo Rodriguez 27 203 162 93.1
Michael Wacha 28 126 227 93.1
Chris Sale 31 147 121 93.2
Matt Harvey 31 59 433 93.2
Tyler Mahle 25 129 33 93.3
Kyle Gibson 32 160 57 93.3
Sonny Gray 30 175 96 93.3
Chase Anderson 32 139 96 93.4
Edwin Jackson 36 67 148 93.4
Steven Matz 29 160 244 93.4
Glenn Sparkman 28 136 89 93.5
Chris Bassitt 31 144 290 93.5
Carlos Carrasco 33 80 432 93.5
Domingo German 27 143 25 93.6
Pablo Lopez 24 111 108 93.6
Zach Eflin 26 163 122 93.6
Aaron Sanchez 27 131 299 93.6
Taylor Clarke 27 84 16 93.7
Antonio Senzatela 25 124 29 93.7
Jeff Hoffman 27 70 31 93.7
Spencer Turnbull 27 148 32 93.8
Max Fried 26 165 52 93.8
Griffin Canning 24 90 53 93.9
Yonny Chirinos 26 133 81 93.9
Luke Weaver 26 64 117 93.9
Andrew Cashner 33 150 375 93.9
Stephen Strasburg 31 209 421 93.9
Kevin Gausman 29 102 117 94.0
Chris Archer 31 119 92 94.1
Vince Velasquez 28 117 144 94.1
Martin Perez 29 165 377 94.1
Lance Lynn 33 208 249 94.2
Lucas Giolito 25 176 30 94.3
Dylan Covey 28 58 131 94.4
Trevor Bauer 29 213 38 94.6
Justin Verlander 37 223 69 94.7
Anthony DeSclafani 30 166 318 94.7
Max Scherzer 35 172 64 94.9
Mike Foltynewicz 28 117 84 94.9
Reynaldo Lopez 26 184 14 95.5
German Marquez 25 174 38 95.5
Mike Clevinger 29 126 79 95.5
James Paxton 31 150 361 95.5
Blake Snell 27 107 79 95.6
Jose Urena 28 84 124 95.9
Jon Gray 28 150 136 96.1
Dinelson Lamet 27 73 289 96.1
Brandon Woodruff 27 121 57 96.3
Walker Buehler 25 182 16 96.6
Frankie Montas 27 96 183 96.6
Jacob deGrom 32 204 32 96.9
Tyler Glasnow 26 60 155 97.0
Gerrit Cole 29 212 143 97.2
Noah Syndergaard 27 197 213 97.7
Zack Wheeler 30 195 460 96.7
Nathan Eovaldi 30 67 470 97.5
Yu Darvish 33 178 492 94.2
Michael Pineda 31 146 511 92.6
Charlie Morton 36 194 551 94.4
Hyun-Jin Ryu 류현진 33 182 558 90.6
Adam Wainwright 38 171 618 89.9
Homer Bailey 34 163 626 93.0
Jason Vargas 37 149 657 84.3
Rich Hill 40 58 667 90.3
Clay Buchholz 35 59 717 89.5
Brett Anderson 32 176 918 90.8

Notes

  • The pitcher with the highest velocity and IL experience is Noah Syndergaard. That 2020 IL stint didn’t take long.
  • The oldest starter to never have been on the IL is Tanner Roark at 33.
  • Darvish and Morton are going as the 17th and 18th pitchers even though they’ve broken the 460-day threshold.
  • Just go and scroll through the starters who have been on the IL and throw over 93-mph, especially over 95. Lots of them have spent considerable time on the IL over their careers. I’m thinking to target “safer” but elite starters if given the opportunity like Corbin, Bieber, Kershaw, Castillo, and Flaherty. There is no way to completely stay away from the injury risk but why not add a pitcher with a 28% chance (Boyd) than someone with a 63% chance (Ryu)

These conclusions were about 80% in line with what I expected with fastball velocity nudging itself in. Next up will be taking this information and seeing if a higher injury rate ages pitchers more than projected.


Batter Injuries and Future Performance

Predicting hitter injuries has been a fool’s errand for me. Besides players with chronic injuries (e.g. Albert Pujols and Ryan Braun), others and myself have made little headway in the field. With few guidelines, many fantasy analysts and owners handle hitter injuries differently. Previously, I focused on a hitter’s recent injury history. This time I attempted a different approach and used the hitter’s career IL days. In the end, I found a useful and easy to remember injury threshold.

For the study, I examined hitters from the 2010 to 2018 seasons. I have IL data going back to 2002, so I hoped the preceding eight years of data would get most of the hitter’s 2010 career total. Additionally, I needed the next season (e.g. 2019) to compare results. Additionally, I set a minimum hitting threshold (100 PA) to include at least some semi-regulars. I know I may miss a hitter who is out the whole season, but the two-week callups were diluting the results. In all, I ended up with a sample of 2365 player seasons.
Read the rest of this entry »


Paxton Out 3-4 Months; Stripling to LAA

The New York Yankees announced that top starter James Paxton will be out at least 3-4 months after undergoing a microscopic lumbar discectomy to remove a peridiscal cyst. It’s absolutely brutal news for the 31-year old lefty, who has battled injuries throughout his career as Jay Jaffe outlined in his piece about the injury. It does look like the timeline is for his return to the field so late-May/early-June is the target, but I’d plan for mid-to-late June just to be safe.

In leagues with IL spots, I have no real issue stashing him, even if it were for the full three months of the regular season. His price will plummet, and you need to decide where you’re comfortable grabbing him as a stash. There was only one NFBC draft last night after the news and he went 224th, which put him around the likes of Ian Kennedy, Giovanny Gallegos, and Griffin Canning as far as pitchers. Now it’s worth noting that the NFBC doesn’t have IL spots so anyone drafting him must eat one of their seven reserve spots.

Read the rest of this entry »


Playing Through an Injury Hurts Future Performance

I was wrong. About seven years ago, I wrote on how hitters may overperform their projections since they played through an injury. The injury hampered their production in the season in question, lowered the future projection, and created a buying opportunity. For years, I believed this steadily until last season when I re-ran the numbers and found “jack squat”.

Earlier this week, I examined some of this past season’s hitters who fought through the pain and felt a deeper analysis was needed. I dove in and the results were backwards. I found no bounceback should be expected from hitters who played through injuries, but there is more. For those hitters who play through the discomfort, their future production will take a major hit.

The key to uncovering the following results was getting a usable dataset which is easier said than done. Many of the injuries I’m using for the analysis aren’t well documented, if at all. Real men play baseball and they play hurt because that is what real men do and most importantly, they don’t complain about. Besides the machismo, a player has every right to keep his medical data to himself so vagueness thrives. Simply, there is no good available data. Even with the hurdles, I dug into each of the hitters who were reported to have played through an injury the past three seasons (2017, 2018, 2019).

Read the rest of this entry »


Projection Altering Hitter Injuries

I’ve had a semi-fixation on hitters playing through injuries and how the diminished production could hamper the next season’s projection. At first, I found some correlation. Then, I didn’t. One possible answer to there being no bounceback is that the injury becomes chronic and the hitter never improves. Or the dataset could be too small.

I want to dive further into the subject, but the information around injuries is sketchy at best. Most of the time, there are no usable details. The lack of an answer means that I should stop coming back to the subject but I’m stubborn.

Very.

I’m going to go through this past season’s hitters. The dive has a couple of goals. One is to create a better dataset for future reference. The second is to understand why some hitters may have struggled when creating a profile. And just maybe, I’ll find out if I can put to rest the notion that hitters who played through injuries are under projected.
Read the rest of this entry »


Injured Hitters: Projection Adjustments

Historically, I’ve “corrected” hitter projections to my own liking and every time I’ve backtested them to the actual results, my adjustments have failed miserably. So why create more work when the end results make my final product worse? Am I a glutton for punishment? In all fairness, I’m sure a heavy dose of Dunning-Kruger is going on but I also believe there may be a sweet spot where personal scouting can come into play. Today, I’m going back to the well one more time to see if some injured hitters should have more encouraging projections because they may have played hurt.

First, I’ve always thought playing through an injury meant that the team and the player were accepting suboptimal production. Then the player could come back healthy and full productive the next season.
Read the rest of this entry »


At What Age is a Hitter’s Projection No Longer Reliable?

I blame my podcat mate Rob Silver for today’s study. First, he stated this:

And then he said this:

Of course, players age. Some quickly. Some not as fast. While few hitters remain productive into and past their mid-30’s, I needed a simple rule on how to deal with these vets. I found one and since I need to provide content to be paid, so does the world.
Read the rest of this entry »


Does Postseason Play Hamper Future Production?

There is no need to beat around the bush with an intro full of cliches and examples. Simply does playing in the postseason wear down a player enough to effect their next season’s production?

Simple answer: Not really.

Less simple answer: Some with hitters, not at all with pitchers.

Complex answer: Danger math.

Read the rest of this entry »


Effect on Hitter Production From an Early Season Injury

When I wrote my article on disappointing 2019 hitters, the data diverged from expectations in one subset of hitters. Injured players dominated the list but they also saw a huge drop in their production to the tune of about 100 points of OPS. While the season-to-season OPS values are never exactly one-for-one, a 100 point dropped is huge especially since the league’s overall OPS jumped 30 points last season. I needed to dig in.

It’s going to get a little nerdy as I have to explain how I examined the data. To try to minimize the pre and post-injury production from the investigation, I only looked at players who were placed on the IL in March or April. Little if any of their production should have been before the injury. A second reason was to help project hitters who are dealing with offseason surgeries (e.g. Adalberto Mondesi). So, over the past 10 seasons, 627 hitters met these criteria.
Read the rest of this entry »


Don’t Forget About These Injured Arms for 2020

Some of the best draft day values can be injured arms who missed all or most of the previous season, taking them off the radar of many fantasy mangers. Some of these guys will fly up draft boards with a strong spring, but others will remain afterthoughts throughout draft season. Here are 10 injured arms to keep in mind for 2020:

Lance McCullers Jr. | Tommy John surgery (Nov ’18)

By having his TJ in November of 2018, McCullers will get the extended 16-month recovery time before returning. This will give him a chance at a full season in 2020, though it’s worth noting that his MLB-high is 128.3 innings so he has to show that he can make it through a full 30 starts in the first place. His #TooEarlyMock (TEM) price was 253 on average (71st among SPs), but it will rise quite a bit with a healthy spring. McCullers is a great target for early drafters on price alone.

Read the rest of this entry »