Effect on Hitter Production From an Early Season Injury
When I wrote my article on disappointing 2019 hitters, the data diverged from expectations in one subset of hitters. Injured players dominated the list but they also saw a huge drop in their production to the tune of about 100 points of OPS. While the season-to-season OPS values are never exactly one-for-one, a 100 point dropped is huge especially since the league’s overall OPS jumped 30 points last season. I needed to dig in.
It’s going to get a little nerdy as I have to explain how I examined the data. To try to minimize the pre and post-injury production from the investigation, I only looked at players who were placed on the IL in March or April. Little if any of their production should have been before the injury. A second reason was to help project hitters who are dealing with offseason surgeries (e.g. Adalberto Mondesi). So, over the past 10 seasons, 627 hitters met these criteria.
Then, I started cutting and dicing the data up and quickly found that those who played more didn’t see a drop in their production. I divided up the hitters into actual plate appearance groups. With each group, I found their median, average, and the weighted average difference in actual OPS subtracted from their Steamer projections. At the lower plate appearance thresholds, I needed to use the median and weighted values since a single extreme value could throw off the entire group. Here are the data in table and graph form.
| PA Range | Median | Average | Weighted | Count |
|---|---|---|---|---|
| 1 to 99 | -.169 | -.179 | -.133 | 138 |
| 100 to 199 | -.049 | -.048 | -.042 | 107 |
| 200 to 299 | -.031 | -.030 | -.028 | 104 |
| 300 to 399 | -.019 | -.006 | -.006 | 102 |
| 400 to 499 | .001 | .011 | .012 | 81 |
| 500 to 599 | -.008 | -.002 | -.002 | 77 |
| > 600 | .003 | .030 | .030 | 20 |

For the hitters who came back and played a full or near full season, their production barely dropped. Once a hitter had under 300 PA for the year, their actual minus projected production started dropping fast. Those hitters who showed up for just a few at-bats were by far the biggest disappointments.
I was worried there was some survivor bias in this approach. If a hurt, borderline, major league talent comes off the IL and struggles for just a bit, his team is going to send him to the minors to work it out. To try to remove some of this bias, I grouped the hitters by actual minus projected plate appearances.
If a replacement-level player came off the IL, stunk it up, and was demoted, he would be grouped in one of the smaller plate appearance groups because nothing was expected of him to start the season. From these groupings, I again found the median, average, and weight average OPS difference.
| PA by Missed Expectations | Median | Average | Weighted | Count |
|---|---|---|---|---|
| >= 400 | -.236 | -.236 | -.159 | 25 |
| -300 to -399 | -.096 | -.113 | -.079 | 47 |
| -200 to -299 | -.050 | -.069 | -.043 | 81 |
| -100 to -199 | -.069 | -.084 | -.040 | 134 |
| 0 to -99 | -.019 | -.029 | -.002 | 168 |
| >0 | .009 | .005 | .026 | 173 |
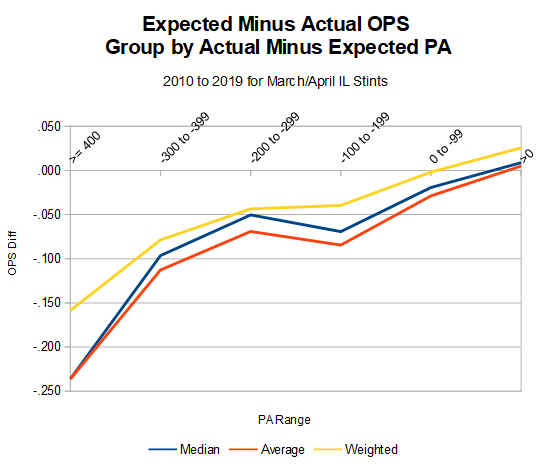
Even a hitter missing 100 expected PA starts to see drop in production and it only gets worse.
One observation I had was that maybe the hitters come off the IL, struggle for a bit, and then eventually get going. To test this, I took the hitters who played in May and then in the second half. In all, 338 hitters met these criteria. Here is how they performed.
| Projected compared to: | Median | Average | Weighted |
|---|---|---|---|
| May | -.027 | -.024 | -.012 |
| Full season | -.015 | -.013 | .001 |
| 2H | -.013 | -.024 | .006 |
Note: Ignore the average column since these types of results is why I used the median and weighted values.
The results came out as expected with hitters struggling for a bit, but got healthy and more productive as the season progressed. The differences are similar to those who missed there expected games by 100 or less, which would be most of those who returned in May. It wasn’t a huge drop though as seen with the other groups.
It really looks like fantasy owners should expect hitters who miss over a month to struggle when they return. While I’d adjust the values based on the individual situation, I feel comfortable lowering a hitter’s projection based on the following time frames missed.
Note: I’ve previously determined how much to adjust a hitter’s expected production for an OPS change so these adjustments can be worked into a fantasy projection.
Actual/Expected Time Missed: OPS projection adjustment
- 100 to 299 PA: -.040
- 300 to 399 PA: -.080
- > 400 PA: -.160
While I probably rely too much on projections, I don’t like to willy-nilly adjust a hitter who is in an unknown circumstance. I should try to find similar hitters. In this case, there is now a point of reference to adjust an injured hitter’s projection. And knowing is half the battle.
Jeff, one of the authors of the fantasy baseball guide,The Process, writes for RotoGraphs, The Hardball Times, Rotowire, Baseball America, and BaseballHQ. He has been nominated for two SABR Analytics Research Award for Contemporary Analysis and won it in 2013 in tandem with Bill Petti. He has won four FSWA Awards including on for his Mining the News series. He's won Tout Wars three times, LABR twice, and got his first NFBC Main Event win in 2021. Follow him on Twitter @jeffwzimmerman.
Jeff, you are one percent inspiration and 99 percent perspiration. Congrats.
Usually I find nothing. I was happy with these results.