Pitcher IL Chances … Again
I had no plans to write or investigate pitcher injuries again. I’ve done it several times in the past with similar results. Since I needed the same information to investigate if an often injured pitcher ages faster as I did with hitters, I had the data available so why not take another stab at projecting pitcher injury risks with a few different inputs.
For a refresher, here are some of my previous findings:
- Previous injuries, age, and workload matter.
- A low Zone% is a precursor to injuries
- High fastball velocity, not pitch type, leads to injuries.
- Shoulder and elbow injuries can linger for a while.
The small data difference is that instead of limiting the IL days to the previous one to three seasons, I’m just using the accumulated days. Also, I tracking the number of times the pitcher went on the IL for an arm, elbow, or shoulder injury. The two different factors are joined by fastball velocity, Zone%, and age to see what leads to injuries the next season.
I took all the data from all the pitchers and ran it through a Trees analysis and got the following chart.
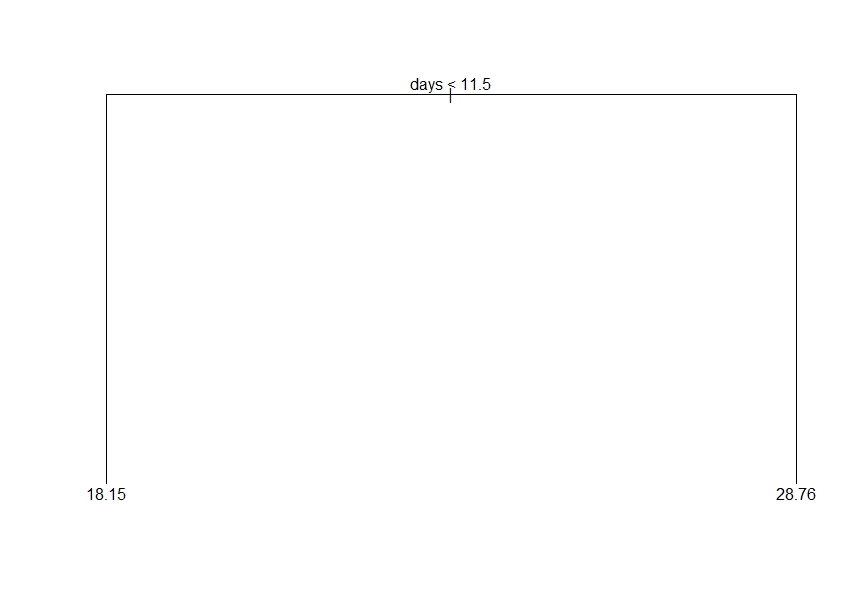
This image sums up pitcher injuries perfectly. The best predictor of future injuries is past injuries. And just because a pitcher had never been on the IL, on average, they will still spend ~18 days on it. It’s just re-enforcing common sense backed up by study after study.
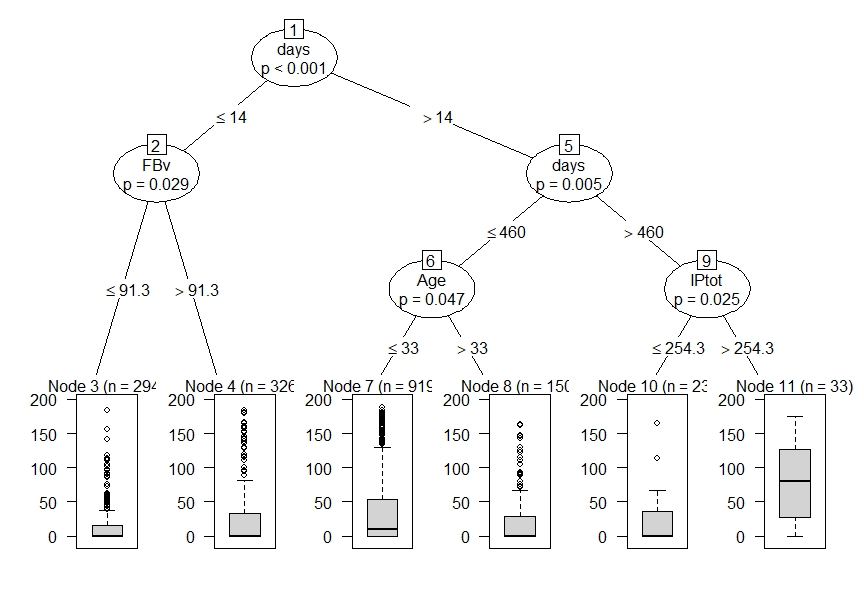
From my previous work, the injury rates between starters and relievers (i.e. starters who can’t stay healthy) are drastically different. For that reason, I ran the analysis splitting out starters (GS/G >= .5) from relievers (GS/G < .5). Here are the two decision trees.
Starters
Relievers
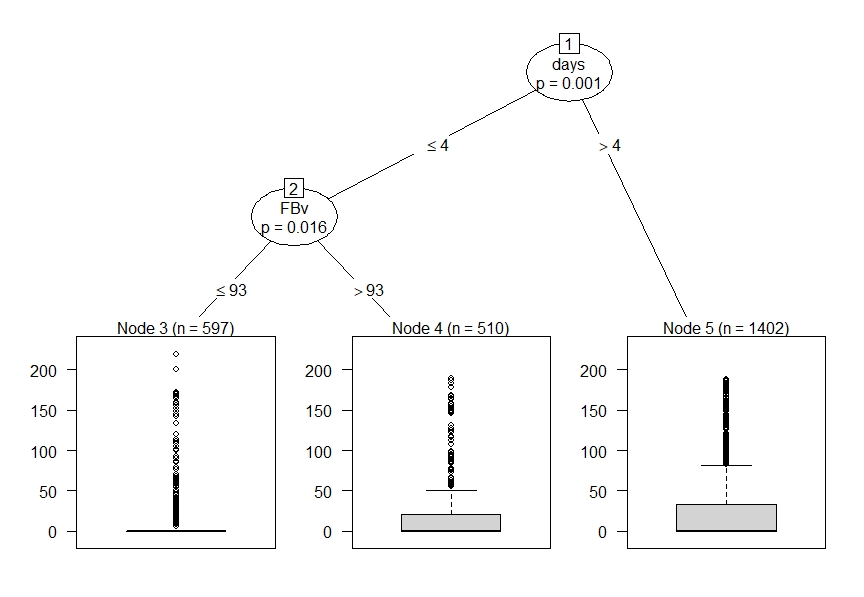
We have some further division taking place fastball velocity on both, a further out 460-day threshold for starters, and age requirement. I’m not a huge fan of the multi-branched tree with many variables. I’m all for keeping it simple. Using the above variables, I cut and diced the data into several possible combinations and came up with the following divisions.
| Starters | Relievers | |||||
|---|---|---|---|---|---|---|
| Category | Avg IL Days | IL Chances | Count | Avg IL Days | IL Chances | Count |
| 0 IL, <= 93 mph | 17 | 28% | 463 | 13 | 22% | 728 |
| 0 IL, > 93 mph | 28 | 45% | 141 | 20 | 32% | 628 |
| > 0 IL, <= 93 mph | 31 | 49% | 857 | 23 | 37% | 832 |
| > 0 IL, > 93 mph | 34 | 57% | 268 | 27 | 43% | 668 |
| > 460 days | 55 | 63% | 59 |
Again, the rates are similar to my previous findings. The only changes are the pitch velocity groupings and that rough over-460 IL day group who average two months on the IL a year. For me, I focus on starters and will designate the starters into three risk groups:
- Low: No IL, low velo.
- Medium: No IL, high velo, and some IL, low velo.
- High: Some IL, high velo, and high IL.
Not all injuries can be avoided, but the injury downside is just another factor to consider when setting each pitcher’s fantasy value.
And what’s a study without the players to consider for the upcoming season. Here are the historic IL days and fastball velocity for any pitcher with 10 starts last season.
| Name | Age | 2019 IP | Combined IL Days | FBv |
|---|---|---|---|---|
| Ryan Yarbrough | 28 | 141 | 0 | 88.2 |
| Nick Margevicius | 24 | 57 | 0 | 88.3 |
| Alex Young | 26 | 83 | 0 | 89.3 |
| Trevor Richards | 27 | 135 | 0 | 90.9 |
| Adam Plutko | 28 | 109 | 0 | 91.1 |
| Dillon Peters | 27 | 72 | 0 | 91.1 |
| Dario Agrazal | 25 | 73 | 0 | 91.2 |
| Jose Quintana | 31 | 171 | 0 | 91.4 |
| Asher Wojciechowski | 31 | 82 | 0 | 91.6 |
| Jaime Barria | 23 | 82 | 0 | 91.7 |
| Jose Suarez | 22 | 81 | 0 | 91.8 |
| Merrill Kelly 켈리 | 31 | 183 | 0 | 91.9 |
| Matthew Boyd | 29 | 185 | 0 | 92.0 |
| Tanner Roark | 33 | 165 | 0 | 92.1 |
| Ariel Jurado | 24 | 122 | 0 | 92.4 |
| Yusei Kikuchi | 29 | 161 | 0 | 92.5 |
| Aaron Civale | 25 | 57 | 0 | 92.6 |
| Peter Lambert | 23 | 89 | 0 | 92.7 |
| Jose Berrios | 26 | 200 | 0 | 92.8 |
| Zac Gallen | 24 | 80 | 0 | 92.9 |
| David Hess | 26 | 80 | 0 | 93.0 |
| Shane Bieber | 25 | 214 | 0 | 93.1 |
| Brad Keller | 24 | 165 | 0 | 93.4 |
| Miles Mikolas | 31 | 184 | 0 | 93.6 |
| Brendan McKay | 24 | 49 | 0 | 93.7 |
| Dakota Hudson | 25 | 174 | 0 | 93.7 |
| Chris Paddack | 24 | 140 | 0 | 93.9 |
| Jack Flaherty | 24 | 196 | 0 | 93.9 |
| Zach Plesac | 25 | 115 | 0 | 94.0 |
| Tyler Beede | 27 | 117 | 0 | 94.3 |
| Adrian Houser | 27 | 111 | 0 | 94.4 |
| Cal Quantrill | 25 | 103 | 0 | 94.5 |
| Mitch Keller | 24 | 48 | 0 | 95.4 |
| Sandy Alcantara | 24 | 197 | 0 | 95.6 |
| Luis Castillo | 27 | 190 | 0 | 96.5 |
| Dylan Cease | 24 | 73 | 0 | 96.5 |
| Kyle Hendricks | 30 | 177 | 66 | 86.9 |
| Mike Leake | 32 | 197 | 51 | 88.4 |
| Dallas Keuchel | 32 | 112 | 63 | 88.4 |
| Zach Davies | 27 | 159 | 120 | 88.5 |
| Marco Gonzales | 28 | 203 | 15 | 88.9 |
| CC Sabathia | 39 | 107 | 364 | 89.2 |
| Gio Gonzalez | 34 | 87 | 80 | 89.3 |
| Jerad Eickhoff | 29 | 58 | 284 | 89.5 |
| Felix Hernandez | 34 | 71 | 313 | 89.6 |
| Julio Teheran | 29 | 174 | 28 | 89.7 |
| Zack Greinke | 36 | 208 | 188 | 90.0 |
| Jhoulys Chacin | 32 | 103 | 300 | 90.0 |
| Joey Lucchesi | 27 | 163 | 36 | 90.2 |
| Jon Lester | 36 | 171 | 162 | 90.3 |
| Mike Fiers | 35 | 184 | 11 | 90.4 |
| Clayton Kershaw | 32 | 178 | 217 | 90.4 |
| Clayton Richard | 36 | 45 | 370 | 90.4 |
| Rick Porcello | 31 | 174 | 27 | 90.5 |
| Wade Miley | 33 | 167 | 83 | 90.5 |
| Jordan Zimmermann | 34 | 112 | 289 | 90.5 |
| Anibal Sanchez | 36 | 166 | 427 | 90.5 |
| Dereck Rodriguez | 28 | 99 | 7 | 90.6 |
| Elieser Hernandez | 25 | 82 | 53 | 90.6 |
| Daniel Norris | 27 | 144 | 357 | 90.8 |
| Dylan Bundy | 27 | 161 | 30 | 91.2 |
| Drew Smyly | 31 | 114 | 355 | 91.2 |
| Trevor Williams | 28 | 145 | 33 | 91.3 |
| J.A. Happ | 37 | 161 | 263 | 91.3 |
| Madison Bumgarner | 30 | 207 | 153 | 91.4 |
| Ross Detwiler | 34 | 69 | 165 | 91.4 |
| Cole Hamels | 36 | 141 | 182 | 91.4 |
| Tyler Skaggs | 28 | 79 | 430 | 91.4 |
| Jakob Junis | 27 | 175 | 13 | 91.5 |
| Jordan Yamamoto | 24 | 78 | 27 | 91.5 |
| Masahiro Tanaka | 31 | 182 | 157 | 91.5 |
| Jacob Waguespack | 26 | 78 | 35 | 91.6 |
| Caleb Smith | 28 | 153 | 117 | 91.6 |
| John Means | 27 | 155 | 24 | 91.8 |
| Eric Lauer | 25 | 149 | 30 | 91.9 |
| Kyle Freeland | 27 | 104 | 51 | 91.9 |
| Jeff Samardzija | 35 | 181 | 139 | 91.9 |
| Patrick Corbin | 30 | 202 | 272 | 91.9 |
| Steven Brault | 28 | 113 | 31 | 92.0 |
| Aaron Brooks | 30 | 110 | 183 | 92.0 |
| David Price | 34 | 107 | 199 | 92.0 |
| Kenta Maeda | 32 | 153 | 37 | 92.1 |
| Chi Chi Gonzalez | 28 | 63 | 182 | 92.2 |
| Brad Peacock | 32 | 91 | 257 | 92.2 |
| Erick Fedde | 27 | 78 | 88 | 92.3 |
| Joe Musgrove | 27 | 170 | 76 | 92.4 |
| Robbie Ray | 28 | 174 | 94 | 92.4 |
| Ivan Nova | 33 | 187 | 299 | 92.4 |
| Danny Duffy | 31 | 130 | 414 | 92.4 |
| Mike Soroka | 22 | 174 | 129 | 92.5 |
| Jake Arrieta | 34 | 135 | 140 | 92.5 |
| Marcus Stroman | 29 | 184 | 217 | 92.5 |
| Andrew Heaney | 29 | 95 | 419 | 92.5 |
| Shaun Anderson | 25 | 96 | 16 | 92.6 |
| Jordan Lyles | 29 | 141 | 252 | 92.6 |
| Mike Minor | 32 | 208 | 397 | 92.6 |
| Trent Thornton | 26 | 154 | 11 | 92.9 |
| Jake Odorizzi | 30 | 159 | 75 | 92.9 |
| Aaron Nola | 27 | 202 | 143 | 92.9 |
| Eduardo Rodriguez | 27 | 203 | 162 | 93.1 |
| Michael Wacha | 28 | 126 | 227 | 93.1 |
| Chris Sale | 31 | 147 | 121 | 93.2 |
| Matt Harvey | 31 | 59 | 433 | 93.2 |
| Tyler Mahle | 25 | 129 | 33 | 93.3 |
| Kyle Gibson | 32 | 160 | 57 | 93.3 |
| Sonny Gray | 30 | 175 | 96 | 93.3 |
| Chase Anderson | 32 | 139 | 96 | 93.4 |
| Edwin Jackson | 36 | 67 | 148 | 93.4 |
| Steven Matz | 29 | 160 | 244 | 93.4 |
| Glenn Sparkman | 28 | 136 | 89 | 93.5 |
| Chris Bassitt | 31 | 144 | 290 | 93.5 |
| Carlos Carrasco | 33 | 80 | 432 | 93.5 |
| Domingo German | 27 | 143 | 25 | 93.6 |
| Pablo Lopez | 24 | 111 | 108 | 93.6 |
| Zach Eflin | 26 | 163 | 122 | 93.6 |
| Aaron Sanchez | 27 | 131 | 299 | 93.6 |
| Taylor Clarke | 27 | 84 | 16 | 93.7 |
| Antonio Senzatela | 25 | 124 | 29 | 93.7 |
| Jeff Hoffman | 27 | 70 | 31 | 93.7 |
| Spencer Turnbull | 27 | 148 | 32 | 93.8 |
| Max Fried | 26 | 165 | 52 | 93.8 |
| Griffin Canning | 24 | 90 | 53 | 93.9 |
| Yonny Chirinos | 26 | 133 | 81 | 93.9 |
| Luke Weaver | 26 | 64 | 117 | 93.9 |
| Andrew Cashner | 33 | 150 | 375 | 93.9 |
| Stephen Strasburg | 31 | 209 | 421 | 93.9 |
| Kevin Gausman | 29 | 102 | 117 | 94.0 |
| Chris Archer | 31 | 119 | 92 | 94.1 |
| Vince Velasquez | 28 | 117 | 144 | 94.1 |
| Martin Perez | 29 | 165 | 377 | 94.1 |
| Lance Lynn | 33 | 208 | 249 | 94.2 |
| Lucas Giolito | 25 | 176 | 30 | 94.3 |
| Dylan Covey | 28 | 58 | 131 | 94.4 |
| Trevor Bauer | 29 | 213 | 38 | 94.6 |
| Justin Verlander | 37 | 223 | 69 | 94.7 |
| Anthony DeSclafani | 30 | 166 | 318 | 94.7 |
| Max Scherzer | 35 | 172 | 64 | 94.9 |
| Mike Foltynewicz | 28 | 117 | 84 | 94.9 |
| Reynaldo Lopez | 26 | 184 | 14 | 95.5 |
| German Marquez | 25 | 174 | 38 | 95.5 |
| Mike Clevinger | 29 | 126 | 79 | 95.5 |
| James Paxton | 31 | 150 | 361 | 95.5 |
| Blake Snell | 27 | 107 | 79 | 95.6 |
| Jose Urena | 28 | 84 | 124 | 95.9 |
| Jon Gray | 28 | 150 | 136 | 96.1 |
| Dinelson Lamet | 27 | 73 | 289 | 96.1 |
| Brandon Woodruff | 27 | 121 | 57 | 96.3 |
| Walker Buehler | 25 | 182 | 16 | 96.6 |
| Frankie Montas | 27 | 96 | 183 | 96.6 |
| Jacob deGrom | 32 | 204 | 32 | 96.9 |
| Tyler Glasnow | 26 | 60 | 155 | 97.0 |
| Gerrit Cole | 29 | 212 | 143 | 97.2 |
| Noah Syndergaard | 27 | 197 | 213 | 97.7 |
| Zack Wheeler | 30 | 195 | 460 | 96.7 |
| Nathan Eovaldi | 30 | 67 | 470 | 97.5 |
| Yu Darvish | 33 | 178 | 492 | 94.2 |
| Michael Pineda | 31 | 146 | 511 | 92.6 |
| Charlie Morton | 36 | 194 | 551 | 94.4 |
| Hyun-Jin Ryu 류현진 | 33 | 182 | 558 | 90.6 |
| Adam Wainwright | 38 | 171 | 618 | 89.9 |
| Homer Bailey | 34 | 163 | 626 | 93.0 |
| Jason Vargas | 37 | 149 | 657 | 84.3 |
| Rich Hill | 40 | 58 | 667 | 90.3 |
| Clay Buchholz | 35 | 59 | 717 | 89.5 |
| Brett Anderson | 32 | 176 | 918 | 90.8 |
Notes
- The pitcher with the highest velocity and IL experience is Noah Syndergaard. That 2020 IL stint didn’t take long.
- The oldest starter to never have been on the IL is Tanner Roark at 33.
- Darvish and Morton are going as the 17th and 18th pitchers even though they’ve broken the 460-day threshold.
- Just go and scroll through the starters who have been on the IL and throw over 93-mph, especially over 95. Lots of them have spent considerable time on the IL over their careers. I’m thinking to target “safer” but elite starters if given the opportunity like Corbin, Bieber, Kershaw, Castillo, and Flaherty. There is no way to completely stay away from the injury risk but why not add a pitcher with a 28% chance (Boyd) than someone with a 63% chance (Ryu)
These conclusions were about 80% in line with what I expected with fastball velocity nudging itself in. Next up will be taking this information and seeing if a higher injury rate ages pitchers more than projected.
Jeff, one of the authors of the fantasy baseball guide,The Process, writes for RotoGraphs, The Hardball Times, Rotowire, Baseball America, and BaseballHQ. He has been nominated for two SABR Analytics Research Award for Contemporary Analysis and won it in 2013 in tandem with Bill Petti. He has won four FSWA Awards including on for his Mining the News series. He's won Tout Wars three times, LABR twice, and got his first NFBC Main Event win in 2021. Follow him on Twitter @jeffwzimmerman.
Good stuff! So… don’t trust Zack Wheeler and Nathan Eovaldi as far as you can throw them! 😉
Thanks
Wouldn’t career IL days per season (162 MLB roster days) be more predictive than career IL days?
Exactly. Otherwise, you are mostly just restating that those guys have been around longer.
Arm damage kind of accumulates over time though. Injury prone plus mileage is worse than just injury prone.
Age never showed up as a factor but I could look into roster days.
One item I didn’t mention here and should be in the next article, age doesn’t matter. Once a pitcher gets hurt, then they start aging.