My Favorite Target From Every Team
For my final article of the preseason, I decided to assign myself the difficult task of identifying my favorite fantasy pick from each Major League team. Some teams have several candidates, while others I have to hold my nose for (cough, cough, the Nats). You’ll see players from throughout the player pool, as my choices aren’t necessarily tied to their market value. They are players I have been targeting and drafting this winter and spring.
Here are the leagues I’m in this season:
- 22 NFBC Gladiators (roto, 15-team, 23 rounds, no bench)
- 7 NFBC Draft Champions (roto, 15-team, 50 rounds, draft and hold)
- 4 NFBC Online Champions (roto, 12-team, 30 rounds, with FAAB)
- 2 NFBC Main Events (roto, 15-team, 30 rounds, with FAAB)
- SCARF (EARTH industry league on NFBC; same setup as the Main Event)
- TGFBI (Justin Mason’s industry league on NFBC, same setup as the Main Event)
- FSGA Experts Champions League (14-team roto, partnered with colleague Joe Orrico)
- Tout Wars (roto, OBP instead of AVG, 15-team, draft and hold)
Yes, I love helping people win at fantasy baseball, but I also love to play it. You might think I’m crazy, but please note that only nine of them are FAAB leagues. The Gladiator is a hybrid best ball format where I don’t even have to set the lineups. I won’t even mention the 100+ best ball leagues I’m in on other sites. Again, no management is necessary – just draft and hope for production and good health luck.
Let’s get into it. Listed with each player is their current NFBC Online Championship and Yahoo average draft positions.
Toronto Blue Jays – Kazuma Okamoto, 1B/3B (NFBC: 196, Yahoo: 166)
Many older players from overseas have a difficult time adjusting to the Major Leagues. If spring training is any indication, Okamoto seems to be adjusting just fine (.316/.435/.632). He’s going to be an integral part of this offense. Oh, and Sporer loves him, too. Honorable mentions to Daulton Varsho (30+ homers if he stays healthy) and Cody Ponce 폰세, though his ADP has leaped over 100 spots over the last month.
Boston Red Sox – Roman Anthony, OF (50, 46)
I strongly believe that Anthony is a future Hall of Famer and that he will be a top 20 hitter in his first full season as the leadoff hitter for a strong Red Sox offense. Many fantasy analysts and managers believe that 2026 is the Year of the Breakout for Wilyer Abreu and Ceddanne Rafaela. Now imagine if Jarren Duran produces like it’s 2024, Trevor Story avoids fluky injuries, and Willson Contreras exceeds 600 plate appearances for the first time. That’s a lot of “ifs”, but with that pitching staff depth and bullpen, this could be a magical season in Fenway.
New York Yankees – José Caballero, 2B/3B/SS/OF (196, 189)
Most of the Yankees are fairly priced, but fully priced. The New York Fantasy Tax is a real thing – everyone knows proud New Yorkers get their guys. Caballero is a swipes maestro who has been working hard to improve as a hitter this offseason, and is eligible at almost every fantasy position. He’s a great hitter to bring into your lineup when someone in your starting lineup suffers a midweek injury or you need some stolen bases. An honorable mention to Carlos Rodón, who is one of my favorite mid-to-late-round stashes, and is on track to return well before Gerrit Cole.
Baltimore Orioles – Five-Way Tie
My rule of thumb for 2026 drafts, if you have any remaining: when in doubt, draft the Orioles hitter. In AL Bold Predictions on FTN, I prognosticate that the Orioles will be the fourth team in history to hit 300 home runs. I have a Gunnar Henderson–Pete Alonso 1-2 punch on several teams, and would happily do it again. Colton Cowser, Trevor Rogers, and Shane Baz are the other three O’s I’ve been targeting. Well, I guess I like their pitching too (just not their horrendous bullpen).
Tampa Bay Rays – Griffin Jax, RP (149, 198)
Cream rises to the top in real life, and often does in fantasy as well. After a rocky rookie season in 2021 (6.37 ERA in 82 innings, mostly as a starter), Jax has slowly turned into one of the best relievers in the game. Over the last two seasons, only two qualified relievers have a higher swinging-strike rate than Jax’s 18.3% – Josh Hader (20.8%) and Mason Miller (20.3%). With Edwin Uceta ailing and Garrett Cleavinger a lefty, it’s only a matter of time for Kevin Cash to let Jax run with the closer’s job, similar to Pete Fairbanks last year.
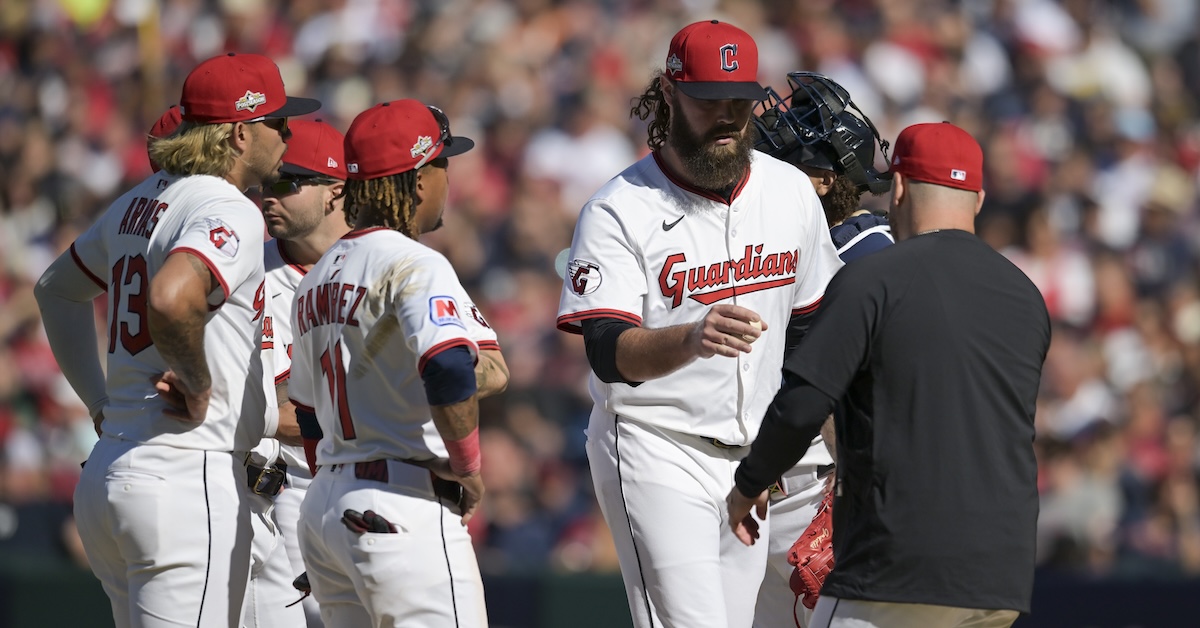
Cleveland Guardians – Chase DeLauter, OF (269, 198)
Not a team loaded with fantasy goodness, but DeLauter stands out. A healthy DeLauter is a fantasy pick with massive upside, though his price has been steadily rising – out of the 300s and up several rounds, due to a hot spring. Parker Messick is a strong end-game target, though I haven’t been able to land many shares. I wouldn’t be shocked if he out-earns last season’s Major League walks leader, Gavin Williams.
Detroit Tigers – N/A
No offense to Tiger fans, but they are not a very exciting group from a fantasy perspective. Of course, that doesn’t mean that managers won’t be able to squeeze out some fantasy profit from some of these players. Tarik Skubal is the best pitcher in baseball. I have not often been in a position to draft him – and when I have, I usually target the elite first-round hitter. Sadly, I have no Skubal shares. The move to Detroit is a great one for Framber Valdez, on paper, but I don’t have great vibes on him this season. Jack Flaherty can be spectacular in one start, and serve up a half-dozen earned runs in the next – I can’t stomach that volatility. Top prospect Kevin McGonigle made the team and will be an exciting player. This is one I likely missed the boat on – especially recently, as his price continues to soar. The best bangs for the buck are Dillon Dingler and Gleyber Torres, with ADPs in the mid-200s.
Kansas City Royals – Vinnie Pasquantino, 1B (77, 81)
I highlighted Vinnie P in my bold predictions article earlier this month, noting that smashing 40 dingers may not be quite so bold. Kauffman Stadium’s outfield fences are moving in being lowered, which should bode well for most of their hitters. In fact, there are quite a few 30+ HR candidates on the squad. Their pitching staff is solid, and the bullpen has been upgraded from last season. The Royals are my pick to win the AL Central.
Chicago White Sox – Austin Hays, OF (341, N/A)
Would you believe me if I told you that the White Sox player with the highest ADP this season is their new closer who has never been a closer for a full season and posted a 13.8% walk rate last season? I have a couple of Seranthony Domínguez shares, but I don’t feel great about it. I do feel good about a late-round Austin Hays, who should be an everyday hitter and respectable producer in the middle of their lineup.
Minnesota Twins – Matt Wallner, OF (297, N/A)
Wallner is an elite power hitter with some past oblique issues. But Wallner is only focused on the future, which involves soaking those obliques before sleep, and then smashing some baseballs. Wallner and his 16% barrel rate can produce a 30-HR, 85-RBI season as an everyday player for the Twins. Management doesn’t intend to platoon him at this time. Mick Abel has been flying up draft boards, but alas, I have not been able to sneak a share yet. Josh Bell has been a bargain all season (ADP 370), and it’s almost criminal to not click on his name in a draft where you need a CI with power.
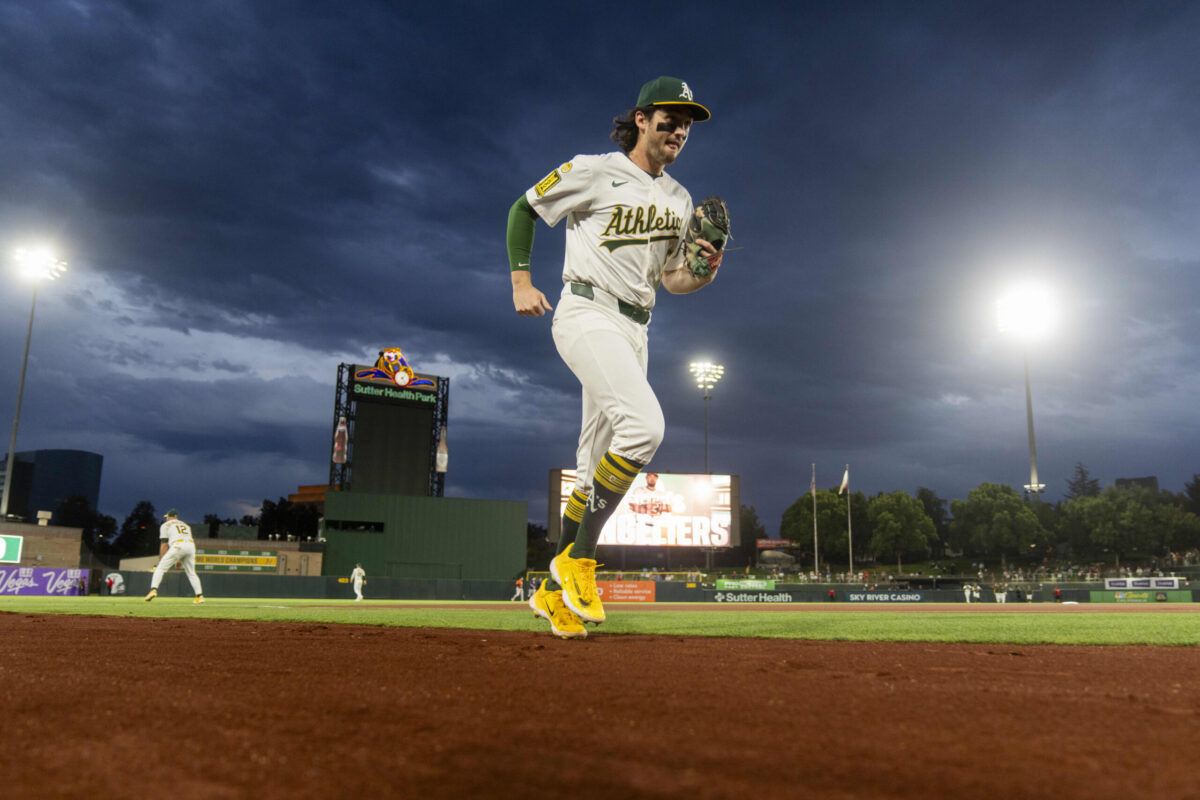
The Athletics – Jacob Wilson윌슨, SS (201, 161)
There are so many A’s to choose from. We’re expecting the world from the likes of Nick Kurtz, Brent Rooker, Tyler Soderstrom, Shea Langeliers, and even Lawrence Butler and his 94.3% healed knees. This is the type of offense that will keep opposing pitchers awake the night before the game, and give them nightmares in their sleep after the game. Wilson will play his part in disrupting Circadian rhythms as a potential .320-80-17-70-13 bat this season. The AL Batting Title goes through Mr. Wilson this year.
Houston Astros – Mike Burrows, SP (224, 207)
The former Pittsburgh Pirates’ prospect will find himself comfortable down in the Lone Star state. Thankfully, he won’t have to be the lone star in the rotation with ace Hunter Brown there. Some of us were witness to his official breakout, which occurred after the last All-Star break where Burrows produced a 3.27 ERA (3.19 FIP), 1.07 WHIP, 25.1% K, and a 6.4% BB in 10 starts and two multi-relief, piggyback spots. Burrows will make his official Astros debut on Friday against the Angels, as the pitcher slated second in his rotation.
Seattle Mariners – Brendan Donovan, 2B (265, 188)
We don’t only need stars to win fantasy baseball leagues, we need support roles as well. In this loaded lineup of stars, Donovan shall be the table-setter; the elite contact rate guy who provides above-average production, just not with a barrage of homers or bag thefts. “Better in real baseball” is what they say about Donovan. I wonder what they’ll be saying this October when the leadoff man scores triple-digit runs and establishes himself as the glue of this offense. Only time will tell and I’ll be ready to listen to the audio book on my long drive to Thanksgiving dinner.
Los Angeles Angels – Logan O’Hoppe, C (250, 196)
We need to set some thresholds for the Driveline guys, but keep it simple. Can we measure it simply? Like, if O’Hoppe hits 30 home runs, then it’s one point for Driveline, or something like that. For drafters in one-catcher leagues who are light in roto power categories and need to fill their catcher slot before the draft ends might be thrilled with the big bopper, who I am certain has another level of production marinating and ready to be served up in 2026. Wait, we forgot to cook! O’Hoppe will do just that with elite framework for those called third strikes. It’s rumored that LOH knows the ABS blind spot.
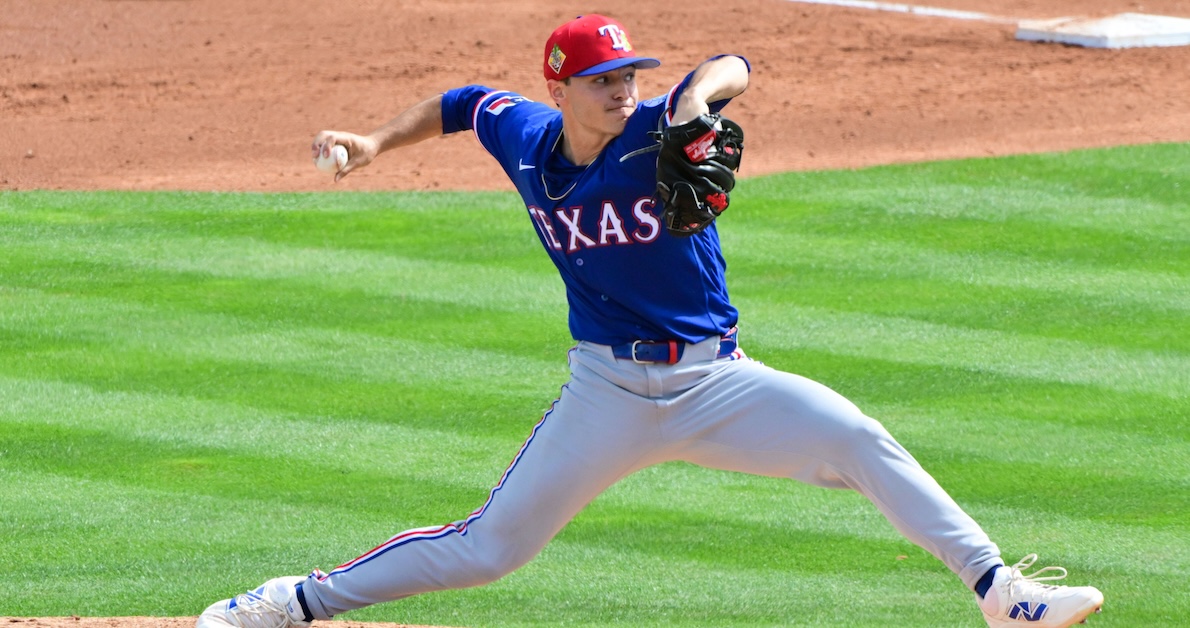
Texas Rangers – Jack Leiter, SP (239, 209)
Wyatt Langford and Corey Seager need each other. If one is hurt for a prolonged period, the other likely won’t earn or exceed their fantasy value. Both have been big targets, but the Langford price has skyrocketed with his red-hot spring, up to 33 in 12-team NFBC leagues. We saw glimpses of Leiter’s potential and dominance in his first full season and all said, “if only he could cut down on the free passes.” He’s been doing just that in the spring. If he could pull a Pivetta and dip that walk rate down to the 8-9% range, we’ll be laughing all the way to the roto bank.
New York Mets – Luis Robert Jr., OF (107, 144)
This was a tough one because this team is loaded with fantasy goodness. Robert Jr. is one of my highest rostered hitters. He’s had a rough few years filled with losing, multiple managers, and myriad of injuries. This is his fresh start. He’s an above average base-stealer, an excellent defender, and likely did not hit 38 homers in 2023 by accident. Devin Williams, Bo Bichette, Freddy Peralta, Francisco Alvarez, Jorge Polanco, and Marcus Semien are other Mets I’ve frequently targeted in drafts. It’s an offense we want to invest in, and they may very well break the curse in 2026.
Atlanta Braves – Ronald Acuña Jr., OF (5, 10)
Acuña produced the best roto season in history (2023) before Shohei Ohtani topped him the following season. With the Braves offensive band healthy and back together, sparks (and balls) should fly. The big issue, of course, is the pitching rotation. Their current “IL staff” with Spencer Strider and Spencer Schwellenbach looks better than the quintet the Braves are rolling out there to begin the 2026 season. I’ve drafted Acuña over Juan Soto at the 4-spot quite frequently this draft season, and even took him over Bobby Witt Jr. at the 1.03 in my latest draft. Austin Riley and Matt Olson have been targets as well.
Philadelphia Phillies – 3-Way-Tie: Cristopher Sánchez, SP (24, 27), Jesús Luzardo, SP (69, 81), Zack Wheeler, SP (110, 137)
I’ve had one rule with starting pitchers this winter: don’t leave a draft without a Phillies or Mariners arm. This was a nasty trio last season. Per our Player Rater, Sánchez was the overall SP6, Wheeler the SP14, and Luzardo the SP30. Luzardo’s value was slightly weighed down by his ratios (3.96, 1.22), though he ranked fifth in the Majors in strikeouts with 216.
Miami Marlins – Max Meyer, SP (256, N/A)
Though I have a few shares of Jakob Marsee, my favorite Marlins’ target has been Meyer. He only threw seven innings in spring, but they were filthy. He struck out 12, walked one, and did not allow an earned run. Meyer is incredibly talented, but has dealt with his fair share of injuries over the last few years. The key is that he is healthy now. Drafters have taken notice as his ADP has risen over 100 spots (to 257 in OCs) over the last two months.
Washington Nationals – N/A
My only true Nats’ target this winter was Harry Ford, who will undoubtedly crush in Triple-A while Keibert Ruiz keeps his job warm for him. It’s difficult to invest in a third-round James Wood, regardless of the obvious power and upside. His 221 strikeouts in 2025 were the third most ever, behind Mark Reynolds (223 in 2009) and Adam Dunn (222 in 2012). Top prospect Dylan Crews was just optioned to Triple-A, and CJ Abrams might need a chaperone for the evenings before road games, so he can be fully rested for a game of professional baseball. Don’t get me started on the pitchers and their closer committee, led by Clayton Beeter and his 17.3% walk rate last season. Though he’s moving in the right direction this spring (11.5% walk rate, yippee!) Though we all know that anything is possible in the Year of Our (Brad) Lord.
Milwaukee Brewers – Brandon Tie: Brandon Woodruff, SP ( 161, 131), Brandon Sproat, SP (323 ,N/A)
There’s something in the pitching water in Milwaukee, and we all want a taste. Woodruff was an early-draft-season target and Sproat more recently, since being traded to the Brewers. Let’s hope Woodruff can stay healthy and that Sproat can deliver on the promise and hype from his days as a New York Mets’ prospect.
Chicago Cubs – Nico Hoerner, 2B (99, 98)
I don’t always target an early second baseman this draft season, but when I do, it’s usually Hoerner around his ADP. It takes the proper power-heavy build through the first few rounds – one where Hoerner is the perfect complement with his assistance in three categories – batting average, runs, and stolen bases.
Pittsburgh Pirates – Konnor Griffin, SS (185, 191)
His price rose, and then it dropped. Now it’s reasonable, especially with us all aware of the Pirates’ front office’s tendencies of being cheap, maximizing service time, and keeping their top prospects down. Griffin is going to make an impact in the big leagues as soon as he is promoted, which I expect to happen sometime in early May. He is one of the few hitters worth stashing on shallow benches, especially if he is available in your last-minute drafts after 200 ADP.
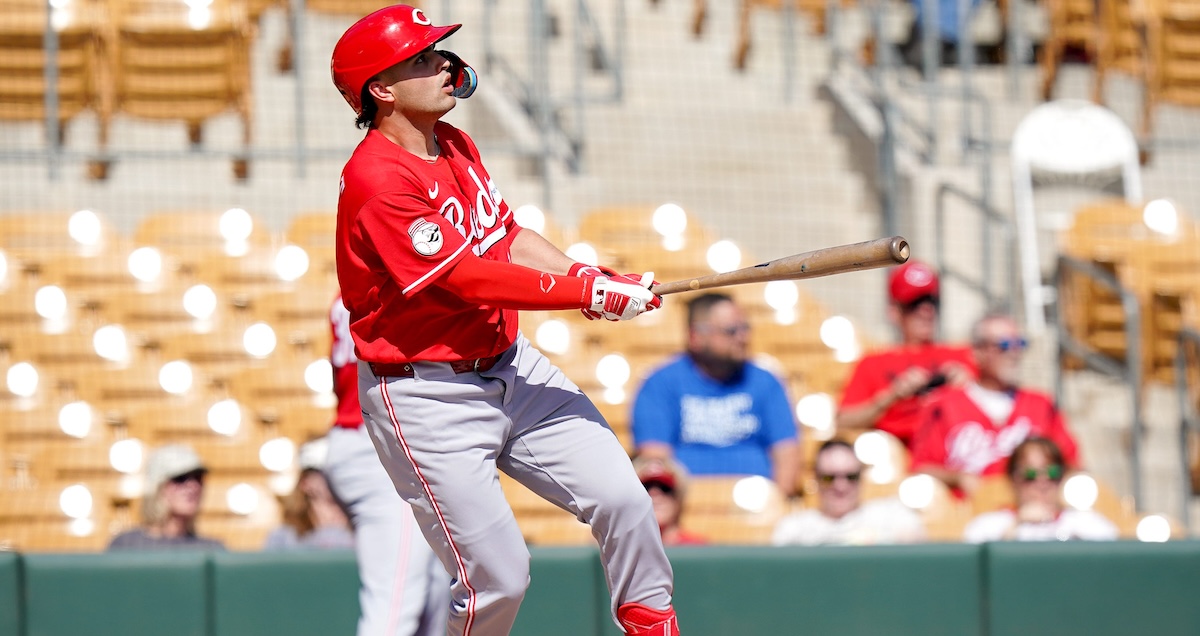
Cincinnati Reds – Matt McLain, 2B (128, 182)
He was a star at UCLA, and a budding star in his rookie season with the Reds in 2023, though his .290 average was clearly inflated by an irregularly high BABIP of .385. He was mostly a bust as a top 100 pick last season, and was hovering in the 180-200 ADP range for most of the winter. Fast forward to this spring where he has been the hottest hitter on the planet (.529/.571/1.020), and suddenly his NFBC ADP is closer to 100. Folks who invested early are pleased. He will go through prolonged slumps and strike out a ton, but has massive upside and potential to out-earn even his current draft cost.
St. Louis Cardinals – Iván Herrera, UT/C (182, 167)
Herrera was an unassuming, slap-hitter in the minors, who gradually improved his power metrics every season since. Last year was the breakout, as he hit .284 with 19 dingers, flexing above-average power (91.2 EV, 11% BRL, 47.4% HH). Health is the biggest question mark, and the one risk with drafting him. I haven’t landed him in drafts as much as I would have liked – he’s my ultimate FOMO guy. Herrera should earn catcher eligibility sometime in late April or early May.
San Francisco Giants -Tie: Ryan Walker, RP (132, 189), Jung Hoo Lee 이정후, OF (300, 192)
Walker has flown under the radar for most of draft season because there hasn’t been much written about the Giants’ bullpen. His draft cost has been affordable because he wasn’t very good in his first full season as their closer. There isn’t much competition for the ninth-inning gig in San Francisco, and Walker has had a strong spring. Jung Hoo Lee is one of my “one year early” guys – my most rostered hitter last season. Moving back to his original position in the KBO (right field) should make him more comfortable. He won’t wow in any particular category, though he’s a sneaky candidate to hit over .300 this season.
San Diego Padres – Michael King, SP (136, 140)
I love Mason Miller as much as anyone, but I’ve haven’t been comfortable drafting him at his second-round ADP, outside of Gladiator contests back in December. King has been my favorite Padres’ target as a 10-round SP3 in 15-team leagues with the potential to help anchor my staff’s ERA and strikeout categories.
Arizona Diamondbacks – Jordan Lawlar, 3B (257, N/A)
Hello, my name is Vlad Sedler – President of the Jordan Lawlar Fan Club. We all have our biases, and Lawlar is one of my biggest. He’s a former top prospect with the potential for five-category contribution and will gain outfield eligibility soon. The knock on him can’t be ignored – the kid has not been able to stay healthy. If he does though, it’s Profit Central.
Colorado Rockies – Brenton Doyle, OF (166, 183)
The only Rockies player in the top 100 ADP is Hunter Goodman. If we scroll down a few rounds, the next man up is Brenton Doyle, who has been reasonably priced all draft season in the 160-200 ADP range. Doyle broke out in 2024 (82 R, 23 HR, 72 RBI, 30 SB), then had a rough follow-up in 2025 as he dealt with a family tragedy early in the season. He looked good after the All-Star break, hitting .282 with 8 HR and 9 SB in 56 games (207 PA), and has had a strong spring.
Los Angeles Dodgers – Kyle Tucker, OF (13, 11)
Saving my home team for last, we all know the fantasy juggernaut that the Dodgers are, though many of them are expensive – six of their players have average draft positions in the top 70. I do believe in a Mookie Betts bounce-back, though I usually target pitchers in his draft range and also usually have a shortstop by the time he’s a draft consideration around his ADP. I have more shares of Roki Sasaki than probably anyone in the NFBC, most from December and January non-FAAB leagues. I can be stubborn, but must also be realistic: he appears broken and unconfident, and may need a stint in the minors to help him. As for my top Dodgers target, that’s newcomer Kyle Tucker, who I believe will stay healthy, hit at least 30 home runs and make a run for the NL RBI crown.
Hope you’ve enjoyed my preseason content, and I look forward to serving you with good advice during the season. Opening Day is almost here, so let’s Play Ball!