wPDI & CSW: Strikeout Rate
Introduction
This is the fourth article in my wPDI vs. CSW series. You can catch up by reading the first three articles – on called strikes, whiffs and residuals.
Here is a quick summary of some of the basics of wPDI & CSW from this series:
Last year, I developed the Weighted Plate Discipline Index (wPDI) framework, whereby all pitches can be classified into six different outcomes as follows:
| Outcome | Outcome | Outcome | Outcome | Outcome | Outcome | |
|---|---|---|---|---|---|---|
| A | B | C | D | E | F | |
| Zone? | Out of Zone | Out of Zone | Out of Zone | In Zone | In Zone | In Zone |
| Swing? | Swung On | Swung On | No Swing | Swung On | Swung On | No Swing |
| Contact? | No Contact | Contact Made | No Swing | No Contact | Contact Made | No Swing |
Each outcome is then assigned a weight, or an index. A% through F% are the percent of pitches thrown in each outcome. The general formula for wPDI, the Weighted Plate Discipline Index is given as:
wPDI = IndexA * A% + IndexB * B% + IndexC * C% + IndexD * D% + IndexE * E% + IndexF * F%
wPDI can generate an all-in-one sortable metric used to evaluate pitchers. The plate discipline framework may be tailored to mimic (or to correlate to) various measures of deception or effectiveness.
In the first three articles of this series, we developed indices for wPDI to approximate the PitcherList metric, CSW. The Called Strikes + Whiffs (CSW) statistic was featured in last year’s FSWA Research Article of the Year by Alex Fast, and is defined as:
Called Strikes + Whiffs
Total Pitches
We separately tacked the called strikes and whiffs components, and landed on the following wPDI equation to represent CSW:
| Outcome | Description | Index |
|---|---|---|
| A | Out of Zone / Swung On / No Contact | 105% |
| B | Out of Zone / Swung On / Contact Made | 0% |
| C | Out of Zone / No Swing | 10% |
| D | In Zone / Swung On / No Contact | 110% |
| E | In Zone / Swung On / Contact Made | 0% |
| F | In Zone / No Swing | 90% |
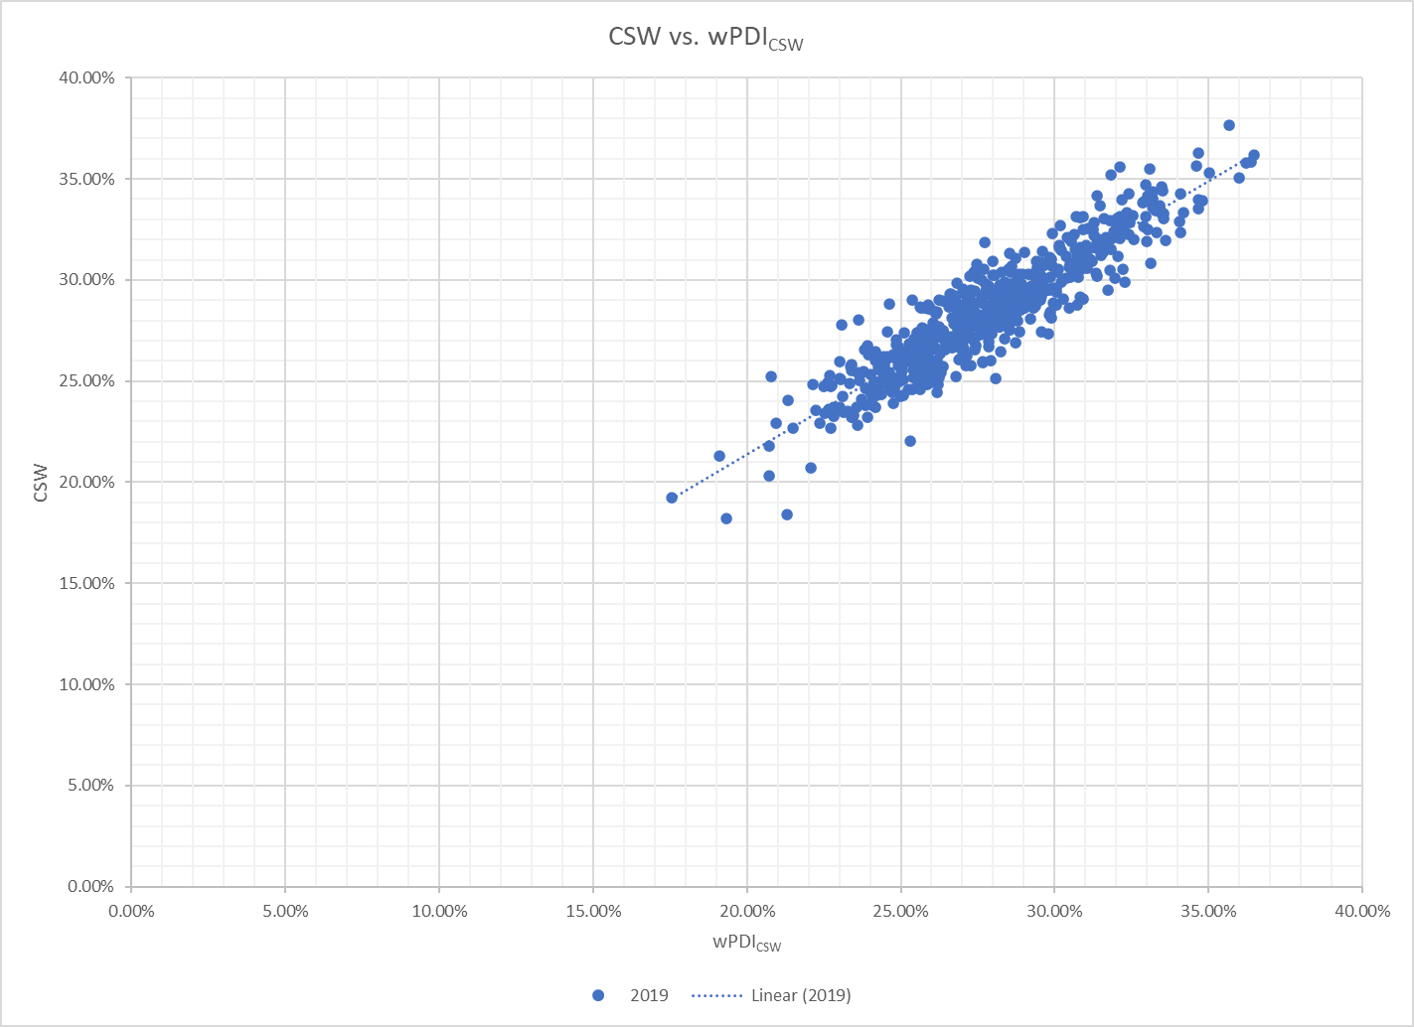
wPDICSW = 105% * A% + 10% * C% +110% * D% + 90% * F%
Our wPDI representation of Fast’s CSW formula yielded a 92% correlation coefficient, which can be seen graphically here:
In today’s article, we will go a step further, and tackle the relationship between my plate discipline framework, Fast’s CSW, and a pitcher’s Strikeout Rate (K%). Further, we will develop a wPDI equation to express K% in terms of the six pitching outcomes. As always, along with the research, we will discuss interesting findings as they arise.
CSW & Strikeout Rate (K%)
First, let’s take a look at the relationship between CSW and K%. Below is a sample of pitchers from the top, middle and bottom ranges of their strikeout rate in 2019 (minimum 250 pitches).
| Name | IP | wPDICSW | CSW | K% | K% to CSW |
|---|---|---|---|---|---|
| Josh Hader | 75.7 | 36.0% | 35.1% | 47.8% | 136.4% |
| Nick Anderson | 65.0 | 36.2% | 35.8% | 41.7% | 116.5% |
| Kirby Yates | 60.7 | 31.5% | 33.7% | 41.6% | 123.5% |
| Austin Adams | 32.0 | 36.4% | 35.9% | 40.8% | 113.8% |
| Ken Giles | 53.0 | 34.7% | 36.3% | 39.9% | 109.9% |
| Gerrit Cole | 212.3 | 34.6% | 35.7% | 39.9% | 111.9% |
| Edwin Diaz | 58.0 | 33.6% | 33.3% | 39.0% | 117.2% |
| Darwinzon Hernandez | 30.3 | 32.6% | 32.0% | 38.8% | 121.2% |
| Matt Barnes | 64.3 | 31.6% | 33.1% | 38.6% | 116.8% |
| Felipe Vazquez | 60.0 | 32.1% | 33.2% | 38.1% | 114.9% |
| Joshua James | 61.3 | 33.6% | 32.0% | 37.6% | 117.6% |
| Will Smith | 65.3 | 33.5% | 34.6% | 37.4% | 108.1% |
| Liam Hendriks | 85.0 | 33.0% | 33.2% | 37.4% | 112.8% |
| Brandon Workman | 71.7 | 33.5% | 34.5% | 36.4% | 105.6% |
| Aroldis Chapman | 57.0 | 32.4% | 32.3% | 36.2% | 112.2% |
| Emilio Pagan | 70.0 | 33.5% | 34.4% | 36.0% | 104.6% |
| Chris Sale | 147.3 | 34.1% | 34.3% | 35.6% | 103.9% |
| Jay Jackson | 30.3 | 32.5% | 32.9% | 35.6% | 108.3% |
| Tommy Kahnle | 61.3 | 33.3% | 32.4% | 35.5% | 109.7% |
| Justin Verlander | 223.0 | 33.2% | 34.0% | 35.4% | 104.1% |
| Max Scherzer | 172.3 | 32.4% | 34.3% | 35.1% | 102.5% |
| Colin Poche | 51.7 | 31.9% | 32.1% | 34.8% | 108.5% |
| Brad Hand | 57.3 | 31.8% | 35.2% | 34.7% | 98.6% |
| Tanner Rainey | 48.3 | 32.4% | 32.9% | 34.6% | 105.2% |
| Tyler Duffey | 57.7 | 31.0% | 31.7% | 34.5% | 108.7% |
| Ryan Pressly | 54.3 | 36.5% | 36.2% | 34.1% | 94.2% |
| Mike Clevinger | 126.0 | 32.9% | 33.8% | 33.9% | 100.2% |
| . | |||||
| . | |||||
| . | |||||
| Anthony DeSclafani | 166.7 | 26.4% | 27.4% | 24.0% | 87.7% |
| Brandon Brennan | 47.3 | 31.4% | 30.2% | 24.0% | 79.5% |
| Jose Urquidy | 41.0 | 31.0% | 31.2% | 24.0% | 77.0% |
| Mark Melancon | 67.3 | 28.0% | 30.2% | 23.9% | 79.0% |
| Matt Hall | 23.3 | 28.5% | 31.3% | 23.9% | 76.3% |
| A.J. Minter | 29.3 | 28.0% | 28.6% | 23.8% | 83.3% |
| Dan Winkler | 21.7 | 29.3% | 30.2% | 23.7% | 78.5% |
| Kyle McGowin | 16.0 | 29.3% | 29.2% | 23.7% | 81.2% |
| Zack Wheeler | 195.3 | 27.2% | 27.9% | 23.6% | 84.5% |
| Jon Gray | 150.0 | 29.4% | 28.9% | 23.6% | 81.6% |
| Derek Law | 60.7 | 29.4% | 30.4% | 23.5% | 77.3% |
| Daniel Hudson | 73.0 | 26.3% | 27.4% | 23.4% | 85.3% |
| Drew Smyly | 114.0 | 28.7% | 28.7% | 23.4% | 81.6% |
| Michael Pineda | 146.0 | 28.4% | 28.5% | 23.3% | 81.8% |
| Fernando Rodney | 47.7 | 29.3% | 28.6% | 23.3% | 81.5% |
| Tyler Skaggs | 79.7 | 26.8% | 27.1% | 23.3% | 86.1% |
| Shawn Armstrong | 58.0 | 27.1% | 26.2% | 23.3% | 88.8% |
| Ryan Burr | 19.7 | 26.7% | 28.7% | 23.3% | 81.3% |
| Clay Holmes | 50.0 | 29.9% | 30.2% | 23.3% | 77.2% |
| Jose Berrios | 200.3 | 28.8% | 29.8% | 23.2% | 78.0% |
| Marcus Walden | 78.0 | 28.5% | 28.6% | 23.2% | 81.0% |
| Mike Minor | 208.3 | 28.4% | 29.4% | 23.2% | 78.9% |
| Cole Hamels | 141.7 | 28.0% | 29.0% | 23.2% | 79.9% |
| Tyler Mahle | 129.7 | 27.7% | 30.5% | 23.2% | 76.0% |
| Nestor Cortes | 66.7 | 27.1% | 28.8% | 23.2% | 80.5% |
| Josh Lucas | 15.7 | 25.0% | 25.3% | 23.2% | 91.8% |
| Nathan Eovaldi | 67.7 | 28.9% | 29.6% | 23.2% | 78.4% |
| Dylan Bundy | 161.7 | 29.6% | 29.9% | 23.1% | 77.3% |
| Zack Greinke | 208.7 | 27.8% | 29.8% | 23.1% | 77.6% |
| Yusmeiro Petit | 83.0 | 25.7% | 28.6% | 23.1% | 80.8% |
| Austin Brice | 44.7 | 28.5% | 30.6% | 23.1% | 75.6% |
| Jeurys Familia | 60.0 | 30.7% | 30.3% | 23.0% | 76.0% |
| . | |||||
| . | |||||
| . | |||||
| Antonio Senzatela | 124.7 | 23.5% | 23.3% | 13.1% | 56.2% |
| Reed Garrett | 15.3 | 22.1% | 20.7% | 13.0% | 62.8% |
| Richard Bleier | 55.3 | 24.2% | 24.5% | 12.8% | 52.2% |
| Dario Agrazal | 73.3 | 25.5% | 26.1% | 12.8% | 49.0% |
| Ryan Carpenter | 40.7 | 22.8% | 24.8% | 12.7% | 51.2% |
| Mike Morin | 50.7 | 26.0% | 25.8% | 12.4% | 48.0% |
| Erick Fedde | 78.0 | 23.2% | 23.5% | 12.3% | 52.4% |
| Dan Otero | 29.7 | 22.2% | 23.6% | 12.2% | 51.8% |
| Brett Anderson | 176.0 | 25.2% | 24.6% | 12.1% | 49.2% |
| Zac Reininger | 28.0 | 22.9% | 23.6% | 12.1% | 51.2% |
| Scott Alexander | 17.3 | 24.2% | 26.3% | 11.8% | 44.9% |
| Brock Burke | 26.7 | 22.4% | 22.9% | 11.7% | 51.1% |
| Reggie McClain | 21.0 | 25.3% | 22.0% | 11.6% | 52.6% |
| Pat Neshek | 18.0 | 27.5% | 30.6% | 11.4% | 37.2% |
| Clayton Richard | 45.3 | 21.5% | 22.7% | 11.0% | 48.5% |
| James Marvel | 17.3 | 22.8% | 23.3% | 10.7% | 46.0% |
| Marco Estrada | 23.7 | 23.1% | 24.3% | 10.4% | 42.9% |
| Odrisamer Despaigne 데스파이네 | 13.3 | 17.5% | 19.2% | 10.3% | 53.6% |
| Matt Koch | 20.7 | 20.7% | 20.3% | 9.4% | 46.2% |
| Kohl Stewart | 25.3 | 24.5% | 25.8% | 9.2% | 35.7% |
| Ervin Santana | 13.3 | 21.3% | 18.4% | 7.8% | 42.4% |
| Josh Rogers | 14.3 | 19.1% | 21.3% | 7.3% | 34.3% |
| Eric Skoglund | 21.0 | 19.3% | 18.2% | 4.0% | 21.9% |
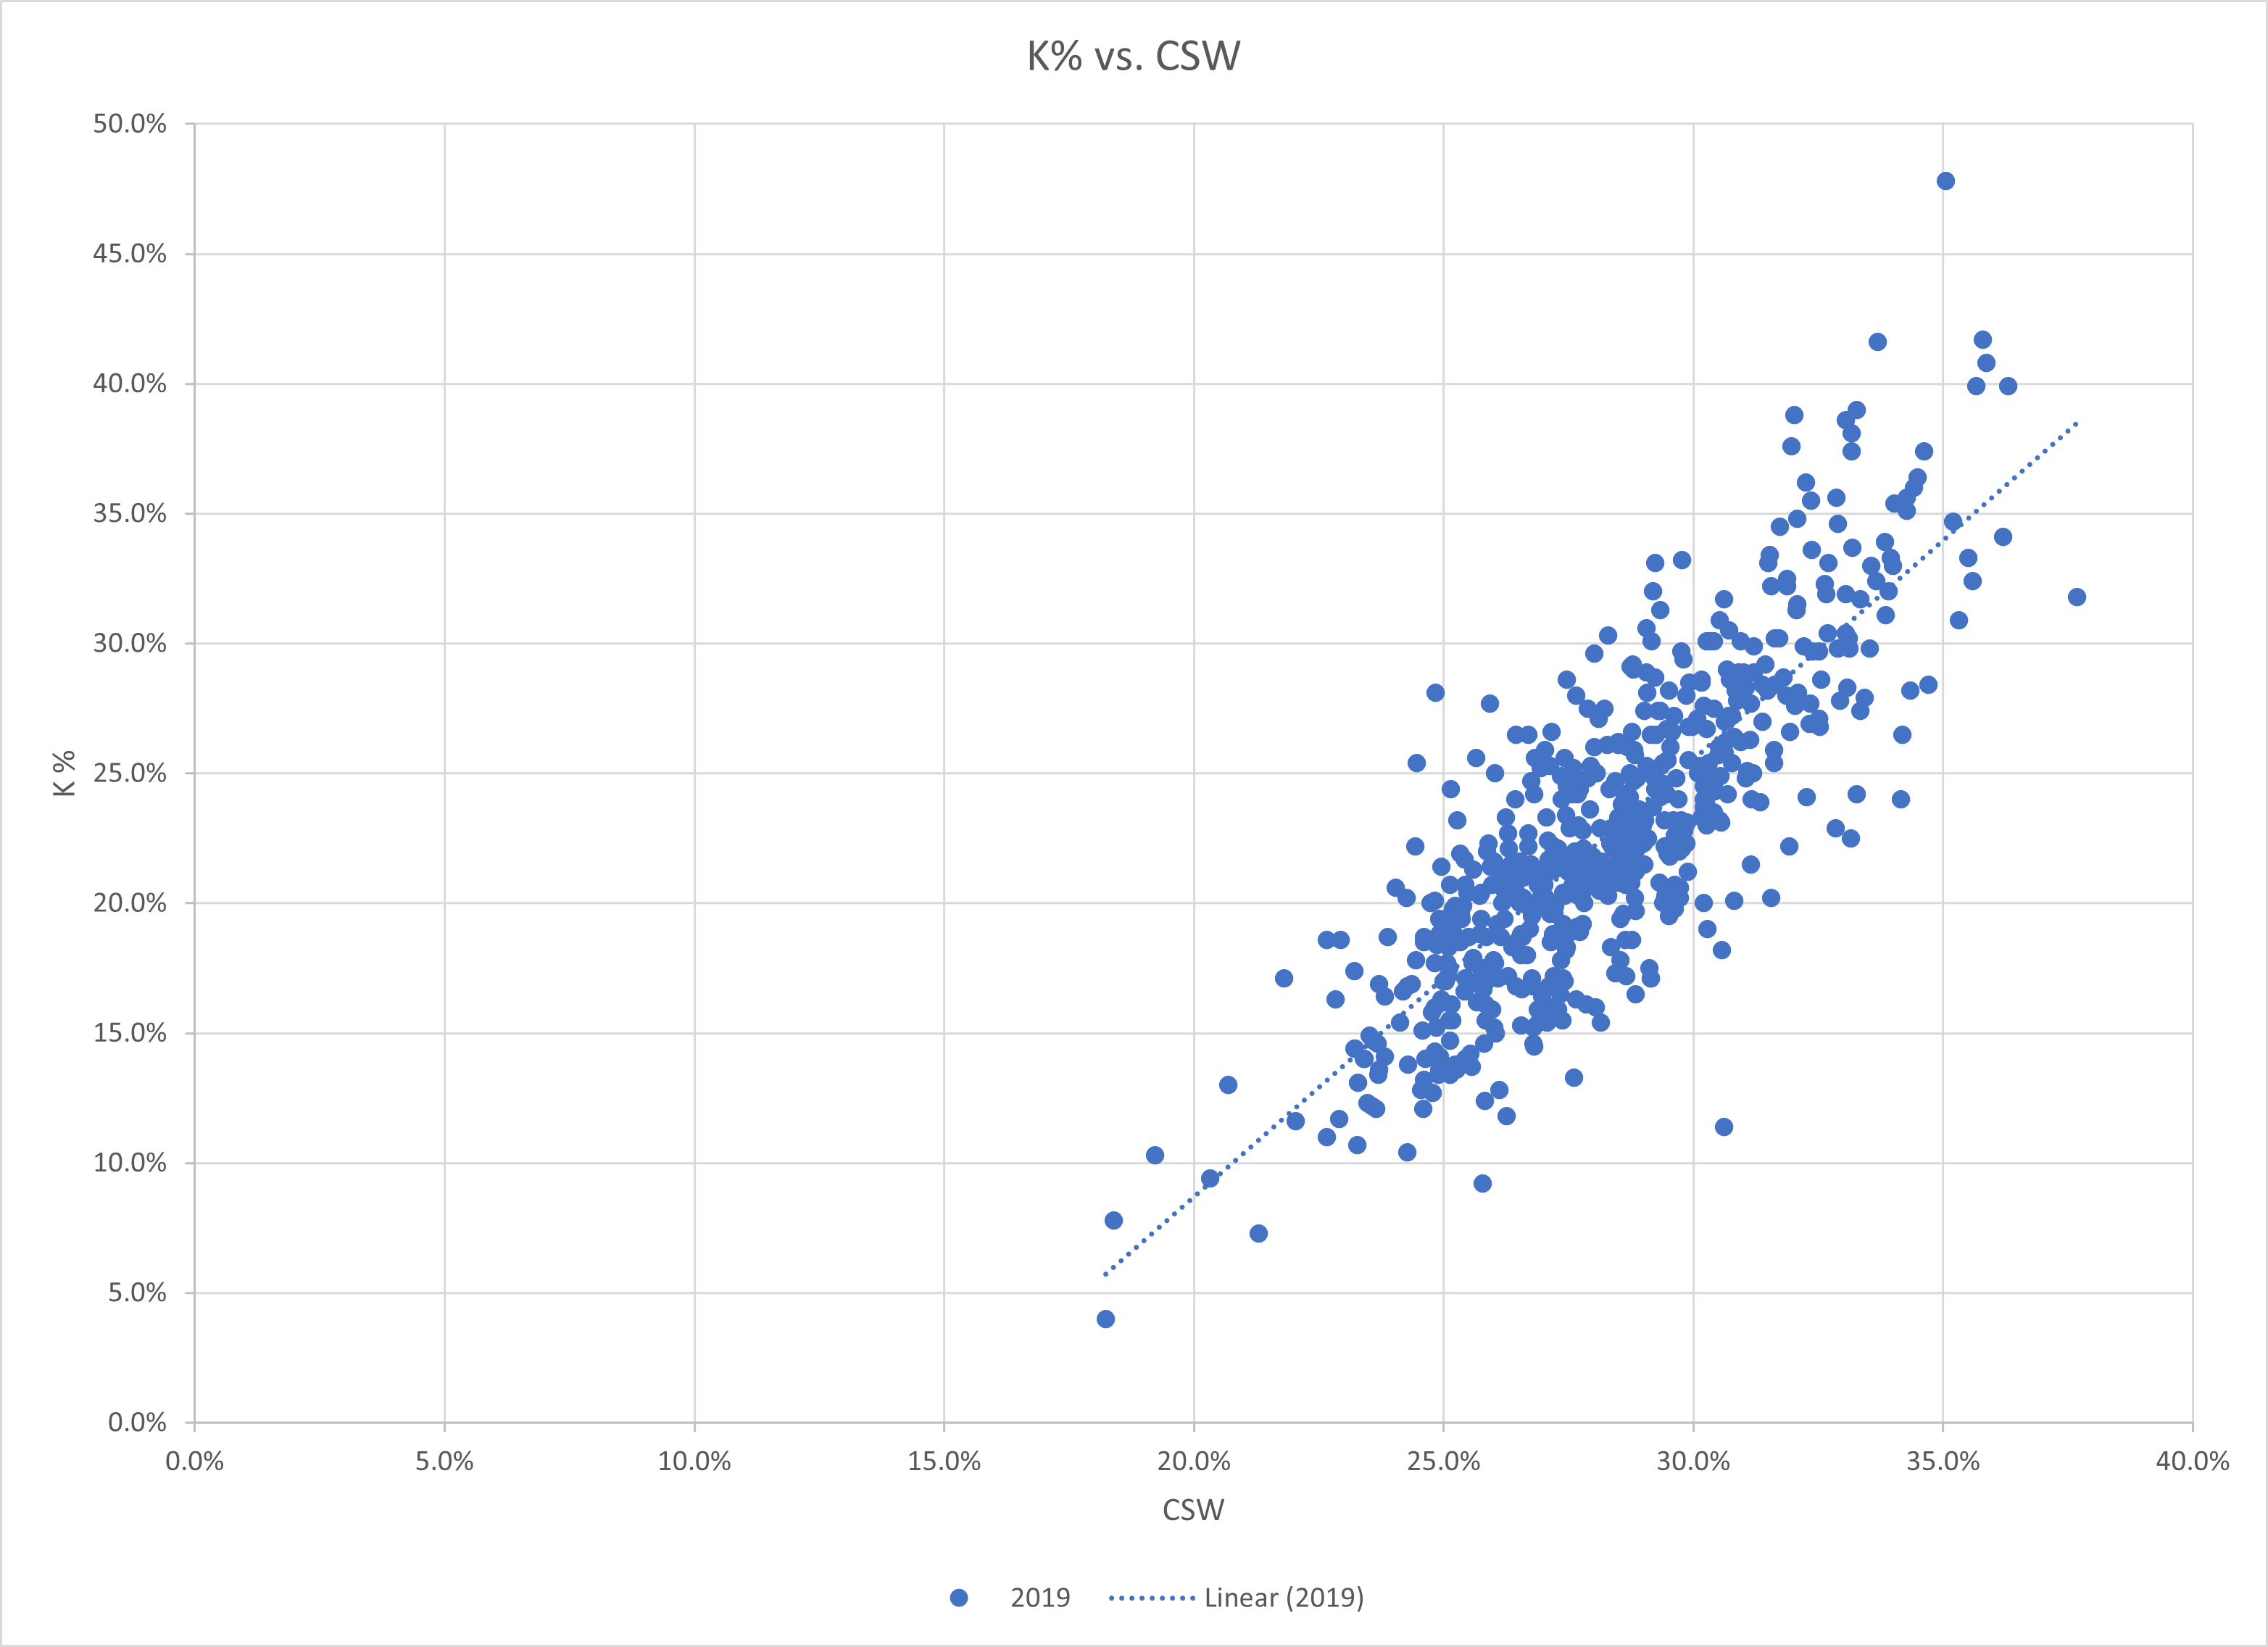
It is evidently clear that CSW is positively correlated with K%. A higher CSW will typically correspond to a higher K%. For the 2019 baseball season, the corresponding R-Squared is a very decent 67%. Alex Fast, in his article, CSW Rate: An Intro to an Important New Metric cited that the R-Squared over multiple seasons studied was an even more robust 72%.
We also notice that the spread of the relationship grows with the value. At the top of the K% leaderboard, the K% to CSW ratio is often above 100%. In the middle of the field, the ratio hovers near 80% (which is the average ratio). Towards the very bottom, the K% to CSW ratio is closer to 50%. To note, the average ratio of K% to wPDICSW is a bit closer to unity, sitting at 82%.
Below are the associated graphs of K% vs. CSW, and K% vs. wPDICSW:

As Fast pointed out in his article, CSW is indeed a worthwhile predictor of strikeout rate. The question now becomes, can we do better – and more specifically, could we do better with the wPDI framework?
We have showed that CSW is best modeled using only four out of six of the possible pitching outcomes – Outcomes A, C, D and F. Removing the two contact outcomes – B (contact of the zone) and E (contact in the zone) led to a more meaningful wPDI approximation formula of CSW.
Would including contact outcomes lead to better predictability of strikeouts?
Let’s find out …
wPDI & Strikeout Rate (K%)
The first order of statistical business is to take a look at the full regression equation using all six pitching outcomes, A through F. Using all variables to model K%, we obtain the following wPDI indexes:
| Index A | Index B | Index C | Index D | Index E | Index F |
|---|---|---|---|---|---|
| 146.6% | -28.8% | 3.8% | 226.2% | -19.7% | 72.2% |
The associated R-Squared of the regression is 70.8%, which is more robust than the 67.0% obtained when using CSW alone. That is a result that I had hoped for!
There are a number of interesting observations that I discern from the calculated indexes (as far as predicting the strikeout rate using wPDI):
- Contact made (Outcomes B & E) has a negative effect on the strikeout rate.
- A swing and miss inside the zone (Outcome D) is 54% more valuable than a swing and miss inside the zone (Outcome A).
- A called strike (generally, Outcome F) is far less valuable than a swinging strike (Outcomes A & D).
- Not swinging outside of the zone (Outcome C) has a very slightly positive effect on the strikeout rate.
Observation #1 seems fairly obvious. Aside from foul balls, we expect that contact does not assist with a strikeout. Even for a foul, although it may add to the strike count on a batter without adding to the ball count – it will rarely directly produce a strikeout. A foul tip straight into the catcher’s mitt would be the only scenario.
Observation #2 is interesting and insightful. I originally conjectured that a strike outside of the zone is more deceptive than a strike inside the zone. [The Maddux Plate Discipline Index (mPDI) is based off of this very premise.] However, the K% regression analysis indicates that swings and misses inside the zone are more predictive of strikeout rate than those outside of the zone.
Observation #3 is fairly understandable. Though more than half of all strikes arise from called ones (58% in 2019), approximately three-fourths of all strikeouts arise as the result of a swing. It is the final pitch that matters more. To use a football parallel, the 1st string runningback might get the bulkload of a team’s yardage, and take the team 99 yards to the goal line. However, if the power running back comes in for the final yard, he is the player to score the touchdown and put up six points on the scoreboard. The one who finishes the drive often matters more.
Observation #4 seems counter-intuitive. Outcome C, which is taking a pitch outside of the zone – is most often called a ball. Unless the umpire is in conflict with technology, Outcome C should not generate a strikeout, and hence produce a non-positive index. Yes, 3.8% is a fairly low figure [noise], but I would have imagined that it should have been signed negatively, if any. As an aside, one should note that our wPDICSW equation did include Outcome C, in the called strike portion – due to umpire error.
In attempting to clean up the regression, our next step is to perform the analysis using only the positive coefficients. Ideally, it would be better not to use negatively signed coefficients for baseball equations, so let’s give it a shot. For our second go-around, we will regress on only outcomes A, C, D & F (which correspond exactly to the wPDICSW indexes).
| Index A | Index C | Index D | Index F |
|---|---|---|---|
| 152.4% | -10.9% | 205.0% | 60.4% |
For the limited regression, the R-Squared went down to 67.8% – which is not an optimal result. What is also interesting to me, is that the sign has now flipped for the outcome C index. Without the contact indexes (Outcomes B & E) present, the regression aligned its sign with our intuition!
With the low value of the C index, and with the non-zero B & E indexes, my next regression refinement run will include all outcomes other than the “called ball.” The following indexes were generated, which produced a higher R-Squared of 70.7%:
| Index A | Index B | Index D | Index E | Index F |
|---|---|---|---|---|
| 149.9% | -25.7% | 224.8% | -17.2% | 75.4% |
Yes, we have a few negatively signed indexes, but they are both intuitive and mathematically needed. For the final plate discipline equation, I will round all indexes to the nearest 5%. I will officially define wPDIK as:
| Outcome | Description | Index |
|---|---|---|
| A | Out of Zone / Swung On / No Contact | 150% |
| B | Out of Zone / Swung On / Contact Made | -20% |
| C | Out of Zone / No Swing | 0% |
| D | In Zone / Swung On / No Contact | 225% |
| E | In Zone / Swung On / Contact Made | -20% |
| F | In Zone / No Swing | 75% |
wPDIK = 150% * A% – 25% * B% + 225% * D% – 20% * E% + 75% * F%
The wPDI approximation of a pitcher’s strikeout rate (K%) yielded an 84% correlation coefficient, which can be seen graphically here:
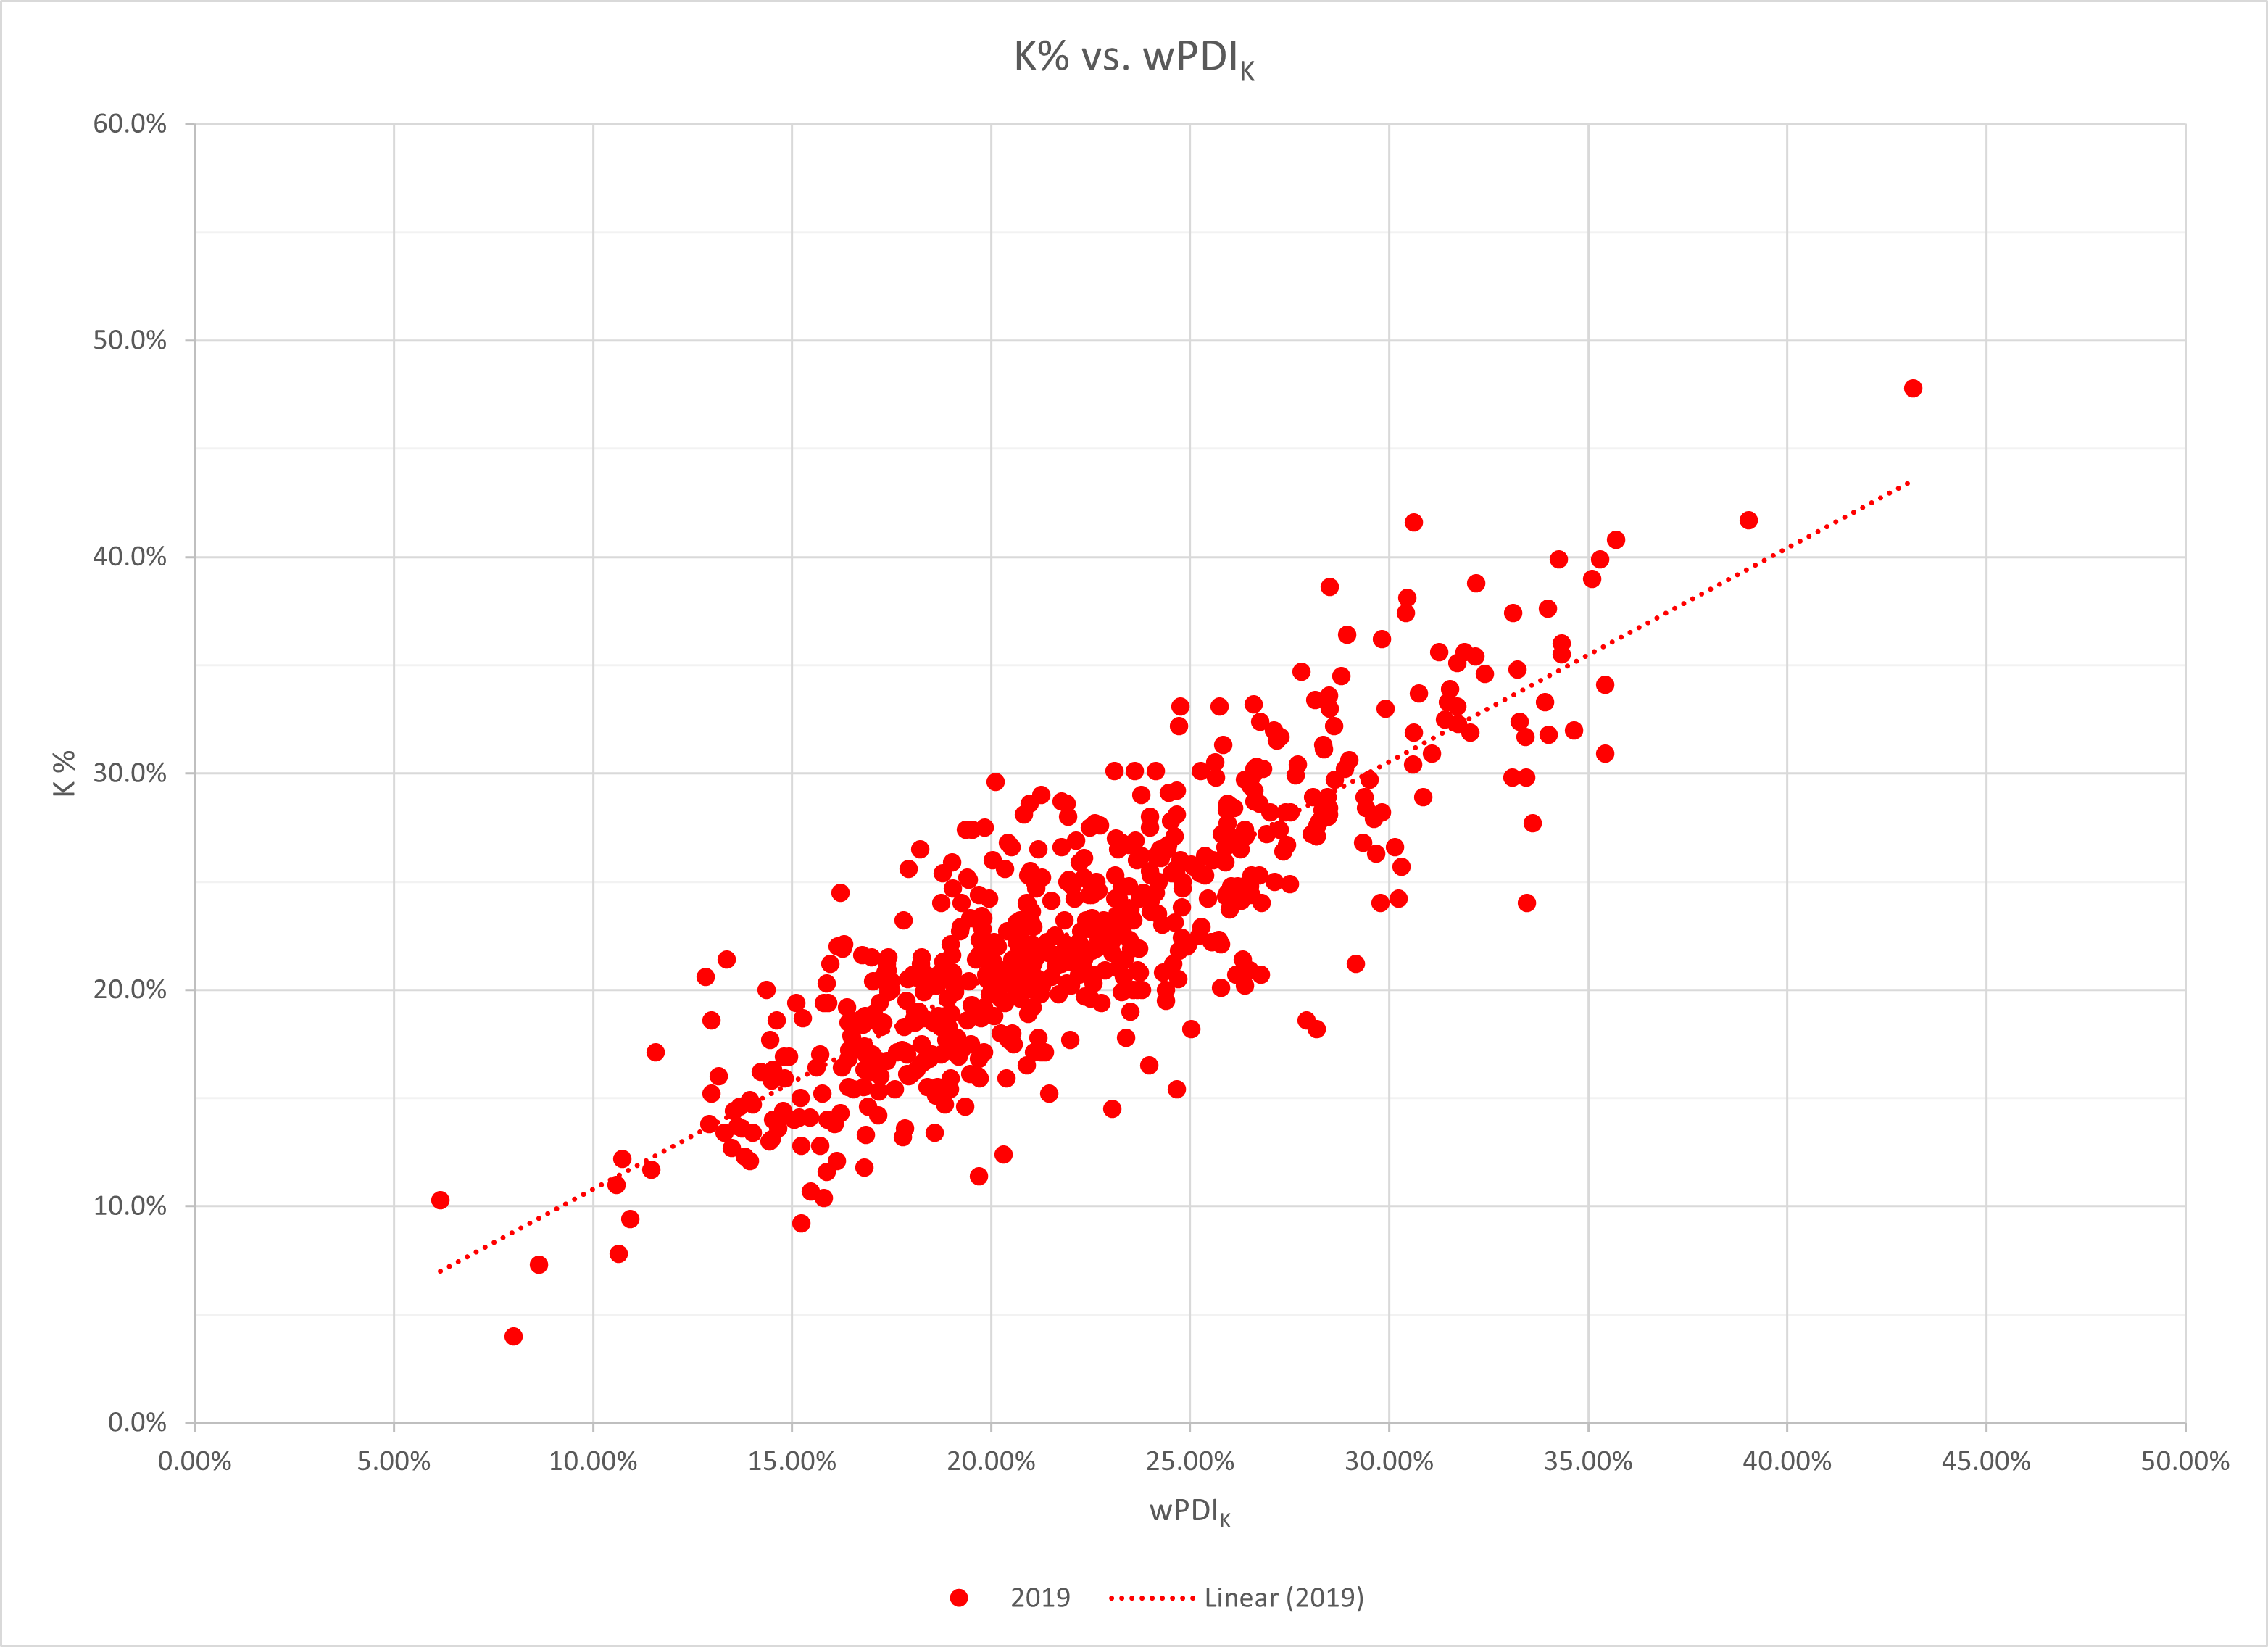
This is a nice result, in that we can approximate a pitcher’s strikeout rate fairly well simply by enumerating if a ball is thrown in the zone, if it is swung on, and if it is contacted.
Although CSW does a good job of foretelling a pitcher’s strikeout rate, wPDIK is a slightly closer representation.
–
We still have plenty of more work to perform with wPDI. In my next article, I will use the plate discipline framework to model a pitcher’s walk rate.
Ariel is the 2019 FSWA Baseball Writer of the Year. Ariel is also the winner of the 2020 FSWA Baseball Article of the Year award. He is the creator of the ATC (Average Total Cost) Projection System. Ariel was ranked by FantasyPros as the #1 fantasy baseball expert in 2019. His ATC Projections were ranked as the #1 most accurate projection system over the past three years (2019-2021). Ariel also writes for CBS Sports, SportsLine, RotoBaller, and is the host of the Beat the Shift Podcast (@Beat_Shift_Pod). Ariel is a member of the inaugural Tout Wars Draft & Hold league, a member of the inaugural Mixed LABR Auction league and plays high stakes contests in the NFBC. Ariel is the 2020 Tout Wars Head to Head League Champion. Ariel Cohen is a fellow of the Casualty Actuarial Society (CAS) and the Society of Actuaries (SOA). He is a Vice President of Risk Management for a large international insurance and reinsurance company. Follow Ariel on Twitter at @ATCNY.
wPDIsubK needs a more marketable name
Really enjoying this series. Thanks for following up on this topic.
Thank you!