Archive for James Shields

Kris Bryant’s Apparent Struggles vs. Offspeed Pitches

As surprising as it may seem, given his immense success in his less than two years at the Major League level, Kris Bryant has come a long way as an offensive player. He’s cut down on his strikeouts. He’s improved his contact rate. These developments have helped to culminate in his status as the top position player in the National League thus far in 2016, according to WAR. But as we saw against James Shields on Tuesday night, which always seems to be the case when the two players meet, there are still some respects in which Bryant could stand to improve.

Now, given where my Major League sympathies lie and the undeniable success that Bryant has experienced in such a short time, it should remain relatively apparent that none of this is meant to disparage the Chicago Cubs third sacker in any sort of manner. And even if one wanted to do so, it’d be very difficult. He’s cut down on his strikeout rate by about seven percent (down to 23.3%, with a decreased swinging strike rate of 13.9%). His overall contact rate is up about five percent (to 71.4%). He’s sporting a .261 ISO. There’s not much of anything to dislike, and that’s just in regard to his offensive game.

But what was abundantly clear on Tuesday night, as Bryant served as the team’s designated hitter, was that he still struggles against the offspeed stuff. In striking out three times against James Shields, just as he did in his Major League debut, Bryant found himself peppered with changeups from the veteran hurler, as he fell to just 1-for-10 with seven punchouts against him in his short career. The goal here is to simply illustrate Kris Bryant’s battle against the offspeed pitches that Shields registered so much success with on Tuesday.

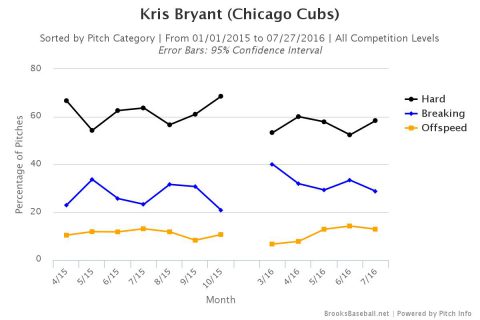
It isn’t that Bryant’s struggles have been magnified beyond that game on Tuesday on the South Side. But it did help to spark acknowledgement of what he has turned in against offspeed pitches throughout his time at the Major League level. The following represent the distribution of pitches that Bryant has seen, swung, and whiffed, respectively:

Brooksbaseball-Chart (10)

Brooksbaseball-Chart (11)

Brooksbaseball-Chart (12)

As is typically the case, offspeed pitches represent the lowest percentage of pitch type that Bryant has seen. And with the exception of an outlier of a month or two over the course of the last two seasons, his swing trends have been relatively consistent in a general sense, regardless of pitch type. Even with those ideas in mind, offspeed pitches have represented the largest percentage of pitches at which he’s swung and missed on a fairly consistent basis.

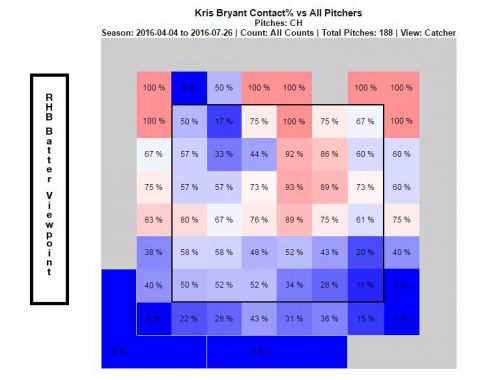
An additional trio of graphs helps to further illustrate Bryant’s issues with the offspeed stuff, specifically changeups, based off of Tuesday night:

Bryant

Bryant2

Bryant3

Again, while the percentage isn’t high, low offspeed does represent the majority where Bryant actually see that stuff, in terms of location. Mainly because if you’re a pitcher leaving offspeed up for a hitter like Bryant, you’re probably looking for that ball in another area code. And while he obviously loves the high offspeed (and what Major League hitter doesn’t?), he’s also demonstrated a pretty high Swing% on those low changeups. And he’s demonstrated a low contact rate on those pitches that he’s shown something of a penchant for swinging at, even if the overall amount of times he actually sees offspeed pitching is relatively low. But, again, the purpose here is to illustrate a potential trend more than anything else.

Obviously, there’s plenty to note here. In summation:

  • He demonstrates a lower contact rate vs. offspeed than other pitch types.
  • The percentage in which he does see offspeed could be increasing ever so slightly.
  • BUT..
  • He sees offspeed less than other pitch types.
  • AND ULTIMATELY..
  • Kris Bryant is still a very, very good hitter of baseballs.

At the end of the day, is the offspeed stuff a cause for concern? Not necessarily in any real regard. Bryant typically has the type of approach that can prevent him from falling into a void like he did on Tuesday, thus largely avoiding offspeed pitches. One thing certainly is worth noting, though, that he’s seen offspeed stuff at an average of 13.33% of the time over these past three months, which represents the highest percentage of his short career over any span. It’ll be interesting to see if Major League pitchers continue to make that adjustment, and if they do, it’ll be equally as interesting to see how Kris Bryant makes his own.


Scott Strandberg’s Ten Bold Predictions for 2016

It’s been a weird week for me, delaying this article by four days. I originally intended to have this up by Monday, but a spontaneous — and completely awesome — decision to attend the NCAA Tournament provided the first delay. I got to see Oklahoma/VCU and the historically unprecedented Texas A&M win over Northern Iowa, so I didn’t feel too bad about being a day late.

Unfortunately, I got myself concussed in a fender-bender the next day (not my fault!), and spent the last few days listlessly staring out my window, the owner of a half-working brain. Hopefully, I’ve recovered enough for the following to make sense, but the fact that my 31st birthday looms this coming Monday means I’m in the midst of my annual birthday-related existential crisis, brain injury or not.

Regardless of the circumstances, it’s Bold Predictions time! I did pretty darn well two years ago, but last year my success rate was roughly equivalent to that of the Brooklyn Brawler. (Fun fact: The Brawler briefly performed in WWF as “The MVP” Abe Knuckleball Schwartz, a bad-guy persona used to rile up fans during the MLB strike of ’94.) Let’s turn the clock back to 2014 and get my boldness rate back to the sweet spot.

Here are my ten Bold Predictions for 2016, roughly arranged in ascending order from safest to craziest:

10. James Shields is not a top-65 starting pitcher, despite throwing 200+ innings for the tenth straight year.

How do we value a 34-year-old coming off a season like Shields just had? He logged over 200 innings and made his annual 33 starts, but posted his worst-ever walk rate — and it’s not even close — at 3.60 BB/9. His HR/FB ballooned to another career worst, at 17.6%. Shields also experienced career bests in two areas, strikeouts (yay!) and strand rate (hmm…).

Read the rest of this entry »


Marcus Stroman: Your AL East Jordan Zimmermann

Jeff Sullivan pointed out that Stroman discovered Roy Halladay’s Sinker and presented his arsenal change (Fourseam and Cutter swapped for more Sinkers):

Stroman_Usage


Stroman upped his Sinker usage and was comfortable using the pitch despite the count situation. From Sullivan’s post on 2/13:

Stroman was comfortable using the sinker when behind in the count against all hitters. Same when he was ahead in the count. Same when he was even. Same on the first pitch. Same with two strikes. He’s got other pitches, a lot of other pitches, and he still has his four-seamer, too, when he wants to elevate some heat, but the sinker has given Stroman something he didn’t have: a groundball pitch he can locate and use to get quick outs.

Read the rest of this entry »


RotoGraphs Audio: The Sleeper and the Bust 2/10/2015

Episode 192

IF YOU DOWNLOADED THE EPISODE BEFORE 12:00 PM CENTRAL ON 2/11, PLEASE RE-DOWNLOAD. IT CUTOFF FOR SOME REASON, BUT I RE-UPLOADED THE FULL FILE.

The latest episode of “The Sleeper and the Bust” is live!

In this episode, Paul Sporer and Eno Sarris discuss James Shields, Sean Doolittle, Todd Frazier, and Jon Jay before diving into the AL West and covering Houston, Los Angeles, and Oakland!

As usual, don’t hesitate to tweet us or comment with fantasy questions.

You can subscribe to the podcast on iTunes or via the feed. Please rate & review the show in iTunes letting us know what you think!

Thanks to Ian Miller, aka Teen Archer, for the intro music. Approximately 80 minutes of joyous analysis.

01:19:20

Shields Sweetens San Diego Staff

It’s time for our Depth Chart Discussions to begin. In an effort to suss out every team, we’ve divided them into four parts (infield, outfield, bullpen, and rotation) and will begin breaking them down for you over the next few weeks. You can find them gathered here.

We all know how valuable a pitcher in Petco Park can be, even if they aren’t on the high end of the talent spectrum. Thankfully for us in 2015, the Padres staff will have some of that upper-end talent paired with a far more capable offense to support it. It is incredible how much one addition can make a difference for a club as the rotation looks so much more formidable now with their latest signing. Here is how the top four stack up:

Read the rest of this entry »


Building a Closer Through Outcomes

There are a sundry of middle/set-up relievers that can succeed in the closer role if given the opportunity. A few obvious: Wade Davis if something happens to Greg Holland… Wil Myers for James Shields and who?!; Ken Giles if the Phillies can somehow find a trade partner for the grundle-grabber; and Brad Boxberger if not Jake McGee. I assume David Robertson signs elsewhere and Dellin Betances steps in.

Lets’ look at potential closers using reliever outcomes. Here are the average contact and balls in play-related outcomes for all relievers that qualified and specifically relievers with 10+ saves:

Command: K% BB% K-BB% Ct% SwStr% Zn% F-Str%
AVG for RP w/ > 10 SV 0.27 0.07 0.19 0.75 0.12 0.46 0.63
SD for RP w/ > 10 SV 0.08 0.03 0.08 0.06 0.03 0.04 0.04
AVG for all qualified RP’s 0.22 0.09 0.14 0.77 0.11 0.45 0.60
SD for all qualified RP’s 0.07 0.03 0.07 0.05 0.03 0.04 0.05
Balls In Play: GB% FB% IFFB% GB/FB HR/FB LOB% BABIP
AVG for RP w/ > 10 SV 0.43 0.37 0.11 1.40 0.08 0.78 0.275
SD for RP w/ > 10 SV 0.11 0.10 0.04 1.02 0.05 0.08 0.042
AVG for all qualified RP’s 0.45 0.35 0.09 1.50 0.09 0.75 0.289
SD for all qualified RP’s 0.10 0.09 0.05 0.81 0.05 0.08 0.044

Our Filters: 

  • Contact-related outcomes: For K-BB%, Ct% and SwStr%, I filtered simply by the general relief pitcher averages. Everyone below average in these 3 categories was filtered out.
  • Command-related outcomes: For zone% and first-pitch-strike%, I used 1 standard deviation below average and 1.25 SD’s below average in BABIP as filters. 1.25 SD allowed me to omit only the relievers that had career BABIP’s higher than we would like to see for a closer or in general. I didn’t want to screen out Jenrry Mejia (1.24 SD below the mean) or Tim Stauffer (1.19 SD below), because there’s a possibility for BABIP regression.
  • Balls In Play-related outcomes: I was lax on the balls in play outcomes. I went with a 40% Grounder rate and 45% Flyball rate as my filters versus the averages that you see above because below average fly-rates don’t mean much in places like Tampa (where Boxberger is elite but below average in fly-rates); and above average grounder-rates don’t mean as much with atrocious defense behind you (hence Corey Kluber’s unlucky BABIP, which should have been closer to .299 per end-of-season xBABIP/Inside Edge data), but I digress.

Using these filters, we’re left with a robust list of above-average relievers beyond just closers (scroll down for the noted filters):

What happens if we use the command (K-BB%)/contact (Ct% and SwStr%) related averages for relievers with more than 10 saves this year? 

…We’re left with some elite closers and then a few interesting names.

Last year, Danny Farquhar (just missed the list this year) had a top 20 swinging-strike rate – about a percent better than Fernando Rodney, but it was masked by his BABIP and left-on-base rate that killed his surface stats (4.20 ERA vs. 2.40 xFIP). This year, he actually outperformed his xFIP with a 2.66 ERA. After an early season MASH Report on Rodney’s velocity, I eyed Farquhar. At least keep him in mind next year if anything does happen to Rodney.

Josh Edgin (Mets for those of you that don’t know) has a top 65 contact-rate sandwiched between Mark Melancon and Jake McGee and even induced grounders 50% of the time. He has a pretty extensive repertoire as well. In order of usage: Fourseamer, Slider, Curve, Change, Cutter and Sinker. According to his Brooks Player Card, he has great swing and miss rates on his Curve (>56%), Cutter (50%), Slider (>42%) and Sinker (33%). Even his Change approaches 30%. This isn’t the case on his Fastball, but at 93+ MPH, it induces a decent amount of grounders (1.8 GB/FB). Keep in mind he had late-season elbow issues which effected his velocity by a MPH or so, but he could be called upon to get Mejia out of a jam. I like him better than an unhealthy Bobby Parnell and Jeurys Familia from a command perspective for another year.

Zach Duke did his best Craig Kimbrel impression prior to the R2M monster hitting him in August. Prior to 8/1, Duke had a 34.9% K-rate and 27.3 K-BB%. Kimbrel ended the year with a 38.9% K-rate and 28.3 K-BB%. I think August and September brought him back to his realistic value (~2.50 ERA, 1.15 WHIP). It will be interesting to see who closes for the Brewers if they let Francisco Rodriguez go. Both Duke and Will Smith have above average (even for RP w/ 10+ saves) swing-and-miss. Will Smith should have additional command next year, but Zack Duke induces grounders better which I like in my closers/in Milwaukee. They also have Jonathan Broxton. The hierarchy seemed to be K-rod-Broxton-Smith late last season. If that’s the case, they should use Duke more (former starter) and in higher leverage situations. He was equally solid against both lefties (.258 wOBA) and righties (.262 wOBA).

Oliver Perez everybody! I thought I could filter him out by his splits being a lefty, but like 2012, he was more effective vs. righties (and faced 44 more of them). The D-backs have Addison Reed, up-and-comer Evan Marshall as well as Daniel Hudson caught touching 97 MPH so if not by outcomes or splits, we can filter Perez out by opportunity.

Darren O’Day and Andrew Miller is part of one dominating Baltimore bullpen – one that gets referenced by anyone who thinks the Orioles can beat the Tigers in the ALDS. Notice that Zach Britton didn’t make either of the above lists! He was filtered out by his below average K-BB% (13.70%). It’s his 75+% grounder rate (hence the 81+% left-on-base rate and .215 BABIP) that keeps him elite in Baltimore. The only concern you can have with O’Day is a fastball velocity almost 2 standard deviations below the mean for relievers, but his arm angle combined with that slider still induces a 30+% whiff-rate on both pitches. Miller’s slider though is a world apart from O’Day’s: only Pedro Strop, Will Smith, Jake Diekman, Greg Holland and Oliver Perez induces more whiffs than Miller’s 55% according to Baseball Prospectus’ Pitchf/x Leaderboards.  I doubt we’ll see a closer-transition next year in Baltimore unless Britton’s GB/FB ratio takes a drastic dive because his HR/FB ratio, which approached 18%, could be an issue.

An xBABIP review

On the last day of the season, @jeffwzimmerman provided me with Pitch xBABIP based on inside edge data. Let’s look at some of the bigger xBABIP differentials to keep in mind:

The last column depicts the z-score for BABIP differential. Francisco Rodriguez was expected to have a BABIP about 120 points above his actual BABIP. I highlighted (red/bad; green/good) the xBABIP z-scores as well so that you know whether or not to actually be concerned meaning sure Aaron Sanchez has the 5th biggest BABIP differential (over 2 standard deviations from the mean), but a .239 xBABIP is still utterly elite (3.34 SD’s from the mean). On the other side of the equation, it’s nice to see Evan Marshall, Carlos Martinez and Adam Ottavino (albeit in Colorado) with large BABIP differentials. Marshall and Martinez even have xBABIP’s over .5SD from the mean.

The last bit of fun

It was a very fun year to be doing bullpen reports for RotoGraphs. Aroldis Chapman broke the single-season strikeout rate of 2012 Craig Kimbrel (50.2%). He struck out 52.5% of the hitters he faced. Andrew Miller (42.6%) and Brad Boxberger (42.1%) also made the top 10 seasons ever. Dellin Betances (39.6%), Wade Davis (39.1%) and Craig Kimbrel (38.9%) made the top 20. Chapman’s swinging-strike% of 20% beat ’12 Kimbrel by .8%, but he couldn’t pass ’04 Lidge, ’03 Gagne, ’04 Gagne, ’02 Gagne or ’05 Lidge. Chapman, Miller, Doolittle, Boxberger, Betances (Wade Davis and Kenley Jansen close behind) all had historical, top 20 K-BB rates. Relievers dominate this list: only ’99 Pedro Martinez (#12), ’00 Pedro Martinez (#21), ’01 Randy Johnson (#27) and ’01 Pedro Martinez (#28) make it into the top 30, but it’s clear that we have a growing list of elite relievers.

From a fantasy perspective, thanks to 45+ saves totals out of Holland and Kimbrel, we had two relievers ranked in the top 20 pitchers. If Chapman didn’t miss time and Betances and Davis consumed the closer role, we would have had 3 others. Last year, Craig Kimbrel and his 4 wins, 50 saves, 98 SO’s, 1.21 ERA and .88 WHIP campaign made him the 3rd most valuable pitcher. This year with Kershaw, Cueto, Felix and Kluber, it would have taken even more.

If we combined the 3 more dominating performances exclusive of saves this year: Aroldis Chapman’s K-rate (52.5%) and saves total (36), Dellin Betances IP (90) – who was dominating in his own right, Wade Davis’ ERA (1.00) and Wins total (9) and Sean Doolittle’s WHIP (.73) – let’s call this guy Aroldellin Dooldavis, we would wind up with a 10.95 z-sum…just above Corey Kluber (10.72), but under Clayton Kershaw (13.74), Johnny Cueto (12.95) and Felix Hernandez (12.50). Even 50 saves wouldn’t have done the trick (12.43 z-sum):

Name Age IP WHIP zWHIP ERA zERA W zW SO zSO SV zSV 5×5
Clayton Kershaw 26 198.1 0.86 4.23 1.77 3.53 21 3.38 239 2.95 0 -0.34 13.74
Johnny Cueto 28 243.2 0.96 3.91 2.25 3.22 20 3.16 242 3.01 0 -0.34 12.95
Felix Hernandez 28 236 0.92 4.29 2.14 3.37 15 2.06 248 3.12 0 -0.34 12.50
Aroldellin DoolDavis 25 90 0.73 2.50 1 2.25 9 0.74 177 1.77 50 5.17 12.43
Corey Kluber 28 235.2 1.09 2.14 2.44 2.69 18 2.72 269 3.52 0 -0.34 10.73
Adam Wainwright 32 227 1.03 2.79 2.38 2.72 20 3.16 179 1.80 0 -0.34 10.13
Jon Lester 30 219.2 1.1 1.88 2.46 2.46 16 2.28 220 2.59 0 -0.34 8.86
David Price 28 248.1 1.08 2.40 3.26 0.89 15 2.06 271 3.56 0 -0.34 8.56
Chris Sale 25 174 0.97 2.68 2.17 2.43 12 1.40 208 2.36 0 -0.34 8.52
Madison Bumgarner 24 217.1 1.09 1.97 2.98 1.35 18 2.72 219 2.57 0 -0.34 8.27
Zack Greinke 30 202.1 1.15 1.18 2.71 1.78 17 2.50 207 2.34 0 -0.34 7.46
Max Scherzer 29 220.1 1.18 0.94 3.19 0.93 18 2.72 252 3.20 0 -0.34 7.45
Jordan Zimmermann 28 199.2 1.07 2.02 2.66 1.85 14 1.84 182 1.86 0 -0.34 7.22
Julio Teheran 23 221 1.08 2.13 2.89 1.57 14 1.84 186 1.94 0 -0.34 7.13
Stephen Strasburg 25 215 1.12 1.61 3.14 1.01 14 1.84 242 3.01 0 -0.34 7.12
Garrett Richards 26 168.2 1.04 1.96 2.61 1.64 13 1.62 164 1.52 0 -0.34 6.39
Greg Holland 28 62.1 0.91 1.11 1.44 1.28 1 -1.02 90 0.10 46 4.73 6.21
Craig Kimbrel 26 61.2 0.91 1.09 1.61 1.16 0 -1.24 95 0.20 47 4.84 6.06


Not Drafting James Shields Next Year

A quick look at the player page of James Shields might lead you to believe that he has returned his draft day value for his fantasy owners. His ERA is only a tick higher than it was last year, his WHIP is exactly the same, and his K-BB% is virtually the same. But he’s only been the 39th best starting pitcher according to ESPN’s player rater despite being the 17th pitcher taken on average back in March. To be fair, there is value in a pitcher not being a bust. Shields owners are surely happier with what they’ve gotten out of him than are the owners of pitchers that he was sandwiched between in final ADP, Homer Bailey and Matt Cain. But because it might appear that Shields has been as good as people expected him to be and because he’s been good for four years now, his ADP is likely to be near the top 20 among starters again next year. And it would be a mistake to pay that price. Read the rest of this entry »


Can These Royals Help?

The Kansas City Royals have been one of the most enigmatic teams in the last few years. Not because they’re small market or because they’ve been a perennial punching bag for the rest of the American League, but because expectations have been on the rise for some time now and they consistently fail to deliver. Once the worst farm system in baseball, the Royals were suddenly flush with all of this great, young talent. We saw the debuts of players like Eric Hosmer and Mike Moustakas and watched as they added key pieces like Lorenzo Cain and Alcides Escobar. They hadn’t quite put it all together over the last two seasons, but this year, with a revamped rotation, the Royals became darlings in the American League and some even thought they could compete for a wild card this year. But while James Shields and Jeremy Guthrie did their part early on, the hitters failed miserably. The young studs were a disaster and after a modest 14-10 April, things spun out of control as the Royals went 8-20 in May and opened June 1-2. Manager Ned Yost was at a loss. He shuffled the lineup dozens of times without success. They fired their hitting coach and replaced him with the legendary George Brett, hoping that some Royals royalty would jump start the offense. But instead, it was the nerds who got things going for the Royals. Yost put the lineup decision into the hands of the sabermetric boys and the next thing we knew, Kansas City was on a six-game winning streak. Read the rest of this entry »


Daily Fantasy Strategy – 6/7/13 – For Draftstreet

The platoon advantage is a well established concept. And it’s one of the most important factors, if not the most important factor, when picking hitters in daily fantasy contests. When I pick hitters, I start at the bottom of the list at each position and scroll up until I find a hitter that is facing a pitcher of the opposite handedness who also happens to not be very good.

The problem with this strategy is that not all hitters have a normal platoon split, and others have about the same level of success against both LHP and RHP. The other issue is with switch hitters. Every day I have to look up a switch hitter’s splits from each side.

Below are two charts I’ve created to make this process easier. The first shows the players who are either better against pitchers who throw from the same side from which they hit or players who have roughly equal success against pitchers of either handedness. The second shows the splits for switch hitters. Read the rest of this entry »


Kicking Rocks: Don’t Chase the Ace

For years I have preached about the immense depth at starting pitching.  You can find plenty of quality starters for cheap in your draft and, with the help of the waiver wire, can build a successful fantasy rotation without having to invest heavily in an ace or two.  With a nice complement of some quality relievers, you can go cheap on starters and, in turn, bulk up on better hitters.  In the end, your team dominates in the offensive categories, puts up a solid showing in almost all of the pitching categories, and leaves you at the top of your standings by season’s end. Read the rest of this entry »