More Batted Ball Analysis
Recently, I started working through predicting which pitchers limit hard contact and by how much. Today, I dive into if contact out of the strike zone can be predictable and if that contact is weaker than contact in the strike zone. First, I need to go over a couple of concepts
WAR Allocation to Position Players
The division of credit for WAR goes with 50% to hitting and 43% to pitching and 7% to fielding. People way smarter than I have determined that split.
Major Note: For simplicity, I’m going to adjust the pitching percentage up to 100% so the fielders are allocated 14% of the credit for what happens when a pitcher is on the mound.
On top of the fielding allocation, not every batter puts the ball in play with the league at an 8.7% BB% and 23.4% K% this season. So now, 68% of all at-bats end with a ball in play with 14% points of that 68% goes to the fielders and 54% (68%-14%) to the pitcher’s batted ball talent. So it works out that 79% (54%/68%) of a pitcher’s batted ball results should be attributed to him.
Because of this division of credit, the batted ball results from pitchers will have a tough time correlating between any two time-frames with the defense behind them constantly changing. When an analyst is trying to find how a pitcher limits hard contact, they are working with one hand tied behind their back.
vsISO Correlation
Normally, the batted ball pitchers allow fall into two buckets, home runs and everything else (e.g. BABIP). With so many factors going into the result of a hard-hit ball (e.g. stadium and weather), I wanted a factor that wasn’t just BABIP or home run per something (flyball, inning, ball in play). I went with the allowed Isolated Power (vsISO).
Like most of the batted ball metrics, it doesn’t correlate great season to season (r-squared of .06).
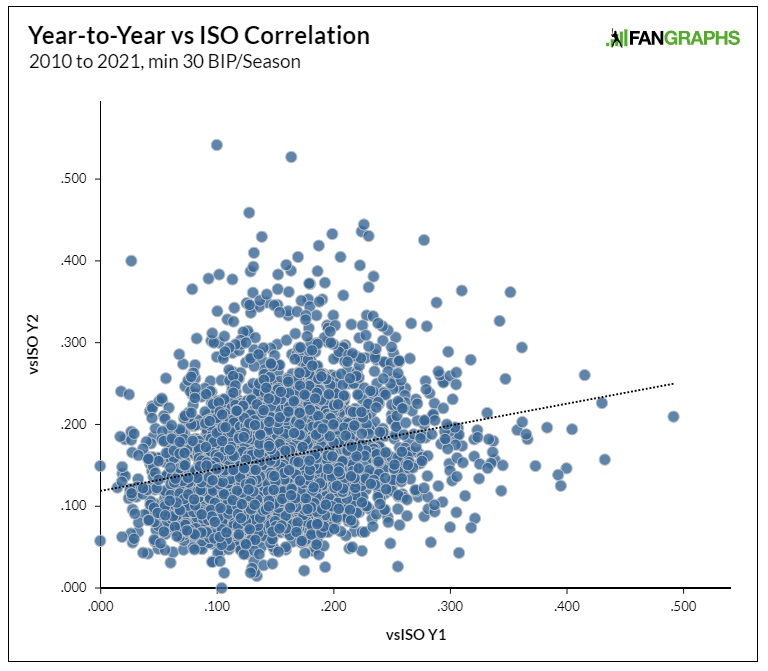
Here it is again with at least 200 batted balls per season (r-squared of .10)

It’s not perfect and if some stat was, it would already be in use. Instead, vsISO is just another option.
Recap
I planned on working through four possible ways a pitcher can create weak contact and I’ve already investigated the groundball/flyball issue. Since the first article, I remembered I had looked into two-strike counts and found nothing. I still believe there may be something to the idea so I will include it for now and maybe try again to see if anything is there.
- After contact, the ball coming off the top (popup) or bottom (groundball) of the bat.
- The batter chases a pitch out of the strike zone and makes a less than full-effort swing.
- The batter is taken off guard by the pitch’s speed (fast or slow) and can’t make a full-effort swing.
- The batter is deceived by the speed/location of the pitch and makes contact off the end or handle of the bat (h/t to Kenny Butrym).
- With two strikes, the batter shortens up his swing just hoping to put the ball into play.
So it’s time to work down the list to see if contact out of the strike zone limits hard contact.
Out of the Strikezone Contact Rate (O-Contact%).
What a mess this turned into but there was some progress. First here at FanGraphs, we have two outside contact metrics. First there is regular O-Contact% which is produced by Sports Info Solutions. The other is piO-Contact%. Pitch Info provides FanGraphs the pitch data and we determine if the data is in or out of the strike zone.
Second, I created a new metric that shows how often on any pitch that it’s 1) out of the strike zone and 2) the hitter will swing and make contact with it. To calculate this value I used:
(1 – Zone%)(O-Swing%)(O-Contact%) = Generating Outside Contact (or GOC in table)
Most of these values range from 8% to 12%.
Then, I checked to see if the two outside contact values were sticky from season to season. I examined all pitchers who had at least 30 IP in back-to-back seasons over the past 10 years. Both values were stable at 30 IP. I could have looked back to find the exact point, but that precise number doesn’t matter, just that the values are predictive.
Next, I tried to see how the four outside contact values compared to Avg EV, HR/FB, HR/BIP, BABIP, and ERA-xFIP for the 2020 and 2021 seasons (used because of Hawkeye pitch tracking with the details in the previous article). Here comes a lot of zeros (min 30 batted balls).
| Batted Ball Metric | piO-Contact% | O-Contact% | piGOC | GOC |
|---|---|---|---|---|
| Avg EV | 0.00 | 0.00 | 0.03 | 0.05 |
| BABIP | 0.00 | 0.00 | 0.00 | 0.00 |
| HR/FB | 0.00 | 0.00 | 0.00 | 0.00 |
| HR/BIP | 0.00 | 0.00 | 0.00 | 0.01 |
| vsISO | 0.03 | 0.04 | 0.00 | 0.00 |
| ERA-xFIP | 0.00 | 0.00 | 0.00 | 0.00 |
So just four values show any correlation* and the higher values were for regular O-Contact% and the GOC%. When I upped the batted balls to 300 in play, the r-squared for between Avg EV and Contact% jumped to 0.11 and went to .07 for vsISO and GOC%. Not great but better.
In all fairness, if there were no correlations, I would not have been surprised one bit. Instead, I have two possible variables that explain a small amount of a pitcher’s batted ball results. That’s it for this edition and hopefully, I can knock out the last two possible causes in my next article.
* I looked into HR/BIP value and it was just a blip. As a increased the sample size, the correlation melted away.
Jeff, one of the authors of the fantasy baseball guide,The Process, writes for RotoGraphs, The Hardball Times, Rotowire, Baseball America, and BaseballHQ. He has been nominated for two SABR Analytics Research Award for Contemporary Analysis and won it in 2013 in tandem with Bill Petti. He has won four FSWA Awards including on for his Mining the News series. He's won Tout Wars three times, LABR twice, and got his first NFBC Main Event win in 2021. Follow him on Twitter @jeffwzimmerman.
Can’t wait to see it applied. Really hard for me to follow have to reread every paragraph.
Going into the weeds isn’t the best reading, but I’ve got to put the information out there before I can make any claims.