Predicting Pitcher Traits for Weak Contact (Part 1)
Sometimes conclusions to tough questions just don’t sit right, especially when the answer is “We don’t really know.”. How pitchers control batted balls has never had a simple definitive answer. I’m going to give it another shot.
I have some ideas of what might be a cause, but I want to start with a blank slate. What’s got me diving back in is the following table from a recent article of mine.

While a few percentage points of difference may not seem like much, I expected a lot more regression to the mean with my limited sample size. With just the above information, I felt I needed to re-investigate the subject. I know that some of the regression amounts have previously existed, but I wanted to dive in with some fresh eyes and new batted ball data.
Predicting pitcher batted-ball data is so hard because so many other variables are in play:
- The batter.
- The defense behind the pitcher.
- The size of the umpire’s strike zone.
- The stadium dimensions (home run distance and foul ground territory).
- The natural elements (wind, temperature, elevation).
- And more recently, the ever-changing baseball.
Trying to get past these factors, I want to just focus on the pitcher-hitter matchup. The other factors still have some influence like a hitter expanding to the umpire’s personal strike zone or the pitcher catching more of the plate with the wind blowing in. For now, I’m just going to have to assume they are nonfactors.
With those guidelines, I could think of three possible ways a pitcher limits contact and my Twitter followers helped point out another:
- After contact, the ball coming off the top (popup) or bottom (groundball) of the bat.
- The batter chases a pitch out of the strike zone and makes a less than full-effort swing.
- The batter is taken off guard by the pitch’s speed (fast or slow) and can’t make a full-effort swing.
- The batter is deceived by the speed/location of the pitch and makes contact off the end or handle of the bat (h/t to Kenny Butrym).
Let me see how far I can get into investigating each today.
High or Low on the Bat Contact
Being a heavy groundball or flyball pitcher has been a known trait to limit hard contact for years. I’m not going to recreate the wheel, but take advantage of new technology. The batted ball data was originally tracked using Trackman technology. Not every ball was trackable so MLB placed the untracked balls into just a few buckets as noted here. In 2020, MLB moved to the Hawkeye technology which tracked almost all batted balls.
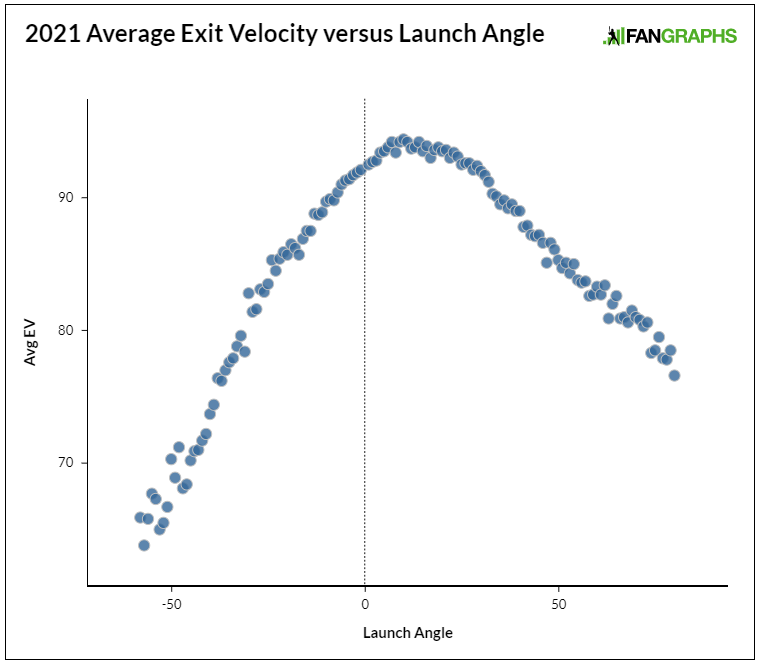
With the improved information, I began grouping batted balls to find out how much weak contact can be predicted based on just the launch angle. First, here is a graph of the average non-bunt, non-foul exit velocities.
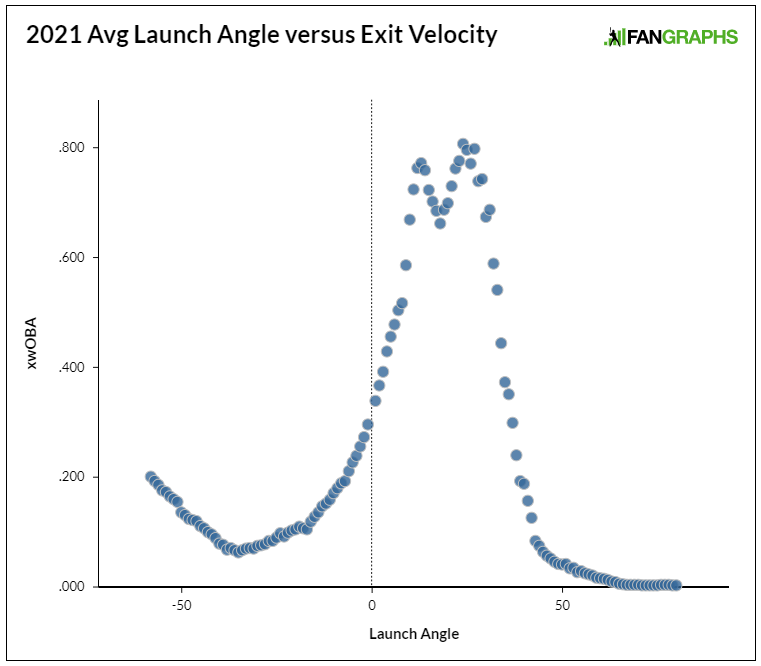
And here is the xwOBA for the various launch angles.
With the above information, I spent a ton of time cutting up and comparing it to the 2020 data. I settled on grouping the batted balls into an ‘over 40 degrees’ and ‘under -5 degrees’ buckets. Here are the corresponding launch angles and xwOBA values for those two cutoffs.
| LA | Avg EV | xwOBA |
|---|---|---|
| -5 | 91.3 | .227 |
| 40 | 89.0 | .188 |
A balancing act was needed to get the high and low values similar along with having the values predictive from season to season. I can’t run a robust stabilization procedure, but I made great in-roads with xwOBA. The breaks were predictive even in small samples.
Here are the 2020 to 2021 comps (min 30 batted balls) for the under -5 group and over-40 group.

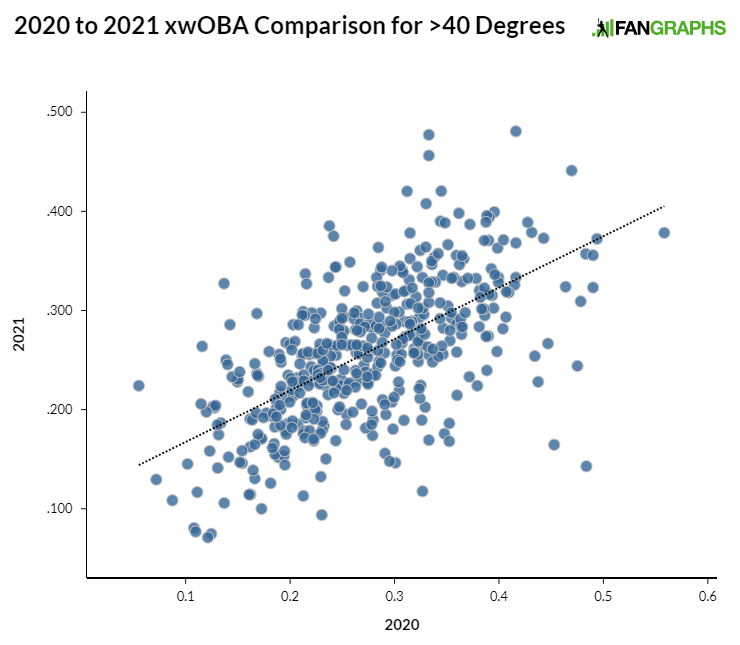
The r-squared for the groundball is .55 and .38 for the flyballs. With the two extreme values, I had the bright idea of adding them together to get a combination of “weak” power. Here is that comparison.
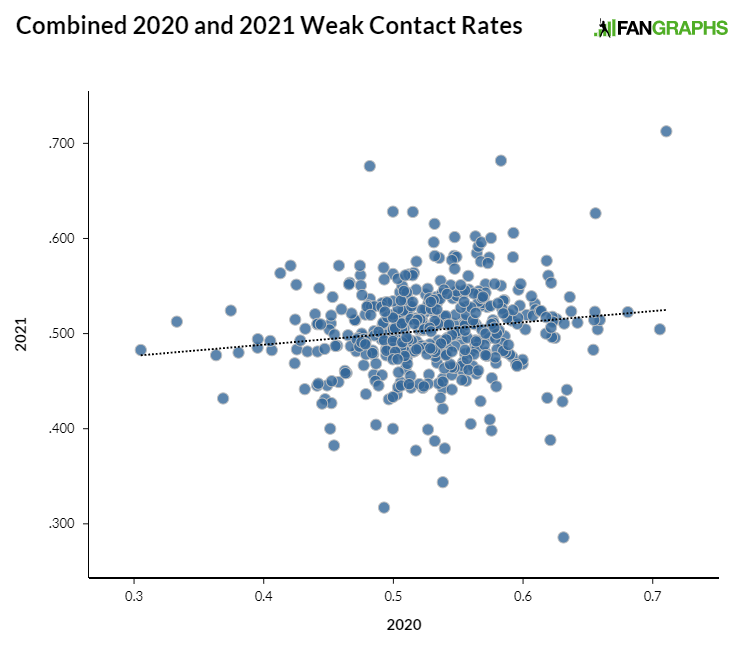
Oh, that got worse with a .02 r-squared value. It’s inherently best to keep the two values separate when projecting batted ball values.
One final step. I took the percentage of pitches in the ‘>40’ and ‘<-5’ zones and used them as the x-variables in a linear regression model. For the y-variables, I used various batted ball metrics. Here are the r-squared values (min 30 batted balls).*
| Metric | Both | <- 5 degs | >40 degs |
|---|---|---|---|
| vsISO | 0.157 | 0.108 | 0.003 |
| ERA-xFIP | 0.126 | 0.001 | 0.061 |
| HR/BIP | 0.119 | 0.102 | 0.013 |
| BABIP | 0.116 | 0.001 | 0.056 |
| HR/FB | 0.108 | 0.011 | 0.092 |
In some instances, one value holds up decent on its own (e.g. ‘< -5v’ vs ISO) but the combination improves the results. Again, having has many batted balls on the extremes can lead to desirable batted ball results.
That’s it for now. The other three possible sources for soft contact need to be investigated next.
* Because of all the prelisted issues with batted balls, I’m not huge on significance with batted ball information. In the listed instance the highest significance value was 0.055. Not great, but it’s usually much worse.
Jeff, one of the authors of the fantasy baseball guide,The Process, writes for RotoGraphs, The Hardball Times, Rotowire, Baseball America, and BaseballHQ. He has been nominated for two SABR Analytics Research Award for Contemporary Analysis and won it in 2013 in tandem with Bill Petti. He has won four FSWA Awards including on for his Mining the News series. He's won Tout Wars three times, LABR twice, and got his first NFBC Main Event win in 2021. Follow him on Twitter @jeffwzimmerman.